There exists a well-known, yet nevertheless continuously striking graph that seemingly demonstrates at a single glance the incredible amount of exploitation that workers suffer in contemporary capitalism. The Economic Policy Institute (EPI) has compiled official government data showing a gaping divergence between two crucial economic indicators: worker productivity (output per worker) and worker compensation (wages and benefits).1 The graph shows that, since around 1973, worker productivity has grown tremendously, increasing by 73.7% between 1973 and 2016. The graph also shows that, in the same time period, hourly worker compensation has been very sluggish, almost stagnant, rising only by 12.3% between 1973 and 2016.
In short, workers are ostensibly producing more and more with their labour (per hour) every year but are not being paid more for it. Without getting into the intricacies and technicalities of normative philosophy, this seems pretty exploitative on the face of it, and a strong vindication of the traditional Marxist charge that capitalism is inherently exploitative.2 As we shall see later, such simple statistics actually belie a much more complex reality, and taking them at face value as indicating exploitation is simply wrong. But, let the point stand for now.
What is less well known, oddly, is that in 1820, when capitalism still only existed in a just few countries, the whole world had been mired in extreme poverty. According to a now infamous graph compiled by Max Roser at Our World in Data, between 84% and 94% of world population could be said to have lived in extreme poverty in the third decade of 19th century.3 But then, during the initial slow introduction of modernity, capitalism, and the industrial revolution in Europe through the 19th century, the global share of those in poverty started dropping. By the end of the century, it had dropped to between 70% and 85%.
With the spread of modern economic institutions throughout the world in the 20th century, extreme poverty was reduced even more significantly, standing at under 10% in the second decade of the 21st century. So, capitalism might be very exploitative, but it does seem to have almost vanquished extreme poverty. If nothing else, does this latter fact not point against capitalism’s critics and in favour of the modern economy?
Not necessarily. Surprisingly, the poverty data might even provide a certain kind of vindication of Marxism — or, to put it more accurately, they are not strong evidence against Marxist theory — as Karl Marx himself declared in his various works that capitalism will not increase absolute misery.4 It was more the relative immiseration — that is, inequality — that Marx worried about in the infamous 25th chapter of his Capital, a point we will get to later on. Contemporary critics of capitalism, however, are not as convinced. Some of them are more in line with the Marx of the Communist Manifesto, where the absolute immiseration thesis is quite clearly on display. The economic anthropologist Jason Hickel, for example, disputes the data and (almost) denies the two-century long reduction in extreme poverty.5 Moreover, he claims that rather than vanquishing it, capitalism (and colonialism) created extreme poverty where there was none before.
But perhaps the clearest economic downside of capitalism today is the seemingly exploding rate of inequality all over the world. Inequality, even more so than poverty or exploitation, is said to be the main issue of the modern economy. Over the past decades, we have been inundated with media reports of extreme wealth possessed by the rich. Today’s top world billionaires, such as Elon Musk, easily pass the $100 billion wealth benchmark.
Contemporary inequality, however, is not only about world’s top billionaires being extraordinarily rich. One Forbes headline from October 2020 reads ‘Top 1% of U.S. households Hold 15 Times More Wealth Than Bottom 50% Com-bined.’6 Relying on the latest data provided by the US Federal Reserve, the article reports that the top 1% of Americans have a combined net worth of almost $35 trillion, while half of all American citizens combined possess less than $2 trillion.7 Of course, inequality is not solely to provenance of the US — although US inequality is among the highest in OECD countries. The world in general is also highly unequal. According to Oxfam, ‘the world’s richest 1% have more than twice as much wealth as 6.9 billion people.’8 Who constitutes this global top 1%? In 2018, it was any individual with a net worth of $871,320 (net worth is the household’s value of stocks and other financial assets and the value of real assets, such as housing, minus any debt).9
Such reports tend to paper over one important fact. The latest data on income inequality show that, between 1980 and 2016, the real income of the world’s bottom half population has grown by 94%, which is quite impressive.10 True, even here significant inequality is still on display. The income of the world’s top 1% grew by 101% in the same period, while that of top 0.001% increased by extraordinary 235%. On the other hand, income growth for the people between the bottom half of the world and the top 10%, 1%, or 0.001%, say the 60th, the
70th, or the 80th world percentile, has been more modest. These percentiles, which represent the European or the American bottom 50% and middle 40% — i.e. the middle and working class of the developed world — grew on average by just 43%. So, some inequalities are increasing, other decreasing — a point I will develop in much more detail later on — but on net, there still seems to be plenty of inequality to go around today.
The purpose of this chapter is to thoroughly investigate both theory and data on the relationship between poverty, exploitation, inequality, and capitalism. As we shall see in each of the following sections on poverty, exploitation, and inequality, respectively, the relationship is much more complex than usually presented in simplistic accounts provided either by defenders or by critics of the modern economy.
In January 2019, just a few days before the start of the 2019 World Economic Forum Annual Meeting in Davos, Bill Gates tweeted a picture containing 6 graphs compiled by Our World in Data (OWID), saying that it was one of his favourite infographics. The graphs depict how the past two centuries have seen a significant increase in basic education, literacy, vaccination, and democracy. They also depict a sharp reduction in child mortality. But what proved to be the most controversial is the graph showing a fall in extreme poverty from 94% in 1820 to 10% in 2015.
Aside from the expected Twitter firestorm that followed that post, the radical economic anthropologist Jason Hickel wrote a column for the Guardian bluntly titled ‘Bill Gates says poverty is decreasing. He couldn’t be more wrong,’ which sparked a global debate that in the end drew in, among others, the OWID director Max Roser and the former World Bank lead researcher Branko Milanovic.11 In the column and various later publications, Hickel presented a suite of ostensibly fundamental issues that, as he claims, falsify virtually any triumphant claim about significant poverty eradication in the past two centuries.12 He is especially critical of a claim which Gates and social scientists such as Steven Pinker are gesturing towards when writing about poverty, namely that the rise of capitalism in the 19th and 20th century is one of the key social-structural reasons for extreme poverty eradication.
The following list captures the most important critical points presented by Hickel and other sceptics:
1 The data on poverty going back in time further than the 1981 mark when the World Bank started collecting the data, are — as he puts it — ‘extremely sketchy’ and even ‘meaningless.’13 This is so because the typical poverty data going back in history beyond 1981 are based on GDP estimates, which ostensibly do not take into account various non-market commodities and sources of wealth people relied on in the pre-capitalist past. Moreover, the
data for many countries are missing and so have to be regionally interpolated, which is too speculative. In short, data for the past unintentionally overstate poverty to such an extent to be of no use.
2 The emergence of capitalism through the 19th and 20th century did not reduce poverty, but rather caused it. Colonization of the Global South and the European enclosure movement in these centuries expropriated former subsistence peasants of their land and robbed them of their access to the commons which they used in the past to survive. Capitalism forced former peasants who previously had no need of money to live in a moneyed economy, thus introducing them to poverty as they were transformed into landless low-wage workers.
3 Apart from the previous points, the poverty measure itself is wrong. Extreme poverty as depicted by the OWID graph is defined as living on less than $1.9 a day, but that bar is much too low. If a person earned less than $2 in the past and then started earning more, that does not mean she escaped extreme poverty. Moreover, a single poverty line for the whole world across two centuries, even corrected for differences in purchasing power, is much too blunt of an instrument.
4 The proper extreme poverty baseline should be much higher, say around $5 a day or $7.4 a day, or even higher. And when we use this bar to measure poverty, we are presented with a much less impressive drop in poverty.
5 Moreover, it is not that the world as a whole has seen a sharp reduction in poverty. It was mostly China that accounted for the bulk of poverty reduction.
6 But China is not a typical capitalist economy, or one embodying the neoliberal Washington consensus. So, Chinese poverty reduction cannot be used for the capitalist triumphalism narrative.
The first point from the list is incorrect, or at least significantly misleading. It is not the case that the 19th-century extreme poverty rate as proxied by GDP measurements leaves out non-market sources of wealth, thus vastly overstating poverty.14 It is true that most people two centuries ago and in the past were peasants endowed with customary plots of land, who engaged in subsistence production of grain and other foodstuffs on their plots of land, had access to the commons, and so on. But economic historians responsible for past GDP reconstructions use a variety of methods to correct for the fact that in the pre-capitalist past people held a significant amount of their wealth and income in non-commodity forms. Historians measure these sources of wealth and consumption by, for example, estimating the amount of arable (and other) land in use, average crop yields, livestock numbers, even when these had nothing to do with markets or money.15 These material estimates then get converted into monetary figures, and from those GDP estimates are constructed. A lot of work goes into making sure precapitalist GDP figures expressed in money reflect non-monetary, material wealth of pre-capitalist populations, which means that past poverty estimates that are based on GDP also do not simply ignore non-market wealth.
It is true that data on global poverty in the 19th century are indirect and so less reliable compared to the direct data that exist for the 20th century, especially after 1950. It is also correct that poverty measures for world regions as a whole have to be interpolated, i.e. the various individual countries for which data exist are used to create an estimate of overall poverty within a region. However, this does not mean that only a few countries, or only Western countries, are used to make the imputation, as critics falsely intimate. In 2021, for instance, Michail Moatsos presented data on extreme poverty for the OECD within a new approach — Robert Allen’s ‘cost of basic needs’ approach, which tracks the share of world population that was not able to meet basic needs (i.e. minimal adequate nutrition and heated shelter) in particular historical timeframes.16 According to this measure, the picture of extreme poverty in the 19th century that emerges is almost the same as the one produced by standard GDP estimates. In 1820, 76% of the world was not able to eat enough or have adequate shelter.17 The percentage dropped to 74% in 1850, to 59% in 1900, 53% in 1950, 28% in 2000, and it now stands at 10% in 2018.18 Crucially, even for the (early) 19th-century regional imputations, Moatsos uses data from more than 40 countries across the world.19
A central part of the second point from the list is undoubtedly correct. Subsistence peasants in Europe and abroad were expropriated and their access to the commons was restricted in the process of either colonization or the emergence of capitalism. However, to take capitalism first, the material living standards of former subsistence peasants — now landless workers — then rose dramatically as capitalism emerged and developed further. Almost all subsistence peasants lived in extreme poverty in pre-capitalist societies in 1820. Then, as we have just seen, the proportion steadily (although slowly) started dropping during the 19th century. It was reduced even more significantly in the 20th century, especially its second half, so that today only a small fraction of the world population lives in extreme poverty. It is not that, as Hickel presents it, most people in the past lived materially comfortable lives, never coming close to extreme poverty, and then with the creation of capitalism most of them were suddenly pushed into starvation.
To the contrary, Moatsos’ ‘cost of basic needs’ estimates of extreme poverty demonstrate how the quickest and most significant reduction tended to happen in those countries that were most exposed to capitalist industrialization early: Great Britain, Germany, Australia, Canada, and the US. By 1900, extreme poverty in these countries had dropped from around 70% or more (in 1820) to less than a third of the population (in Australia and the US, it was even less than 10%).20
Turning now to colonization, it is completely true that this was an unimaginably violent and immoral practice, one that bequeathed serious, structural impoverishment to the colonized.21 It is also undeniable, as Hickel intimates, that colonization is a historical part of modernity and that many states with a capitalist economy engaged in it. However, Hickel and critics err when suggesting this practice has a special, distinctive connection to modernity and capitalism. In fact, colonization was a constant in recorded human history. Moreover, according to contemporary Marxist historical sociology influenced by the work of Robert Brenner, political accumulation and territorial aggrandizement are, if anything, the sine qua non of pre-capitalist modes of production, which were unable to economically grow in a sustained fashion through continuous productivity increases.22 In short, it is unclear why Hickel points to colonization to dispute the statistics on extreme poverty reduction or the claim capitalism and industrialization helped reduce extreme poverty.
It is not correct, as the third point on the list claims, that the standard extreme poverty measure (living with less than a $1.9 a day) tells us nothing important about people’s lives, or that when a person moves beyond the threshold they are virtually just as badly off as they were before. This is so for two reasons.
First, the standard measure of extreme poverty strongly tracks Allen’s new ‘cost of basic needs’ measure, so it clearly is not arbitrary but adequately reflects the bare minimum people need to survive. There is no issue here either of ‘dollar arbitrariness’ because the measure does not rely on a monetary threshold, nor is there any issue of creating a single, homogenizing poverty line for all countries and all time. As Moatsos say,
The goal of this chapter is to provide global, regional and country estimates of a specific measure of extreme poverty for (almost) all present-day countries of the world as if they were sovereign in 1820. ... In this approach, poverty lines are calculated for every year and country separately, rather than using a single global line.23
Second, if a person lives under the standard extreme poverty threshold and then just barely moves beyond it, her life is indeed undoubtedly still very miserable, and one should not tout this as incredible progress. However, now she is at least able to survive when before she was barley doing that (or not at all). That is at least the necessary first step on the way to progress.
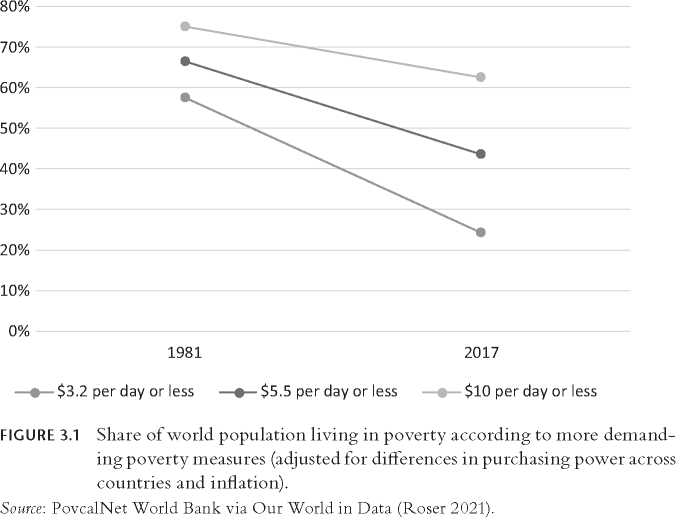
Hickel and the other critics are wrong that the $1.9 a day threshold is arbitrary or irrelevant for assessing improvement in people’s ability to satisfy their most basic survival needs. Nevertheless, they are correct that other thresholds, say $5 a day, exist and that they sensibly posit much higher thresholds which, if they are reached, suggest much more meaningful progress.24 Unfortunately, there is no longitudinal historical data for these higher thresholds. But the data that exist are clear. As Figure 3.1 shows, all measures of absolute poverty from the lowest to the highest show a steady, although admittedly less significant and slower, decline.25 In 1981, 57.39% of the world population lived on less than $3.2 a day. That share has declined to 24.25% in 2017. For $5.5, the drop has been from 66.54% (in 1981) to 43.53% (in 2017). In 1981, 75.06% of the world lived on less than $10, while in 2017 the share has decreased to 62.35%.
The fifth point claims that China singlehandedly drove virtually all of the poverty reduction in previous decades. The suggestion is that global poverty was not really reduced. Instead, it was (almost) all concentrated in a single country.
Now, it is true that China, since it started introducing market reforms and since it has liberalized, was responsible for a large part of poverty reduction since the 1980s. When we exclude China, global extreme poverty has fallen from 29% in 1981 to 18% in 2008.26 If we include China, the reduction was from 42.2% in 1981 to 18.1% in 2008.27 After 2008, the two rates overlap each other virtually completely. So, China was a very important, albeit far from the only, contributor to world poverty reduction until 2008. This fact should not be surprising (or presented in a dismissive tone in discussions of global poverty reduction) since China after all accounts for a fifth of humanity. Be that as it may, it is simply not true that the last decades of poverty reduction have essentially been solely due to China’s economic growth. After 2008, China contributed nothing to world extreme poverty reduction, while in the decades before that around half of the reduction was due to countries other than China.
In fact, all regions of the world (save for one) have been on a clear and continuous downward extreme poverty trend since the last decades of the 20th century.28 Between 1990 and 2019, extreme poverty in Latin America and the Caribbean has fallen from 15.2% to 3.7%.29 In South Asia, poverty has been reduced from just under 50% in 1990 to 15.2% in 2014. In West Africa, the figures are 56.5% (in 1990) and 34.5% (in 2019). In Sub-Saharan Africa, the share in poverty was 55.1% in 1990, while it stood at 40.4% in 2018. In East Africa, the reduction has been modest, but still palpable: around 60% of the population lived in extreme poverty in the early 1990s, and 43.7% lived in poverty in 2018. The fall was most impressive in East Asia and the Pacific: in 1990, 60.9% were mired in poverty,
while in 2019, 1% struggle to survive. Only in the Middle East and North Africa is the trend more complicated. In 1990, poverty stood at 6.5%. It then increased in the following year to 10.2% and then started falling steadily from a high of 10.2% to a low of 2.1% in 2013. Then, it started increasing again so that in 2018 it was at 7%. The same downward trends for world regions appear if we use higher measures of absolute poverty, such as $3.2 or $5.5.
Taking up the last point from the list, Hickel is clearly correct that the Chinese economy is not a free-market capitalist economy based on the strict adherence to the policies and institutions recommended by the Washington consensus.30 However, he brushes over an important fact. Namely, that China’s miraculous growth and poverty reduction has only happened since it started dismantling collectivised farming, protectionism, and state-planned pricing, and replacing them with market mechanisms, private property, and the private sector.31 China definitely demonstrates that hundreds of millions of people can be lifted out of extreme poverty without neoliberal shock therapy or wholesale dismantling of the state. In short, it shows that capitalism with strong statist features has no problem of dealing with extreme poverty. But China of the past few decades is still clearly a capitalist society. Between 1980 and 2018, its economic freedom score has increased from a low of 3.91 to a more respectable, if still below-average, 6.21.32 Significant gains were made in all five areas tracked by the Fraser Institute’s Economic Freedom Index, i.e. government, property rights, sound money, international trade restrictions, and regulation, with the biggest gains registered in trade restrictions and regulation area.33
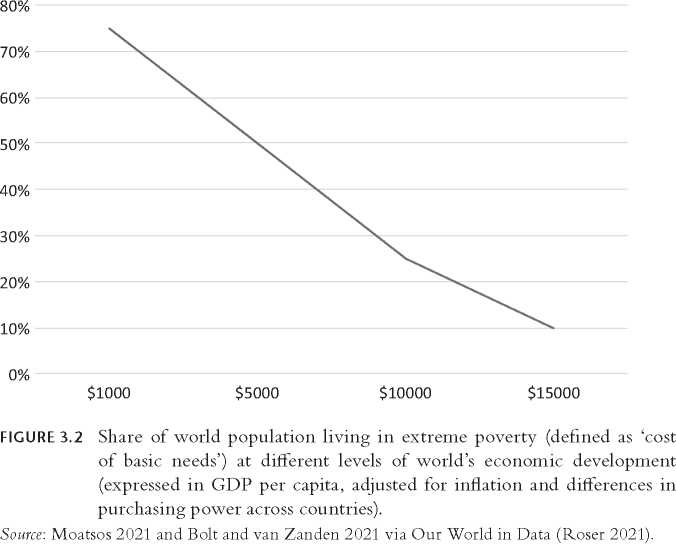
It is not just the general timing of the transition to capitalism and extreme poverty reduction that suggests the former had something to do with the latter. The data show a clear and strong correlation between increases in wealth of a society (GDP per capita), for which capitalism is primarily responsible, and poverty reduction. The global average of extreme poverty has steadily declined as GDP per capita increased: see Figure 3.2.34 As the world moved from a GDP of just over $1.000 (in 1820) to $5.000, extreme poverty (as measured by the ‘cost of basic needs’ approach) had dropped from around 75% to less than 50%. It then fell to 25% as the world moved to a GDP per capita of $10.000. As it passed the $15.000 mark between 2010 and 2017, the share of poverty declined further to 10%.
The same pattern holds for every region of the world, including Sub-Saharan Africa, although the GDP thresholds are somewhat different for each region as there are various endogenous and exogenous reasons — reasons having to do with the speed of development (i.e. early versus late developers), geopolitics and war, foreign aid, the timing of economic crises, and so on — for why poverty is reduced earlier or later.35 In Sub-Saharan Africa, for example, extreme poverty was almost 90% in 1820. As the region moved to a GDP per capita of $2.000, the share fell to 50%. It now approaches $5.000, and the share is 37% (as of 2017). The correlation
coefficient between GDP growth and share in extreme poverty for the almost 200-year period between early 19th and early 21st century is, on a typical year, stronger than -0.5 (the average for the whole period is -0.59), which means that, statistically speaking, sheer economic growth explains a substantial part of poverty reduction.36
Apart from this longitudinal perspective, it is also clear that today societies with greater overall economic freedom (one measure of how capitalist a society is) enjoy the lowest poverty rates in the world. If we group them under four quartiles, we can see that the various poverty rates in first quartile (where economic freedom is highest) were 1.7% (living with less than $1.9 a day), 4.37% (less than $3.2 a day), and 9.84% (less than $5.5 a day) between 2000 and 2018.37 Even just moving to the second quartile, holding inflation and purchasing power constant, the population shares for the various poverty thresholds were much higher: 9.4%, 19.02%, and 33.59%, respectively. They were higher still in the third quartile and even higher in the fourth quartile. Moreover, in 2018, the absolute level of income earned by poorest 10% of population in most economically free societies was significantly higher than in societies of the second, third, or fourth quartile. On average, the bottom decile in countries classified as belonging to the first quartile by economic freedom received more than $12.000 a year, compared to almost $5.000 a year received by the bottom decile in the countries of the second quartile, slightly over $2.500 in the third, and slightly over $1.500 in the fourth.
These measurements, again, control for inflation and differences in purchasing power across countries.
All of this is very suggestive of capitalism and economic development in general having something important to do with poverty reduction. However, we must be careful not to hastily conclude that the capitalist market, and especially free markets without a welfare state, are the solution to global poverty everywhere and for all times. Modern markets are, undoubtedly, the chief source of wealth creation and, therefore, have to be implicated in how much the typical person’s material standards have increased over the past two centuries. In fact, in an extremely poor and economically undeveloped society, simply successfully unleashing economic growth through market reforms typically does wonders for the material well-being of the poor. However, especially if we are concerned about the fate of poor people in advanced, developed societies, sheer economic growth is usually not enough for their livelihoods to keep improving. Of course, markets in advanced capitalist societies remain the main mechanism of wealth creation, but they are no longer a robust mechanism of improving poor people’s lives. When it comes to distribution of the wealth generated by the market, the modern welfare states play an important role.
Lane Kenworthy has shown that as the advanced economies’ GDP per capita increased between 1979 and 2007, incomes of the poorest (the lowest decile) have also notably risen in the majority of cases (11 out of 17).38 ‘Growth is good for the poor,’ says Kenworthy.39 However, if we look at the specific source of the poor’s income growth, we see that in the majority of these cases (though not all) it was not their earnings and other market income that were mainly responsible for their improvement.40 Primarily, it was net government transfers. In countries like the Netherlands and Switzerland, earnings were also rising, but this is not the typical case. Moreover, there are a few countries, such as the US, Germany, Australia, and Canada, where the poor saw little or no growth either of their earnings or government transfers. In these atypical cases, GDP per capita increased, but the average income of the bottom decile remained more or less stagnant.
Growth is still good for the poor — even in the advanced capitalist societies. Without growth, the amount of government transfers would not have increased in the majority of advanced countries in Kenworthy’s sample. ‘Where net government transfers increased, this was underwritten by economic growth. None of these countries significantly raised the share of GDP going to transfers during this period.’ But growth is good for the poorest of the poor in these advanced societies primarily ‘if social policy passes it on.’41 It was not the market alone that helped the bottom 10% in these countries. It was the market in conjunction with a generous welfare state. As Kenworthy notes, this conclusion should not be surprising as many in the bottom decile are simply unable to work and so cannot afford to live off the market:
For this bottom 10 percent there are limits to what employment can achieve.
In all of these countries, 5 percent or more of working-age households have no employed adult. Some people have psychological, cognitive, or physical condition that limit their earnings capability. Others are constrained by family circumstances. At any given point in time some will be out of work due to structural or cyclical unemployment. And in all rich countries a large and growing number of households are headed by retirees.42
In conclusion, capitalism does not create absolute immiseration, as at least some contemporary critics of capitalism such as Hickel still intimate. In fact, absolute immiseration was, and still is, impressively reduced with the transition to the modern economy.
But, if not immiserated, are workers under capitalism nevertheless exploited? Are the fruits of their labour taken from them without appropriate remuneration? For Marx and the Marxists, the answer is obvious and clearly affirmative. In the past, still relying on the discredited labour theory of value, the argument was simple. Labour-power is the source of all value, and given that capitalists — who themselves do not work (or work only a little) — capture a large fraction of the generated value in the form of profits at the end of the production-sales cycle, it follows that at least some amount of value created by workers must have been appropriated without pay by capitalists.43 What the capitalist pays a worker in return for the worker performing labour for him — the wage — cannot be fully commensurate with the value the worker created for the capitalist in the production process. Hence, the worker is necessarily exploited under capitalism.
The fact that the central premise above — and a crucial part of the labour theory of value — namely that labour-power is the source of all value has been thoroughly discredited since the Marginalist Revolution in the late 19th century does not really undermine contemporary Marxists’ charge of capitalist exploitation. Without reliance on the old theory, contemporary Marxists such as Wright and Chibber make the following case.44 Capitalists want to keep their production costs as low as possible so as to maximize the amount of profit they generate for themselves by selling products on the market above production costs. Now, labour is one key production cost for capitalists. They have to pay wages to workers; otherwise, the latter do not show up for work. So, capitalists will among other things strive to pay their workers as little as possible, i.e. just enough for the workers to show up, while also extracting the highest amount possible of work-effort from them so that workers produce as much as possible for a given amount of payment. ‘This, roughly, is,’ says Wright, ‘what is meant by “exploitation”.’45
He does not make this explicit, but I suspect the following is the reason for calling the situation ‘exploitative’ (which is a normative charge usually relating to unjustly unequal exchange). The reason is that there is a general expectation that in many cases the above dynamic will lead to workers being paid less than what their actual contribution to the firm was (or would have been) worth if capitalists were not able to drive down the wages so low. And they are able to drive them down because market conditions are not a levelled playing field. Here, Chibber is more explicit — although, interestingly, he does not mention the word exploitation. A capitalist can make the worker work for a low wage that strikes us as unfair in some way (or exploitative, non-reciprocal, etc.) because the power relation between the two is unequal. The capitalist ‘has the power to hire and fire — and the worker is rarely in a position to afford losing her job.’46 The worker works at the mercy of the employer (this is the asymmetric power point), which usually means that the latter will be able to extract more from the former than would be just and commensurate under more symmetric bargaining conditions (this is the exploitation charge).
For a long time, mainstream, neoclassical economics was perceived to strongly disagree with this Marxist analysis and its conclusions. More to the point, basic introductory economics is seen by many as providing an unambiguous, law-like apologetic explanation for why capitalism is simply incompatible with exploitation. This is so because the ‘perfect competition’ introductory model ineluctably proves that capitalist competition will eliminate any existing exploitation. In a perfectly competitive labour market — where movement from job to job is frictionless, all actors are price-takers and are completely rational and informed — workers receive a wage identical to their productivity, or the amount of value they contribute to the firm. In more technical terms, in the model the wage is equal to the ‘marginal product’ created by the worker (i.e. the added benefit the firm received by employing one more worker).47
Why should that be? Intuitively, the mechanism that ensures this theoretically pans out in the model looks as follows. If worker A is capable (due to her own human capital and due to the existing level of technological sophistication in an industry) of creating $10 worth of value, but her current employer X is only willing to employ her at a $5 wage (exploiting the employee at a rate of 100%), other employers who are also in need of an extra worker are now presented with a lucrative profit opportunity. If they manage to lure the worker away from employer A to instead work for them, they will be able to exploit her and reap similar additional profits just like the first exploitative employer is currently doing. For example, employer Y should be willing to offer the worker a higher wage, say $6, so as to motivate her to switch employment from X to Y. If employer Y is successful in luring the worker away from X, employer Y now has an additional worker (worker A) who creates $4 extra benefit for Y ($10-$6). This is less than the $5 the first employer was able to extract but still clearly profitable and thus beneficial for Y. However, observe what has happened to the level of exploitation experienced by the worker. It went down. Her wage has increased (from $5 to $6) and the unpaid value extracted from her has been reduced.
Now imagine what the incentive for the next employer Z is. Employer Z is now motivated to lure the worker away from Y by offering her an even bigger wage, say $7, to gain a net benefit of $3 (which is a smaller amount than before but definitely better than the $0 of additional profits Z is currently enjoying). The exploitation experienced by the worker is decreasing with each offer. And, according to the perfect competition model, it should decrease further still as other employer have an incentive to bid up the wage of worker A right up until the point where they cannot capture any additional benefit from having her employed — i.e. up to the worker’s productivity or marginal product ($10). Thus, one should expect perfectly competitive capitalist markets not only to not increase exploitation and keep it high (as per the Marxist critique) but actually decrease it and even completely eliminate it.
Capitalism’s critics might accept this theoretical account as suggestive or even internally coherent, but they would also (correctly) point out that conditions stipulated by the perfect competition model simply do not obtain in the real world. Markets are not perfectly competitive. This is so because economic actors are not simply price-takers, and they are not wholly rational and informed.
For example, in the real world, there might exist market concentration which can give firms price-setting power as Wright and Chibber gestured above. In such conditions, employees do not have an easy time exiting the current firm and getting (better) employment elsewhere because there simply are not that many competitors to which they could turn. Moreover, even when market concentration is not a problem and there are lots of alternative options, workers simply do not have all the information about which particular employers exist and are looking for additional workers, or how high the wages they are willing to offer are. After all, becoming informed about one’s choices is costly in terms of time and energy expended, so workers might remain imperfectly informed even for rational reasons. So, being imperfectly informed, they might overlook beneficial employment offers, and then the whole bidding-up logic outlined in the previous paragraph gets short-circuited. As a result, exploitation persists in the market and does not get eliminated. Lastly, workers might intentionally tolerate some exploitation at their current employer if they have developed certain emotional attachments to the firm, such as deep friendships with colleagues, and so on. This is one more reason why wages are not guaranteed to equal workers’ marginal product in capitalism. In sum, there are many real-world conditions, such as the existence of market concentration or market power and search costs/ frictions, that make the logic and conclusions of the perfect competition model inapplicable outside the textbook.
Now, is this enough to (1) indict economics? Is it enough to (2) conclude the Marxists are correct? Does it (3) corroborate their reliance on the simple EPI graph to empirically demonstrate (rising) exploitation? One must tread lightly here.
First, the perfect competition model is only one economics model, not the only one. In fact, the same students who started out with perfect competition in their first year of college quickly learn of a different model which turns out to be more applicable in the real world. That is the ‘monopsony’ or ‘monopsonistic competition’ model. The model assumes stifled competition or search frictions, and it elegantly demonstrates how under such imperfectly competitive conditions wages will not equal workers’ marginal product. In a word, it demonstrates exploitation. (At least if we take exploitation to be, roughly, the discrepancy between the benefit a worker added to the firm and the pay he got in return for that benefit).
Contrary to a pervasive myth, mainstream economics is not — especially not today — apologetic of capitalism. In fact, it provides the very basis upon which a powerful theoretical account of the various shortcomings of the capitalist economy as it exists right now can be launched. As the former Marxist economist Herbert Gintis observed, ‘Most of my radical economist friends [argued] ... that standard economic theory is simply an apology for free market capitalism ... The truth is quite the opposite. . Standard economic theory provides the proper framework for analysing market failure.’48 It is true, of course, that economics provides reasons to be sceptical not only of markets (due to market failure) but also of state intervention (due to government failure). Nevertheless, a judicious reading of economics and economics textbooks does not easily lend itself to unqualified free-market dogma as charged by critics.49
Second, Marxists are correct that exploitation persists in capitalism, but they miss or underemphasize two important points. First, capitalism — as opposed to pre-capitalist and socialist societies — has a built-in market mechanism, i.e. competition, that tends to tone down exploitation to a certain extent even under fairly general conditions. It does not completely eliminate it, but it does reduce it. Second, Marxists seemingly miss the fact that exploitation is not a binary but a spectrum. One is not simply exploited or not exploited. Workers are exploited to a higher or lower degree. And, as already intimated, one would expect even imperfect market competition to put most workers on the lower end of the spectrum.
Indeed, currently existing empirical measures of exploitation suggest workers are paid about 20% less than what their marginal product is (lower estimates put the share at 15%, higher estimates at 25%).50 This is important and a rather strong vindication of the Marxist exploitation charge against capitalism. But it also flies in the face of various Marxist gestures that exploitation is either extremely high (that would probably mean that it exceeds 40%, 50%, or 60%) or that it is inherently rising under capitalism.
Third, the use of the EPI graph to claim enormous exploitation belies a much more complex reality. There are many issues here. For example, the size of the gap between productivity and pay changes significantly depending on the different price deflator one uses. More fundamentally, the gap cannot be solely — or even primarily — attributed to employers exploiting workers. There is robust evidence that sluggish growth of the median wage after 1973 is in large part a function of skill-biased technological change, which has nothing to do with worker exploitation.51 In contrast to workers at the median or lower down, workers with above-average education who are employed in sectors where computing and communications technology figures heavily have seen their wages rise significantly in the past decades. The wages (real weekly earnings, which are not even the whole compensation received by workers from employers) of male workers with a Bachelor’s degree have increased by 40% between 1964 and 2012.52 Those with education higher than an undergraduate degree have seen their wages grow by more than 90% in the same period.53
This is because, in recent decades, technological innovation which raises labour productivity has significantly affected primarily the more skilled jobs, but not the jobs in other sectors that require less skill. Janitors or store clerks, for example, have seen their wages stagnate not necessarily because of increasing exploitation (i.e. their marginal product ostensibly increasing but their wages not tracking that increase) but rather because they have simply not become much more productive over the decades. They perform tasks which have not been made significantly more productive by new technology, so their marginal product remains relatively small. The EPI graph thus hides the heterogeneity of productivity (and wage) growth across different sectors. In reality, some workers have become much more productive and their wages roughly tracked the increase, while other workers are just as productive today as they were in the seventies and their (stagnant) wages are tracking that fact.
Technological change also had other effects that can help explain why, for some workers, wages have been sluggish, stagnant, or even falling. For instance, some jobs have been wholly automated away due to technical innovation, which means that the demand for a certain worker and his skill set has plummeted, stifling wage growth or putting it in reverse for that subset of the workforce.
Next, the booming of global trade since 1980s is another factor apart from technological change (or domestic exploitation of workers) that has negatively affected a section of Western workers with lower education. Outsourcing and cheap imports from China and elsewhere have destroyed certain jobs in the US, forcing workers to try their hand at retraining and finding employment else-where.54 Some of them struggled to do that and got hired primarily in sectors with much lower wages than their previous manufacturing job offered. So, as the output of goods per worker (i.e. productivity) increased in general in the previous decades, wages of particular groups of workers did not reflect that change simply because these workers were not tied to productivity growth. Exploitation is a separate issue that is orthogonal to all of that.
Of course, as I have already pointed out and as will be discussed in more detail below, workers are exploited in capitalism and that is one of the reasons for the divergence between productivity and pay. But it is not the only or the primary reason. After all, if we took the graph as direct evidence of exploitation, then we would have to say that there was no worker exploitation in American capitalism between 1948 and 1973 when the graph shows no divergence between productivity (it rose by 96.7%) and compensation (it rose by 91.3%).55 That seems unlikely and definitely not something Marxists would take kindly to.
We have seen, theoretically, why and how imperfectly competitive markets engender a degree of exploitation. I have also pointed to two recent empirical studies estimating the extent of exploitation in real-world, imperfect capitalism. Defenders of capitalism are usually not really convinced by the outlined critique. For example, in her recent book Private Government, the philosopher Elizabeth Anderson presented an insightful critique of capitalist firms along similar lines. The economist Tyler Cowen wrote a critical, if also generally appreciative, response. In it, he focused specifically on her charge of monopsony exploitation. This is his rebuttal:
Many corporate critics, including Anderson at the tail end of her piece, postulate the existence of ‘monopsony’ — namely, that a single company has a good deal of market power of the workers it employs. I am worried she, like others, doesn’t offer much evidence to back up her portrait, save for one footnote to an adequate but not very influential book. In contrast to her treatment, the best study I know finds that Walmart — the largest private sector employer in America — does not have significant monopsony power in most regions, some parts of the rural south and center excepted.56
In what follows, I respond to Cowen’s scepticism by presenting both indirect and direct evidence of at least a moderate amount of monopsony in particular and imperfect competition more generally in the US economy.
Turning first to indirect evidence, the recent explosion of rigorous minimum wage research shows quite conclusively that at least a modestly high minimum wage — and modest minimum wage increases — typically does not have significant dis-employment effects. For example, 23 studies published between 2000 and 2013, which contain hundreds of quantitative estimates, reveal two important insights.57
First, that on several occasions increases in the minimum wage result either in significantly higher unemployment or significantly lower unemployment. Contrary to expectations that the minimum wage always increases wages above workers’ marginal product and that it should, therefore, always result in employers laying off overpaid workers, it actually motivates additional employment in several cases. As I explain below, this is exactly what we would expect if at least certain markets are not perfectly competitive.
Second, the studies reveal that the single most common effect of a moderate minimum wage increase on employment is almost zero — more precisely, it is slightly negative (-0.03). This number denotes elasticity, and it means that a 25% increase of the minimum wage increases unemployment by only 0.75%. This is, again, a somewhat (though not completely) unexpected result if markets are thought of as perfectly competitive. But it is a matter of course if competition in the real world is less than perfect.
Other literature reviews reveal a slightly more negative but still quite mixed and, in general, unexpected picture.58 Two conclusions are usually made. First, that unless the minimum wage is increased to above around 60% of the median wage in a country, then dis-employment effects are modest and lower than what the perfect competition model would predict. Second, that significant heterogeneity in the effects of the minimum wage on employment obtains in different locations — strongly negative, modestly negative, neutral, and even positive. What can we draw from all of this?
Let us first walk through the standard economic argument for why an even modestly high minimum wage should negatively affect employment.
If the labour market is perfectly competitive, such that workers are paid exactly the amount of their marginal product, a high minimum wage stipulating that employers pay their workers in excess of their marginal contribution to the firm will cause employers to start losing money. Employers will realize that under these new conditions some of their least productive workers contribute, say, only $5 worth of value an hour while costing them, the employers, $7 an hour (stipulated by the increased minimum wage). In other words, they will realize that they should let some workers go. After all, minimum-wage laws do not require employers to keep the currently employed workers. Therefore, some low-productivity workers will be fired, and employers will try to compensate the loss of labour by either hiring a more productive worker instead (one whose marginal product is not below the minimum wage) or by automating production (seeing as how machines are not affected by minimum-wage laws). Neither of these two options is good for the employment rate of low-productivity workers who would much rather be employed for $5 an hour without minimum-wage laws than not be employed at all (with $7 minimum-wage laws in place).
This is the standard argument against the minimum wage, and it seems quite convincing (and normatively pro-labour) in the context of perfectly competitive markets. But what if we drop the unrealistic assumption? What if workers are not paid their marginal product on the labour market? What if we look at the effects of minimum wage through the monopsony model? In this case, and if the minimum wage is not too high, employers will not likely be motivated to fire their workers. This is so because, if the marginal product of a worker (say, $5 an hour) had already been higher than what he was paid (say, $3.5 an hour) before the minimum wage was introduced or raised, then a modest increase of the latter (say, to $4.5 or $5 an hour) should not exceed his marginal product. In this case, the employer will have no incentive to fire the worker. Moreover, not only will employers not have an incentive to fire workers, instead certain previously unemployed workers might now, with the introduction of a minimum wage which pushes wages in line with workers’ marginal product, be willing to seek employment. Under imperfect competition, a minimum wage increase does not necessarily increase unemployment but can, in fact, even lower it.
In this sense, contemporary minimum-wage research by itself indirectly suggests that many markets are quite imperfectly competitive and monopsonistic, which, in turn, means that a certain degree of exploitation is quite possible and, indeed, likely. That the former actually holds and is not just idle speculation is attested to by a recent study by Azar and colleagues.59 As they put it:
While increases in the minimum wage are found to significantly decrease employment of workers in low concentration markets, minimum wage-induced employment changes become less negative as labor concentration increases, and are even estimated to be positive in the most highly concentrated markets. Our findings provide direct empirical evidence supporting the monopsony model as an explanation for the near-zero minimum wage employment effect documented in prior work.
There is also plenty of other direct evidence, not having to do with the minimum wage, for either monopsony in particular or imperfect competition more generally in the US economy. One of the most systematic inquiries into the phenomenon I know of is a recent meta-analysis that looked at estimates of labour supply elasticities provided by 53 existing studies.60 The main finding of the meta-analysis is that the current empirical literature ‘provides strong evidence for monopsonistic competition,’ which ‘implies sizable markdowns in wages.’61
In 2016, the Council of Economic Advisers (CEA) issued a brief in which they warned of declining competition in the US. The CEA brief points to three key pieces of evidence for this: ‘1) increasing concentration across a number of industries, 2) increasing rents, in the form of higher returns on invested capital, across a number of firms, and 3) decreasing business and labor dynamism.’62 Both market and government failures can be pointed to as the principal sources of this unappealing decline in the competitiveness of the US economy.
Unpacking (1), the CEA brief reviews studies which reveal that revenue shares of the largest firms in various sectors (and loan market shares of top banks) have been steadily increasing in the past decades, roughly between 1980 and 2010. This is a pretty good indication that market concentration has been rising at the end of the 20th century.
Demonstrating (2), the CEA brief points to how ‘the 90th percentile firm sees returns on investments in capital that are more than five times the median. This ratio was closer to two just a quarter of a century ago.’63 This means that top firms in multiple industries are receiving very large (and rapidly increasing) rents. Market competition, it seems, is not healthily eroding above-average profits — perhaps because market competition is actually declining.
Lastly, (3) the CEA brief demonstrates that the annual rate of new firm openings has been steadily falling between 1977 and 2013, while firm closures have remained the same.64 Likewise, the churn of workers — ‘the frequency of changes in who is working for whom in the labor market’ — has also declined in the same timeframe. Such increased market concentration and decreased dynamism are by themselves suggestive of stifled competition. And, indeed, other studies explicitly link rising labour market concentration with declining wages and increased market power.65
Similar to the CEA brief, German Gutierrez and Thomas Philippon report two broad recent findings about the US corporate sector that they present as ‘important stylized facts.’66 First, ‘there has been a broad decrease in turnover and a broad increase in concentration across most US industries.’67 In short, competition is weak. Second, ‘corporate investment has been unexpectedly weak in recent years ... the cumulative under-investment is more than 10% of capital.’68 In short, investment has also been weak, at least relative to Tobin’s Q, which is a ratio of the market value of a company to its assets’ replacement cost. What is most important for my case here is that Gutierrez and Philippon provide evidence in their paper that the first fact — decreasing competition and increasing market concentration — is what helps account for the latter.
In another working paper, Jan de Loecker and Jan Eeckhout provide wide-ranging data that show increasing market power (proxied by rising markups, the ratio of a product’s price to its costs of production) across the world between 1980 and 2016, but mostly in North America and Europe.69 They suggest this could account for the decrease in labour’s share of revenue in the past decades.
There are other recent studies that also point to surprising developments in the US economy, such as Stansbury’s and Summers’ latest contribution.70 Chief among them, again, is that Tobin’s Q has risen since the 1980s (as have corporate profits), while — unexpectedly — investment is weak. Stansbury’s and Summer’s preferred explanation is more centred on ‘declining worker power’ as a result of a decline in unions or increase in corporate management ruthlessness than on the standard monopoly/monopsony power argument proffered by sources cited in previous paragraphs. However, all these different explanations can be complementary and all point firmly toward imperfect competition, market power, and (consequently) worker exploitation.
We can clearly see that neither mainstream economists and their empirical research, nor neoclassical economic theory, are apologetic of contemporary capitalism. Exploitation is a reality in capitalism as it was, although to a much more significant extent, in pre- or non-capitalist societies. One does not need to rely on old discredited economic theories and dubious ideological claims to demonstrate or acknowledge this fact.
In the first section of the present chapter we have seen that, historically, capitalism simply cannot be indicted on the count of absolute poverty. Robust, competitive markets and secure property rights alone are enough to bring people out of extreme forms of poverty. Absolute poverty in advanced capitalist societies presents a more mixed picture, but still one in which capitalist markets play a significant and positive role. While economic growth does significantly increase material standards of the whole population compared to what came before, it does so primarily in the beginning (and unequally, of course). At later, post-industrial stages, market incomes for some (either the bottom 10% or a more expansive group of low-income earners) can be and are increasing only slowly, stagnate, or even decline somewhat in different time periods and countries. This can be significantly offset by countervailing non-market forces such as the welfare state. These tap into the enormous amounts of wealth created by markets and redistribute them more equitably.
The status of exploitation under capitalism is more mixed. Current (and realistically achievable) markets evince some amount of exploitation due to various factors that should be expected to either persist under realistic conditions or be only somewhat reduced, never perfectly eliminated. Market competition, which should in theory destroy exploitation, is imperfect. Both government meddling, embodied in bad regulations generated by rent-seeking and regulatory capture, and standard market failures are responsible for this imperfect state of affairs. However, this was much worse in past history when market competition and secure property right were much more absent than they are today. Moreover, it is virtually inconceivable that exploitation could be wholly eliminated under any system, either various forms of capitalism or (future) non-capitalist societies, unless we assume perfectly altruistic and informed agents. The question then becomes to what extent can exploitation be eliminated under different conditions. And one crucial condition is exactly market competition. Currently, it is in part due to not enough competition — i.e. due to market concentration — that exploitation persists.
At first blush, then, inequalities seem to be a starker and much more obvious problem in capitalist societies than either poverty or exploitation. No sophisticated analysis is required to recognize the existence of inequality and its rise in the past decades. In the US, the share of society’s total income going to the top 1% of earners has increased from a low of 11—12% in the 1970s to around 20% in the 21st cen-tury.71 The Gini index of market income, where 0 means total equality and 1 total inequality, rose from an already high 0.43 in 1979 to 0.53 in 2013.72 (This measure excludes the effects of redistributive policies. The Gini index of disposable income is significantly lower and rose to a lesser degree, indicating again how the welfare state can offset market-generated inequalities and even tone down their rate of increase. Disposable income Gini was 0.31 in 1979 and 0.38 in 2013.) Taking a broader perspective, between 1985 and 2008, income inequality has increased not only in the US but in many — though not all — OECD countries.73
This, however, is not the only or the most important development. Wealth inequality is (and was) even higher than income inequality, and it is also on the rise in recent decades. According to Thomas Piketty, the share of total wealth going to the top 1% in the US was slightly lower than 30% in 1970, while in 2010 it was already approaching 35%.74 The Gini index of wealth inequality in the US in 1950 stood at 79 (on a scale from 0 to 100) and then increased to 88 in 2010.75 Europe is more egalitarian. The share of total wealth going to the top 1% was 20% in 1970 and 25% in 2010.76 European wealth Gini is also more egalitarian in comparison to that of the US — but is nevertheless high — with such diverse
European countries as Great Britain, Italy, Sweden, Spain, Poland, and Russia having a Gini index of 69, 63, 73, 67, 58, and 78, respectively, in 2010.77
In this section, we have two tasks in front of us. First, we must examine in greater detail and with a longer-term perspective what the dynamics of inequality are in different regions of the world. Although inequalities are increasing in many countries, this is not everywhere the case. Moreover, viewed in historical perspective, contemporary inequalities are less worrying than is usually claimed. Capitalism has not been steadily increasing inequalities from an allegedly low starting point in pre-capitalist times to new highs every next decade.
Second, because in contrast to poverty and exploitation inequality is not immediately and by itself welfare reducing, we must explore the likely indirect deleterious effects that high, and rising, inequality can have on society over time. In other words, even though it makes for a good political slogan, it is important to note that high and rising inequality does not necessarily, simply by definition, mean that the rich are getting richer while the poor are getting poorer. That is a misconstrual of what (rising) inequality is. In fact, as we have seen in the first section on poverty, most advanced economies have seen the incomes of their poorest 10% grow between 1979 and 2007, even though inequalities were also increasing in the same period. Even in the US, where the poorest of the poor really were economically stagnant in the past decades and where inequalities are highest compared to the rest of the developed world, the average person nevertheless saw their income grow. Both the real median family income and personal income have risen by around 40% between 1974 and 2019.78
That is why we must carefully consider how high and rising inequality nevertheless might be injurious to the less privileged in ways other than directly lowering their living standards. Some tend to skip this important step. The economist Deirdre McCloskey, for example, claims there is nothing serious to worry about in regards to increasing inequality, as long as poverty is also not increasing. As she acerbically puts it, critiquing Piketty,
What is worrying [him] is that the rich might possibly get richer, even though the poor get richer too. His worry, in other words, is purely about difference, about the Gini coefficient, about a vague feeling of envy raised to a theoretical and ethical proposition.79
McCloskey’s critique notwithstanding, we will see that there is more to inequality than just a ‘vague feeling of envy.’
Is the world getting more unequal? In one sense, the answer is definitely ‘no’ — despite the previously cited figures. Global income inequality, i.e. inequality between all individual citizens of the world, has indeed been on the rise between 1820 and 1950, as the world Gini index rose from 55 to more than 70. But then inequality more or less stagnated after World War II, and around 1980 a slow decline was already in effect.80 At the beginning of the 21st century, global inequality declined sharply in a short span of time so that in 2013 world Gini index stood at 65, which is around what it had been in 1900. Therefore, it was higher in 2013 than before, and still very high in an absolute sense, but also lower than at any other point in the 20th century. The decline has continued in recent years all the way up to the present (2020).81 This happened primarily (but not solely, especially not in recent years) due to the spectacular economic rise of China since 1980 and India somewhat later.82
Income inequality between countries, i.e. the difference in average income across different societies, has also been on a downward trend lately. Depending on the particular measure (weighting countries by their populations or not), between-country income inequality has been modestly falling either since 2001 (to a Gini of around 54 in recent years) when unweighted between-country inequality reached a historic peak (Gini of 57), or already since 1990, when weighted between-country inequality started sharply declining from a high Gini of around 62 (after a two-decade long stagnation that has been going on since the early 1970s) to a significantly lower Gini of around 50 in late 2000s, even dipping to 45 in the last decade.83
In recent decades, there are even societies that have seen their within-country inequality fall. This means that differences in income between people of the same society have been reduced. For instance, since the 1990s — but particularly since the early 2000s — income inequality has been reduced within almost all Latin American countries.84 Just between 2002 and 2012, the Gini coefficient of Brazil, Mexico, El Salvador, Peru, Argentina, Nicaragua, and Bolivia declined between 6% and 16% (in Chile it declined by slightly less than 5%).85 Of course, this decline cannot be simply attributed to the successful performance of competitive markets, the main engine of capitalism. The welfare state was also a key proximal mechanism of inequality reduction.86 Moreover, Latin American income inequality, which has historically been very high, remains high today and is much higher than, say, inequality in Europe. However, the notable inequality decrease in almost all Latin American countries shows that at least a social variety of the capitalist economy can prevent increases in inequality and that the gap between rich and poor need not inherently, inevitably rise within a modern economy.
How about within-country inequality outside Latin America? Between 2004 and 2019, the Gini coefficient in the EU has remained roughly stagnant, on average, and it has stayed at a low level (below a Gini of 35) throughout.87 However, a broader perspective, which includes other developed countries outside the EU and looks further back in time, shows that income inequality has actually risen in many OECD countries at the close of the 20th century. Between 1985 and 2008, for example, Mexico, the US, Israel, Australia, Canada, New Zealand, Norway, and even EU countries such as the UK (now a former member), Italy, Finland,
Sweden, Denmark, and the Netherlands have all seen their Gini coefficient rise by several points.88 Some, such as France, Hungary, and Belgium have stayed put in the same time period, while others, such as Greece or Turkey (outside EU), have actually lowered their inequality slightly.89
A different measure of within-country inequality, i.e. the share of total societal income received by the top 1% of earners, also provides important evidence of the evolution of inequality. According to this measure, inequality has been significantly rising for several decades between 1980 and 2014 in the US and in other English-speaking countries such as Ireland, Australia, Canada, and the UK.90 On the other hand, however, this same measure of inequality has remained virtually stagnant in France, Japan, Spain, the Netherlands, and Denmark over the same three decades.91 In these latter countries, the share of income received by the top 1% remains similar in 2014 (even if measured before taxes and redistribution) to what it was in the 1960s or 1970s, i.e. around a tenth (or lower) of the whole societal income.92
Across the whole of Europe, the share of income captured by the top 10% — which, note, is a different measure of inequality than the top 1% income share from the previous paragraph — has risen somewhat between 1980 and the late 1990s but has then remained stagnant between the late 1990s and late 2010s, not increasing any further.93 China has seen a more pronounced increase since 1980 (from under 30% to over 40%) and no later stagnation, while in India the share has almost doubled from 30% to over 55% in the same period.94 On the other hand, The Middle East and Brazil registered a decline since 1990, and SubSaharan Africa has stagnated.
Lastly, if we average it across the whole world, within-country income inequality measured with the Gini coefficient actually turns out to have been remarkably stable in the second half of the 20th century (1950—1990), fluctuating between 38 and 39.95 From 1990 onward, however, it suddenly significantly increased, mostly on account of China.96
To conclude, the evolution of global, between-country, and within-country inequality does not point in the same direction. Even the exact trends of each of the three inequality measures, respectively, are highly dependent on the time period and geographical location under study. Any simple, straightforward conclusion about the evolution of inequality under capitalism is unfounded.
Inequalities of wealth also present a more complicated picture than is usually claimed. The Gini coefficient of wealth inequality in Britain, France, Germany, Italy, and Sweden was lower in 2010 than in 1950 and 1960, and it was either lower or the same in 2010 than in 1970.97 Looking further back in time, the wealth Gini for Britain, France, Italy, and Sweden (the only countries we have historical data for, apart from the US) in 2010 was significantly lower than in 1820 (when it was around 90) or 1900 (around 90) or even 1920 (around 90).
Looking at the share of total societal wealth owned by the richest 1%, the richest Americans do possess a significantly larger percentage of wealth in 2010 than they did in 1950—1970. According to Piketty’s data, the percentage in 2010 comes to about 34%, or 4 percentage points more than in 1970.98 But even this is still much lower than it had been in 1920 or 1910 when the US top 1% wealth share stood at around 45%.99 According to Gabriel Zucman’s research, the increase has been somewhat more steep, approaching 39% in recent years but currently stagnating, which is comparable to the early 20th century.100
Piketty’s data show that the top 1% in Europe in 2010 owned around 25% of total wealth, which is 5 percentage points more than in 1970 or 1980.101 Relative to that point, wealth inequality is clearly increasing. However, the wealth share was much, much higher in the past: almost 40% in 1950, 55% in 1920, and more than 60% in 1910. Even in 1810, when almost no European society was capitalist, the top 1% wealth share was higher than 50%. Relative to that point, European inequality today is much lower.
The same trends are evident if we look at individual European countries for which we have deep historical data.102 In Denmark, France, Finland, UK, Norway, and Sweden, the top 1%’s share of total wealth at the beginning of the 21st century is a few percentage points higher than what it had been in the early 1980s. It moved from under 20% to over 20%. However, this contemporary level of inequality is substantially lower compared to the 1950s or 1960, and doubly or triply lower compared to early 20th or the whole of 19th century. At the end of 18th century, wealth inequality in pre-capitalist European societies was already high. It then rose even higher in the 19th and early 20th century (with the exception of Norway and Denmark), and it declined sharply in mid-20th century, bottoming out at historically unprecedented levels around 1980. After that, it increased again, but it did so extremely modestly, viewed in this broader historical perspective.
Lastly, Zucman has constructed a proxy measure for world distribution of wealth by combining the top 1% wealth shares in China, Europe, and the US.103 In the 1980s, this proxied global top 1% had a wealth share of around 27%. Between 2010 and 2017, the share stood at around 32%—33%, which is a notable increase. Interestingly, however, the biggest increase occurred in the 1990s. Indeed, looking at the period between the late 1990s and 2017, one is struck by the now two-decade long stagnation of the top 1% wealth share.
The fact remains that considered over a longer time period — say, half a century — within-country income and wealth inequality have risen in many countries. This should not be ignored or underemphasized. With that in mind, let us turn to the potential (and actual) pernicious social effects of inequality.
None of the above observations should be seen as recommending complacency. Rising inequality, and especially a high level of inequality (which, fortunately, is currently not characteristic of most OECD countries), can have various deleterious effects on society. Employing simple rational choice analysis, it should be easy to see how inequality might theoretically cause the following, to mention just a few general possibilities: (i) broad political instability in a society, (ii) increased possibility for the rich to engage in more rent-seeking and corruption, or (iii) rising educational inaccessibility.
To be more specific, (i) political instability can be caused by inequality due to potential resentment and polarization of the less well-off as they compare their slower rate of improvement with the much faster rate of improvement of those more well-off. Inequality can also (ii) increase rent-seeking and corruption because the faster rate of material improvement for the rich causes them to possess a greater amount of resources with which they can influence the political process in comparison to the poor and ordinary citizens, whose resources are growing at a slower rate. (iii) If costs of education keep increasing at the current enormous rates, if public education spending is not keeping pace with these increases, and if the rich grow faster than other segments of the society, then poor and ordinary citizens will not be as able to climb as high on the education ladder as the rich.
These hypothetical developments are worrying already by themselves, but they also lead to further social problems down the line. Most importantly, the three consequences of inequality outlined above are themselves potential causal channels that lead from inequality to reduced economic growth. And if economic growth is impacted negatively, the prospects for improving the material well-being of the poor and ordinary citizens are also very likely to be directly undermined. The causal logic at work is not hard to imagine. Political instability, for instance, can disrupt economic growth because (or if) it negatively affects the general business and investment climate. Heightened rent-seeking and corruption cause state-mediated resource misallocation and thus hurt economic growth through reduced economic efficiency. Lastly, inaccessible education is likely to lead to talent misallocation, which again constitutes economic inefficiency and leads to reduced economic output. Whatever the particular causal mechanism, it is highly theoretically plausible that increased inequality negatively impacts economic growth in some way.
What does the empirical literature tell us about this? In the 1990s, an empirical consensus was emerging in economics that high and rising inequality, indeed, significantly reduces economic growth.104 As one team of researchers in 1999 summarized the evidence, ‘The picture [recent studies] draw is impressively unambiguous, since they all suggest that greater inequality reduces the rate of growth.’105 However, early dissenters started appearing already at the turn of the century.106 After that, the consensus shrank considerably or even disappeared, with many new studies reporting non-existent, mixed, or inconclusive results, especially in advanced economies.107 There are a few recent exceptions, but these are also disputed.108 In the 2017 iconoclastic collection Economic Ideas You Should Forget, Clemens Feust pithily proclaims, taking note of the just-mentioned exceptions, that
Recent studies published by the OECD and IMF ... constitute a misinterpretation of the existing data and research findings. . There is extensive academic literature on the nature of the link between inequality and growth. The consensus finding of this research is that there is no robust correlation — either negative or positive — between the two.109
To my knowledge, there exists only one contemporary meta-analysis (from 2008) pooling together the various existing studies and using them to estimate the overall average effect of inequality on growth. Its main conclusion is twofold: ‘In the empirical literature, the majority of cross-sectional studies have found a negative relationship between income inequality and growth. However, the negative effect seems to disappear when the models are estimated using panel data techniques.’110 This means that, ‘So far no clear conclusions has been reached . it is simply misleading to simply speak of a positive or negative relationship between income inequality and economic growth.’111
Nowadays, more complex studies that do not simply look at the relationship between inequality and growth, but also include interaction terms such as intergenerational mobility, seem the most promising in shedding new light on this controversy. For instance, a recent study again confirmed, in contrast to the emerging consensus of the 1990s, that the simple (negative) relationship between inequality and growth simply does not hold.112 But the same study also demonstrated that, dependent on the presence of low intergenerational mobility, rising inequality can significantly affect growth. More precisely, the researchers found that, if inequality increases by ten units of Gini (expressed in percentage points) and if the starting intergenerational income elasticity (IGE) is not too high — as is the case in France, which sits at the 40th percentile —, then the average economic growth over the next five years is only 0.1 percentage points lower than it would have been otherwise. However, the same increase in inequality in a country with much higher IGE — say, Brazil, which is at the 75 th percentile — results in a significant reduction of economic growth: 0.7 percentage points over the next five years. Theoretically, this is also perfectly plausible, but further empirical research on this topic is needed before concluding a robust negative relationship.
Aside from economic growth, there is almost an inexhaustible set of potential other important social outcomes inequality is regularly claimed to damage. The provocative and highly publicized book The Spirit Level famously set out to demonstrate in 2010 that rising and high inequality is not only tied to worse economic outcomes, but that it also exacerbates crime, leads to obesity and drug use, increases child mortality, mental illness, and teenage pregnancies, reduces social trust, and so on.113
The book has been rightly criticized as several of the presented analyses failed to replicate. For instance, the association between inequality and mental illness, obesity, and life expectancy loses statistical significance when OECD data is used instead of UN data. More importantly, it has been pointed out that some of the demonstrated correlations are not likely to be causal.114
Nevertheless, some of the book’s claims seem to be borne out in the research (including the research generated after its publication). For instance, there is a clear correlation between higher inequality and certain health problems.115 To some researchers, the correlation lends itself to a causal interpretation, but others remain more sceptical of its causal status.116 Moreover, recent research typically finds that both happiness and generalized trust are decreased by rising or high inequality, at least after a certain critical inflection point has been reached.117 Further still, the idea that inequality and crime seem to be connected — even causally so — has generally stood up to detailed scrutiny. Multiple meta-analyses find inequality to be a strong and consistent predictor of crime, especially homicide, with more inequality being associated with more crime.118 Interestingly, however, the first such meta-analytic study to cover Europe specifically goes somewhat against this emerging consensus. It does replicate the finding that income inequality is associated with an increase in inequality, but the effect is extremely small, accounting for only 3% of the variance. Moreover, the effect was statistically significant only in Eastern and Northern Europe but not Western and Southern Europe.119
It is not the intention of this section to go over the whole scholarly debate on inequality’s social correlates. However, I hope that both the theoretical and empirical sampling I provided above gives one a taste for the complexities involved.
In the beginning of the section on inequality, we have seen McCloskey rightly point out that rising inequality almost never results in ‘the rich getting richer and the poor getting poorer’ scenario decried by the political slogans of many social activists. Nevertheless, we have also seen that inequality is not only a trivial aesthetic social issue having primarily to do with our uglier, superficial emotions such as envy, which we can and should ignore if we are rational, adult, virtuous people (as McCloskey also seems to suggest). To the contrary, it can potentially be a serious social phenomenon that does, in certain circumstances, lead not only to an erosion of social stability, trust, and order but can even affect people’s basic material well-being in a negative fashion by, for instance, impinging on their health and by creating economic deadweight loss. Despite McCloskey’s justified point about the rising tide lifting all boats, inequality as a contemporary social phenomenon should be taken seriously, not dismissed out of hand.
In 1996, the economics Nobel laureate James Buchanan wrote for the Wall Street Journal that,
Just as no physicist would claim that ‘water runs uphill,’ no self-respecting economist would claim that increases in the minimum wage increase employment. Such a claim, if seriously advanced, becomes equivalent to a denial that there is even minimal scientific content in economics, and that, in consequence, economists can do nothing but write as advocates for ideological interests.120
He wrote this in the 1990s, when rigorous empirical research on the effects of minimum wage in real-world markets was basically in its infancy. We now possess, as Buchanan did not, decades of evidence to show that, at least in some markets, modest increases of the minimum wage decrease employment only scarcely, do not decrease it at all in others cases, and can even increase it sometimes. But even apart from this, Buchanan’s insinuation that there is simply no theoretical possibility of a minimum wage resulting in increased employment is (and was) wrong.121 As the monopsony model demonstrates, it definitely is at least a theoretical possibility.
In 2017, the economist Russ Roberts made the argument that economics as a science is quite empirically under- or even undetermined, primarily because economists cannot create robust experimental conditions and really examine the impact of a variable in total (or at least sufficient) isolation from other vari-ables.122 From this claim, he arrived at two conclusions. First, he laudably calls for less selective sharing of empirical findings. However, second, he also claims that ‘Economics is primarily a way of organizing one’s thinking in considering incentives and costs and the interactions between individuals that we call a market but is really emergent behavior with feedback loops.’123 In a word, economics is for Roberts primarily a theoretical activity. With this, he is — perhaps unintentionally — intimating something similar to what Buchanan seems to have said in 1996. That is, theoretically, increases in the minimum wage simply cannot increase unemployment due to the fundamental theoretical law of supply and demand.
What Roberts overlooks, however, is that there is not only one theoretical model generated by the economic way of thinking but many. Assuming perfect competition, Roberts’ basic economic analysis of incentives correctly suggests increases in minimum wage will increase unemployment. However, assuming imperfect competition — the presence of market power, search costs and frictions, market concentration — the same economic way of thinking theoretically suggests a different possibility (or even necessity, in certain cases). In short, economic theory itself is not unambiguous but instead points in two completely different directions. And to know which theoretical assumption (and, therefore, conclusion) is more appropriate for the real world — or, more precisely, for a certain corner of the real world — one cannot do anything else but rely on empirical investigation. Roberts’ counterpoint that empirical research can be undertaken in a biased way, or reported selectively (knowingly or not), is well taken. However, the solution then cannot be to ‘primarily’ rely on economics as a body of theory, as Roberts in part suggests. It cannot be, simply because that body of theory produces many different predictions for different social environments.
The present chapter strove to demonstrate that fact, and to show how one can use a combination of rational choice analysis and both simple and more complex statistics to arrive at nuanced and tentative, not partisan and absolutist, conclusions about how the modern economy works.
Chibber (2018, 22-23).
Chibber (2018).
Roser (2013).
In Baumol (1983), one of the world’s most influential economists (according to IDEAS/RePEc), the now-deceased William Baumol, reviews the relevant textual evidence and clearly demonstrates that Marx mostly argued against the naive Lassal-lean ‘iron law of wages,’ according to which wages in capitalism should be driven to the bare subsistence minimum. As Baumol puts it,
Both vulgar Marxists and vulgar opponents of Marx have propounded two associated myths: that he believed wages under capitalism are inevitably driven near some physical subsistence level and that he considered this to constitute robbery of the workers and a major evil of capitalism.
Baumol (1983, 303)
Hickel (2019a).
Beer (2020).
Ibid.
Oxfam (2021).
Elkins (2018).
Alvaredo et al. (2018).
Hickel (2019a); Milanovic (2019a); Hasell and Roser (2019).
See, e.g., Hickel (2019b; 2021).
Hickel (2019a). All subsequent points come from this source.
See Roser (2013); Hasell and Roser (2019).
Ibid.
Allen (2017).
Moatsos (2021).
Ibid.
The following are all the countries used from each individual world region:
Japan for East Asia; South Africa (and Ghana up to 1870) for sub-Saharan Africa; Jordan, Lebanon, Egypt, Iran, Morocco, Tunisia, Syria and Turkey for the Middle East and North Africa; Denmark, Norway, Austria, Ireland, Italy, the Netherlands, France, the United Kingdom, Finland, Sweden and Portugal for Western Europe; the United States, Canada and Australia for the Western Offshoots; Argentina, Brazil, Chile, Colombia, Jamaica, Mexico, Peru, Uruguay and Venezuela for Latin America and the Caribbean; Indonesia, Sri Lanka, Myanmar, Malaysia, Nepal, the Philippines, Thailand and India (up to 1821) for South and Southeast Asia; and Poland for Eastern Europe and the former Soviet Union. More countries are used for imputations later in the 19th century and in the 20th and 21st centuries.
Ibid., n18
Ibid.
See, e.g. Acemoglu and Robinson (2012).
Brenner (2001; 2007). See also Brenner (2006). Compare Teschke and Lacher (2007).
Moatsos (2021).
Roser (2021).
Ibid. All subsequent data in this paragraph come from the same source.
Roser (2013).
Ibid.
Aguilar et al. (2021).
Ibid. All subsequent data in this paragraph come from this source.
See, e.g. Milanovic (2019b, chapter 3).
For a brief review and references, see Rutar (2022, 49—50).
Gwartney et al. (2020, 56).
Ibid.
Roser (2021). All subsequent data in this paragraph come from this source.
Ibid.
Moatsos (2021), figure 9.14.
Gwartney et al. (2020, 20). All subsequent data in this paragraph come from this source.
Kenworthy (2011, 6-8).
Ibid., 5.
Ibid., 10-13.
Ibid., 9. My emphasis.
Ibid., 15.
Marx (1983 [1867]).
Chibber (2018); Wright (2010, chapter 3).
Wright (2010, 28).
Chibber (2018, 25).
See, e.g. Cowen and Tabarrok (2015, 329-333).
Gintis (2018, 1-2).
The critical and heterodox-leaning economist Dani Rodrik makes the same point in Rodrik (2015).
Isen (2013); Naidu et al. (2018).
Acemoglu (2002). See also Lohr (2022).
Autor (2014).
Ibid.
Autor et al. (2016).
Chibber (2018, 22).
Cowen in Anderson (2019, 109).
Card and Krueger (2015). See Preface to the Twentieth-Anniversary Edition.
For example, Dube (2019) and Cengiz et al. (2019). But see, also, the contrary, more critical research by David Neumark that demonstrates a more classical empirical result, e.g. Neumark and Wascher (2006); Neumark and Shirley (2021).
Azar et al. (2019).
Sokolova and Sorensen (2020).
Ibid., 51.
Council of Economic Advisers (2016, 6).
Ibid., 5.
Ibid.
Azar et al. (2020).
Gutierrez and Philippon (2017, 1).
Ibid., 1.
Ibid., 2.
De Loecker and Eeckhout (2018).
Stansbury and Summers (2020).
Roser and Ortiz-Ospina (2013).
Ibid.
OECD (2011).
Piketty (2014, 348).
Alfani (2021, table 5.5).
Piketty (2014, 349).
Alfani (2021, table 5.5).
FRED (2021a; 2021b).
McCloskey (2015, 7).
Milanovic (2019b, 7); see also Bourguignon (2015, 27).
Gradm (2021, Figure 14).
Liberati (2015); Gradm (2021).
Liberati (2015); Milanovic (2016, 166). See also Milanovic (2018) and Gradm (2021).
Roser Ortiz-Ospina (2013); Lustig et al. (2016).
Lustig et al. (2016).
Ibid.
OECD (2021).
OECD (2011), Figure 1.
Ibid.
Roser Ortiz-Ospina (2013).
Ibid.
Ibid.
Human Development Report (2019, 111).
Ibid.
Van Zanden et al. (2014, 285). See also Liberati (2015, 252).
Liberati (2015, 252).
Alfani (2021), table 5.5.
Piketty (2014, 349).
Ibid.
Zucman (2019).
Piketty (2014, 349).
See CORE Team (2017), Chapter 19.
Zucman (2019, 127).
Persson and Tabellini (1994); Aghion et al. (1999); Mo (2000); Keefer and Knack (2002).
Aghion et al. (1999, 1617).
Patridge (1997); Forbes (2000); Li and Zou (2002).
Barro (2008); Chambers and Krause (2010); Kraay (2015); Dollar et al. (2015); Aiyar and Ebeke (2020).
See Kraay (2015).
Fuest (2017, 63-64).
de Dominicis et al. (2008, 677).
Ibid., 677-678.
Aiyar and Ebeke (2020).
Pickett and Wilkinson (2010).
See, on both points, the careful report by Rowlingson (2011); see also, more controversially, the critique of The Spirit Level by Saunders (2010). Noble (2010) criticizes Saunders’ critique.
Subramanian and Kawachi (2004); Babones (2008); Pickett and Wilkinson (2015); Matthew and Brodersen (2018).
Picket and Wilkinson (2015) explicitly affirm causality, while Babones (2008) remains sceptical. For scepticism see also Deaton (2003).
For instance, Oishi et al. (2011); Barone and Mocetti (2015); Yu and Wang (2017); Graafland and Lous (2018). See also the review by Nannestad (2008).
Nivette (2011); Trent and Pridemore (2011).
Kim et al. (2020).
Quoted by Perry (2013).
Although see Magness (2021) on how Buchanan’s quote can be misread. Magness also points out that Buchanan’s quote should not be construed as Buchanan denying the theoretical possibility of minimum wage increases leading to higher unemployment, because Buchanan himself discussed the positive employment effects of this legislation under conditions of monopsony in his and his colleagues’ 1954 economics textbook.
Roberts (2017).
Ibid.
Acemoglu, Daron. 2002. ‘Technical Change, Inequality, and the Labor Market,’ Journal of Economic Literature 40, no. 1, 7—72.
Acemoglu, Daron, and James Robinson. 2012. Why Nations Fail: The Origins of Power, Prosperity, and Poverty. London: Profile Books.
Aghion, Philippe, Caroli, Eve, and Cecilia Garcia-Penalosa. 1999. ‘Inequality and Economic Growth: The Perspective of the New Growth Theories,’ Journal of Economic Literature 37, no. 4, 1615—1660.
Aguilar, R. Andres Castaneda, Fujs, Tony, Lakner, Christoph, Mahler, Daniel Gerszon, Nguyen, Minh Cong, Schoch, Marta, and Martha Viveros. 2021. ‘March 2021 Global Poverty Update from the World Bank’, World Bank, March 16. Accessible via: https:// blogs.worldbank.org/opendata/march-2021-global-poverty-update-world-bank/.
Aiyar, Shekhar, and Christian Ebeke. 2020. ‘Inequality of Opportunity, Inequality of Income and Economic Growth,’ World Development 136, 1—10.
Alfani, Guido. 2021. ‘Wealth Inequality in the Long Run,’ in OECD, How Was Life? Volume II: New Perspectives on Well-being and Global Inequality Since 1820, 103—123. Paris: OECD Publishing.
Allen, Robert C. 2017. ‘Absolute Poverty: When Necessity Displaces Desire,’ American Economic Review 107, no. 12, 3690—3721.
Alvaredo, Facundo, Chancel, Lucas, Piketty, Thomas, Saez, Emmanuel, and Gabriel Zucman. 2018. ‘The Elephant Curve of Global Inequality and Growth,’ AEA Paper and Proceedings 108, 103—108.
Autor, David. 2014. ‘Skills, Education, and the Rise of Earnings Inequality among the “Other” 99 Percent,’ Science 344, no. 6186, 843-851.
Autor, David H., Dorn, David, and Gordon H. Hanson. 2016. ‘The China Shock: Learning from Labor-Market Adjustment to Large Changes in Trade,’ Annual Review of Economics 8, 205—240.
Azar, Jose, Huet-Vaughn, Emiliano, Marinescu, loana, Taska, Bledi, and Till von Wachter. 2019. ‘Wage Employment Effects and Labor Market Concentration,’ NBER Working Paper 26101. Accessible via: https://nber.org/papers/w26101/.
Azar, Jose, Marinescu, Ioana, and Marshall I. Steinbaum. 2020. ‘Labor Market Concentration,’ The Journal of Human Resources, May 12, Published online before print.
Babones, Salvatore J. 2008. ‘Income Inequality and Population Health: Correlation and Causality,’ Social Science & Medicine 66, no. 7, 1614—1626.
Barone, Guglielmo, and Sauro Mocetti. 2015. ‘Inequality and Trust: New Evidence from Panel Data,’ Economic Inquiry 54, no. 2, 794—809.
Barro, Robert J. 2008. ‘Inequality and Growth Revisited,’ Working Paper. Accessible via: https://www.econstor.eu/handle/10419/109529/.
Baumol, William J. 1983. ‘Marx and the Iron Law of Wages,’ The American Economic Review 73, no. 2, 303-308.
Beer, Tommy. 2020. ‘Top 1% Of U.S. Households Hold 15 Times More Wealth Than Bottom 50% Combined,’ Forbes, October 8. Accessible via: https://www.forbes.com/ sites/tommybeer/2020/10/08/top-1-of-us-households-hold-15-times-more-wealth-than-bottom-50-combined/?sh=6ec464f65179/.
Bolt, Jutta, and Jan Luiten van Zanden. 2021. ‘The Long View on Economic Growth: New Estimates of GDP,’ in OECD, How Was Life? Volume II: New Perspectives on Well-being and Global Inequality Since 1820, 29—52. Paris: OCED Publishing.
Bourguignon, Francois. 2015. The Globalization of Inequality. Princeton: Princeton University Press.
Brenner, Robert. 2001. ‘The Low Countries in the Transition to Capitalism,’ Journal of Agrarian Change 1, no. 2, 169—241.
Brenner, Robert. 2006. ‘What Is, and What Is Not, Imperialism?’ Historical Materialism 14, no. 4, 79-105.
Brenner, Robert. 2007. ‘Property and Progress: Where Adam Smith Went Wrong,’ in Chris Wickham (ed.), Marxist History-writing for the Twenty-first Century, 49-111. Oxford: Oxford University Press.
Card, David, and Alan B. Krueger. 2015. Myth and Measurement: The New Economics of the Minimum Wage — Twentieth-Anniversary Edition. Princeton: Princeton University Press.
Cengiz, Doruk, Dube, Arindrajit, Lindner, Attila, and Ben Zipperer. 2019. ‘The Effect of Minimum Wages on Low-Wage Jobs,’ The Quarterly Journal of Economics 134, no. 3, 1405-1454.
Chambers, Dustin, and Alan Krause. 2010. ‘Is the Relationship Between Inequality and Growth Affected by Physical and Human Capital Accumulation?’ The Journal of Economic Inequality 8, no. 2, 153-172.
Chibber, Vivek. 2018. The ABCs of Capitalism: Understanding Capitalism. New York: Jacobin.
Council of Economic Advisers. 2016. ‘Benefits of Competition and Indicators of Market Power,’ Council of Economic Advisers Issue Brief, April 2016. Accessible via: https://obamawhitehouse.archives.gov/sites/default/files/page/files/20160414_cea_ competition_issue_brief.pdf/.
Cowen, Tyler, and Alex Tabarrok. 2015. Modern Principles of Economics: Third Edition. New York: Worth Publishers.
de Dominicis, Laura, Florax, Raymond J. G. M., and Henri L. F. de Groot. 2008. ‘A Meta-Analysis on the Relationship Between Income Inequality and Economic Growth,’ Scottish Journal of Political Economy 55, no. 5, 654-682.
De Loecker, Jan, and Jan Eeckhout. 2018. ‘Global Market Power,’ NBER Working Paper 24768. Accessible via: https://nber.org/papers/w24768/.
Deaton, Angus. 2003. ‘Health, Inequality, and Economic Development,’ Journal of Economic Literature 41, no. 1, 113-158.
Dollar, David, Kleineberg, Tatjana, and Aart Kraay. 2015. ‘Growth, Inequality, and Social Welfare: Cross-country Evidence,’ Economic Policy 30, no. 82, 335-377.
Dube, Arindrajit. 2019. ‘Impacts of Minimum Wages: Review of the International Evidence,’ Independent Report for the UK Government. Accessible via: https:// www.gov.uk/government/publications/impacts-of-minimum-wages-review-of-the-international-evidence/.
Elkins, Kathleen. 2018. ‘How Much Money You Need to Be Part of the 1 Percent Worldwide,’ CNBC, November 1. Accessible via: https://www.cnbc.com/2018/11/01/ how-much-money-you-need-to-be-part-of-the-1-percent-worldwide.html/.
Forbes, Kristin J. 2000. ‘A Reassessment of the Relationship Between Inequality and Growth,’ The American Economic Review 90, no. 4, 869-887.
FRED. 2021b. ‘Real Median Personal Income in the United States,’ U.S. Census Bureau.
Accessible via: https://fred.stlouisfed.org/series/MEPAINUSA672N.
Fuest, Clemens. 2017. ‘Inequality Reduces Growth,’ in B. Frey and D. Iselin (eds.), Economic Ideas You Should Forget, 63-64. Cham: Springer.
Graafland, Johan, and Bjorn Lous. 2018. ‘Economic Freedom, Income Inequality and Life Satisfaction in OECD Countries,’ Journal of Happiness Studies 19, 2071-2093.
Gradm, Carlos. 2021. ‘Trends in Global Inequality Using a New Integrated Dataset,’ WIDER Working Paper 2021/61. Accessible via: https://www.wider.unu.edu/ sites/default/files/Publications/Working-paper/PDF/wp2021-61-trends-global-inequality.pdf/.
Gutierrez, German, and Thomas Philippon. 2017. ‘Declining Competition and Investment in the U.S.,’ NBER Working Paper 23583. Accessible via: https://nber.org/ papers/w23583/.
Gwartney, James, Lawson, Robert, Hall, Joshua, and Ryan Murphy. 2020. Economic Freedom of the World: 2020 Annual Report. Fraser Institute.
Hasell, Joe, and Max Roser. 2019. ‘How Do We Know the History of Extreme Poverty?’ OurWorldInData.org. Accessible via: https://ourworldindata.org/ extreme-history-methods/.
Hickel, Jason. 2019a. ‘Bill Gates Says Poverty Is Decreasing. He Couldn’t Be More Wrong,’ The Guardian, January 29. Accessible via: https://www.theguardian. com/commentisfree/2019/jan/29/bill-gates-davos-global-poverty-infographic-neoliberal/.
Hickel, Jason. 2019b. ‘A Letter to Steven Pinker (And Bill Gates, For That Matter) About Global Poverty,’ Jason Hickel blog, February 4. Accessible via: https://www. jasonhickel.org/blog/2019/2/3/pinker-and-global-poverty/.
Hickel, Jason. 2021. ‘Extreme Poverty Isn’t Natural, It’s Created,’ Jason Hickel blog, March 28. Accessible via: https://www.jasonhickel.org/blog/2021/3/28/extreme-poverty-isnt-natural-it-is-created/.
Human Development Report. 2019. Beyond Income, Beyond Averages, Beyond Today: Inequalities in Human Development in the 21st Century. New York: United Nations Development Programme.
Isen, Adam. 2015. ‘Dying to Know: Are Workers Paid Their Marginal Product,’ Unpublished Manuscript. Summary accessible via: https://research.upjohn.org/cgi/ viewcontent.cgi?article=1056&context=dissertation_awards/.
Jordahl, Henrik. 2007. ‘Inequality and Trust,’ IFN Working Paper No. 715. Accessible via: https://www.ifn.se/Wfiles/wp/wp715.pdf/.
Keefer, Philip, and Stephen Knack. 2002. ‘Polarization, Politics and Property Rights: Links Between Inequality and Growth,’ Public Choice 111, 127—154.
Kenworthy, Lane. 2011. Progress for the Poor. Oxford: Oxford University Press.
Kim, Bitna, Seo, Chunghyeon, and Young-Oh Hong. 2020. ‘A Systematic Review and Meta-analysis of Income Inequality and Crime in Europe: Do Places Matter?’ European Journal of Criminal Policy and Research, OnlineFirst.
Kraay, Aart. 2015. ‘Weak Instruments in Growth Regressions: Implications for Recent Cross-country Evidence on Inequality and Growth,’ World Bank Policy Research Working Paper. Accessible via: https://papers.ssrn.com/sol3/papers. cfm?abstract_id=2690633/.
Li, Hongyi, and Heng-fu Zou. 2002. ‘Income Inequality is not Harmful for Growth: Theory and Evidence,’ Review of Development Economics 2, no. 3, 318—334.
Liberati, Paolo. 2015. ‘The World Distribution of Income and Its Inequality, 1970-2009,’ Review of Income and Wealth 61, no. 2, 248-273.
Lohr, Steve. 2022. ‘Economists Pin More Blame on Tech for Rising Inequality,’ The New York Times, January 11. Accessible via: https://www.nytimes.com/2022/01/11/ technology/income-inequality-technology.html/.
Lustig, Nora, Lopez-Calvan, Luis F., Ortiz-Juarez, Eduardo, and Celestin Monga. 2016. ‘Deconstructing the Decline in Inequality in Latin America,’ in Kaushik Basu and Joseph E. Stiglitz (eds.), Inequality and Growth: Patterns and Policy. Volume II: Regions and Regularities, 212-247. London: Palgrave Macmillan.
Magness, Phillip W. 2021. ‘Eyes on the Politicized Prize,’ American Institute for Economic Research, October 12. Accessible via: https://www.aier.org/article/ eyes-on-the-politicized-prize/.
Matthew, Pravin, and Donka Mirtcheva Brodersen. 2018. ‘Income Inequality and Health Outcomes in the United States: An Empirical Analysis,’ The Social Science Journal 55, no. 4, 432-442.
McCloskey, Deirdre N. 2015. ‘How Piketty Misses the Point,’ Cato Policy Report 37, no. 4, 5-8.
Milanovic, Branko. 2016. Global Inequality: A New Approach for the Age of Globalization. Cambridge: The Belknap Press of Harvard University Press.
Milanovic, Branko. 2018. Tweet on ‘Three concepts of inter-national income inequality, 1952-2017,’ October 19. Accessible via: https://twitter.com/BrankoMilan/ status/1053062464479334401/photo/1/.
Milanovic, Branko. 2019a. ‘Global Poverty Over the Long-Term: Legitimate Issues,’ Globalinequality Blog, February 6. Accessible via: https://glineq.blogspot. com/2019/02/global-poverty-over-long-term.html?spref=tw/.
Milanovic, Branko. 2019b. Capitalism, Alone: The Future of the System That Rules the World. London: The Belknap Press of Harvard University Press.
Moatsos, Michail. 2021. ‘Global Extreme Poverty: Present and Past since 1820,’ in OECD, How Was Life? Volume II: New Perspectives on Well-being and Global Inequality since 1820, 186-215. Paris: OECD Publishing.
Mo, Pak Hung. 2000. ‘Income Inequality and Economic Growth,’ Kyklos 53, no. 3, 293-315.
Naidu, Suresh, Posner, Eric A., Weyl, and E. Glen Weyl. 2018. ‘Antitrust Remedies for Labor Market Power,’ Working Paper. Accessible via: https://equitablegrowth.org/ working-papers/antitrust-remedies-forlabor-market-power/.
Nannestad, Peter. 2008. ‘What Have We Learned About Generalized Trust, If Anything?’ Annual Review of Political Science 11, 413-436.
Neumark, David, and Peter Shirley. 2021. ‘Myth or Measurement: What Does the New Minimum Wage Research Say about Minimum Wages and Job Loss in the United States?’ NBER Working paper nr. 28388. Accessible via: https://www.nber.org/papers/w28388/.
Neumark, David, and William Wascher. 2006. ‘Minimum Wages and Employment: A Review of Evidence from the New Minimum Wage Research,’ Foundations and Trends in Microeconomics 3, no. 1-2, 1-182.
Nivette, Amy E. 2011. ‘Cross-National Predictors of Crime: A Meta-Analysis,’ Homicide Studies 15, no. 2, 103-131.
Noble, Hugh. 2010. ‘The Spirit Level Revisited: Regression Lines, Correlation, Outliers and Multivariate Analysis,’ Equality Trust. Accessible via: https://equalitytrust.org. uk/sites/default/files/hughnobletslrevisited.pdf/.
OECD. 2011. An Overview of Growing Income Inequalities in OECD Countries: Main Findings. Accessible via: https://www.oecd.org/social/soc/49499779.pdf/.
OECD. 2021. ‘Income Inequality’. Accessible via: https://data.oecd.org/inequality/ income-inequality.htm/.
Oishi, Shigehiro, Kesebir Selin, and Ed Diener. ‘Income Inequality and Happiness,’ Psychological Science 22, no. 9, 1095-1100.
Oxfam. 2021. ‘5 Shocking Facts About Extreme Global Inequality and How to Even It Up,’ Oxfam International. Accessible via: https://www.oxfam.org/ en/5-shocking-facts-about-extreme-global-inequality-and-how-even-it/.
Patridge, Mark D. 1997. ‘Is Inequality Harmful for Growth? Comment,’ The American Economic Review 87, no. 5, 1019-1032.
Perry, Mark J. 2013. ‘Quotation of the Day: James Buchanan on the Minimum Wage,’ AEI, January 11. Accessible via: https://www.aei.org/carpe-diem/quotation-of-the-day-james-buchanan-on-the-minimum-wage/.
Persson, Torsten, and Guido Tabellini. 1994. ‘Is Inequality Harmful for Growth?’ The American Economic Review 84, no. 3, 600—621.
Pickett, Kate, and Richard Wilkinson. 2010. The Spirit Level: Why Equality Is Better for Everyone. London: Penguin.
Pickett, Kate E., and Richard G. Wilkinson. 2015. ‘Income Inequality and Health: A Causal Review,’ Social Science & Medicine 128, 316—326.
Piketty, Thomas. 2014. Capital in the Twenty-First Century. London: The Belknap Press of Harvard University Press.
Roberts, Russ. 2017. ‘What Do Economists Actually Know?’ NewCo Shift. Accessible via: https://shift.newco.co/2017/03/02/what-do-economists-actually-know/.
Rodrik, Dani. 2015. Economics Rules: Why Economics Works, When It Fails, and How to Tell the Difference. Oxford: Oxford University Press.
Roser, Max. 2013. ‘Economic Growth,’ OurWorldInData.org. Accessible via: https:// ourworldindata.org/economic-growth/.
Roser, Max.2021.‘What Is Economic Growth? And Why Is ItSoImportant?’ OurWorldIn-Data.org. Accessible via: https://ourworldindata.org/what-is-economic-growth/.
Roser, Max, and Esteban Ortiz-Ospina. 2013. ‘Income Inequality,’ OurWorldInData. org. Accessible via: https://ourworldindata.org/income-inequality/.
Rowlingson, Karen. 2011. ‘Does Income Inequality Cause Health and Social Problems?’ Joseph Rowntree Foundation. Accessible via: https://www.jrf.org.uk/report/ does-income-inequality-cause-health-and-social-problems/.
Rutar, Tibor. 2022. Rational Choice and Democratic Government: A Sociological Approach. London: Routledge.
Saunders, Peter. 2010. ‘Beware False Prophets: Equality, the Good Society and The Spirit Level,’ Policy Exchange. Accessible via: https://policyexchange.org.uk/wp-content/ uploads/2016/09/beware-false-prophets-jul-10.pdf/.
Sokolova, Anna, and Todd Sorensen. 2020. ‘Monopsony in Labor Markets: A Meta-Analysis,’ ILR Review 74, no 1, 27—55.
Stansbury, Anna, and Lawrence Summers. 2020. ‘Declining Worker Power and American Economic Performance,’ Brookings Papers on Economic Activity, March 19. Accessible via.
Subramanian, Subu V., and Ichiro Kawachi. 2004. ‘Income Inequality and Health: What Have We Learned So Far?’ Epidemiologic Reviews 26, no. 1, 78—91.
Teschke, Benno, and Hannes Lacher. 2007. ‘The Changing “Logics” of Capitalist Competition,’ Cambridge Review of International Affairs 20, no. 4, 565—580.
Trent, Carol L. S., and William Alex Pridemore. 2011. ‘A Review of the Cross-National Empirical Literature on Social Structure and Homicide,’ in Marieke C. A. Liem and William Alex Pridemore (eds.), Handbook of European Homicide Research. New York: Springer, 111-136.
Van Zanden, Jan Luiten, Baten, Joerg, Foldvari, Peter, and Bas van Leeuwen. 2014. ‘The Changing Shape of Global Inequality, 1820-2000; Exploring a New Dataset,’ Review of Income and Wealth 60, no. 2, 279-297.
Yu, Zonghuo, and Fei Wang. 2017. ‘Income Inequality and Happiness: An Inverted U-Shaped Curve,’ Frontiers of Psychology 8, 1-6.
Zucman, Gabriel. 2019. ‘Global Wealth Inequality,’ Annual Review of Economics 11, 109-138.