Just as before, when we plotted neuroticism (N) versus extraversion (E) on X–Y axes, plotting any two of the five main dimensions of personality one against the other in such a manner will yield four different quadrants. The sum total of the four quadrants is referred to as a personality style. Which of the four quadrants a person falls into will determine the nature of his or her personality style.
For example, let’s plot Conscientious (C) on the X axis and Openness (O) on the Y axis. For shorthand, we can denote high scores with a positive (+) sign and low scores with a minus (–) sign. Doing so, we get the result shown in Figure 12.1.
By plotting out the five main factors against one another, we arrive at a total of ten different personality styles:
Style of Well Being (N and E)
Style of Defense (N and O)
Style of Interests (E and O)
Style of Anger Control (N and A)
Style of Impulse Control (N and C)
Style of Interactions (E and A)
Style of Activity (E and C)
Style of Attitudes (O and A)
Style of Learning (O and C)
Style of Character (A and C)
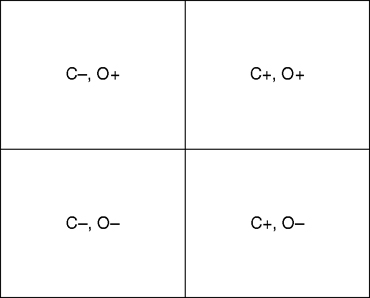
Figure 12.1 Plotting C against O yields four quadrants of a personality style.
Although any two main domains can be plotted, special interest is paid to plotting the most pronounced traits (those traits that deviate most from the mean). For example, if a person is found to be very high in one domain (let’s say A) and very low in another domain (let’s say C) but is average in all the other domains, then clearly these are the two domains we want to plot out on the X–Y axes in order to look at a personality style. It can still be fun and maybe even useful, to look at and meld those scores that are in the “high-average” or “low-average” range, but really we want to start with the outlier domains when interpreting personality styles.
For a full description of the 10 personality styles, please see Appendix B.