Code coverage is a very useful metric that provides objective information on how well project code is tested. It is simply a measurement of how many and which lines of code are executed during the test execution. It is often expressed as a percentage, and 100% coverage means that every line of code was executed during tests.
The most popular code coverage tool is called the coverage, and is freely available on PyPI. Its usage is very simple and consists only of two steps. The first step is to execute the coverage run command in your shell with the path to your script/program that runs all the tests, as follows:
$ coverage run --source . `which py.test` -v
===================== test session starts ====================== platformdarwin -- Python 3.5.1, pytest-2.8.7, py-1.4.31, pluggy-0.3.1 -- /Users/swistakm/.envs/book/bin/python3 cachedir: .cache rootdir: /Users/swistakm/dev/book/chapter10/pytest, inifile:  plugins: capturelog-0.7, codecheckers-0.2, cov-2.2.1, timeout-1.0.0 collected 6 items  primes.py::pyflakes PASSED
primes.py::pep8 PASSED
test_primes.py::pyflakes PASSED
test_primes.py::pep8 PASSED
test_primes.py::test_is_prime_true PASSED
test_primes.py::test_is_prime_false PASSED

========= 6 passed, 1 pytest-warnings in 0.10 seconds ==========
The coverage run also accepts an -m parameter that specifies a runnable module name instead of a program path that may be better for some testing frameworks, as follows:
$ coverage run -m unittest
$ coverage run -m nose
$ coverage run -m pytest
The next step is to generate a human-readable report of your code coverage from results cashed in the .coverage file. The coverage package supports a few output formats, and the simplest one just prints an ASCII table in your Terminal, as follows:
$ coverage report
Name             StmtsMiss  Cover
------------------------------------
primes.py            7      0   100%
test_primes.py      16      0   100%
------------------------------------
TOTAL               23      0   100%
The other useful coverage report format is HTML that can be displayed as follows in your web browser:
$ coverage html
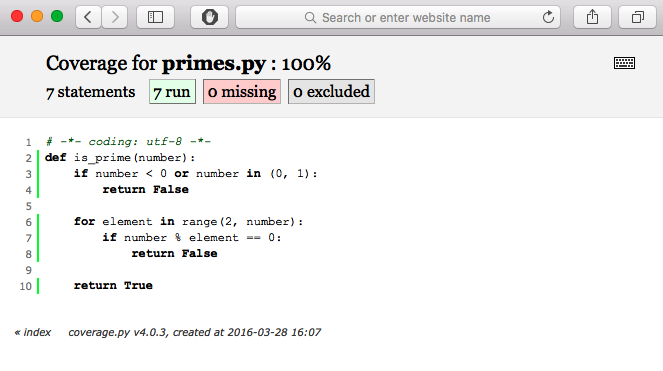
The default output folder of this HTML report is htmlcov/ in your working directory. The real advantage of the coverage html output is that you can browse annotated sources of your project with highlighted parts that have missing test coverage (as shown in the following diagram):
You should know that while you should always strive to ensure 100% test coverage, it is never a guarantee that code is tested perfectly and there is no place where it can break. This means that every line of code was reached during execution but not necessarily every possible condition was tested. In practice, it may be relatively easy to ensure full code coverage, but it is really hard to make sure that every branch of code was reached. This is especially true for the testing of functions that may have multiple combinations of if statements and specific language constructs like list/dict/set comprehensions. You should always care about good test coverage, but should never treat its measurement as the final answer of how good your testing suite is.
In the following sections, we will take a look at other testing techniques and tools that allow you to replace existing third-party dependencies during tests with objects that imitate their behaviors.