2
Food Provenance and Food Fingerprinting: Authentication and Traceability of Foods and Food Products
Is it important to know the origin of the food we eat? This may be a question to which some insist on concrete answers, though for some it may not matter whether the food they eat comes from west, east, north, or south. Generally speaking, there has been an interest in where food comes from, and how it reaches the consumers (knowledge of mechanisms and routes of distribution and supply chains). Some food products are in demand throughout the year, thus necessitating a well‐known supply chain and this requires the knowledge of the origin of such food items be provided. Moreover, with concerns arising from environmental pollution, which directly negatively affects the whole of food safety, the food preference for many consumers is tilting towards organic foods (those that are grown with no application of long‐lasting agrochemicals and fertilizers). All these factors have prompted authorities to introduce rules and regulations to govern the traceability mechanisms of food products, which will give confidence to consumers about the authenticity, quality, integrity, safety, and provenance of the food products of interest. At this juncture, there is a need to define the term “origin” as far as food provenance is concerned. The origin of the food’s location refers to the geographical location where the food in question is either produced/obtained/found. In cases where the same food product is found in more than one geographical location, then the location where the last substantial transformation is recorded will be considered to be its geographical location of origin for that particular food product.
Introduction
In the modern day, consumers of various foodstuffs and food products demand to be provided with clear, accurate, precise, and succinct information and data about the origin and specification of the food products they consume. Authorities have put in force strict regulations that such information be outlined in the labels and labeling, which should adhere to the rules and regulations set by describing properly the geographical origin and authenticity of all that is claimed in terms of quality and composition on the packaging labels. The rules, guidelines, and regulations that have been set speak volumes about the legality of the whole issue about food provenance and fingerprinting, with laws being enacted to prosecute the culprits, offenders, and transgressors.
Food Fraudulence and Adulteration
Food fraudulence refers to deliberate and intentional actions and tendencies to illegally tamper by substituting, adding, or mislabeling of foodstuffs, food ingredients, or even food packaging for whatever gain (Elliot, 2013). Food fraudulence involves all practices that lead to an intentional or pre‐meditated addition or substitution of an ingredient in order to either raise its value or lower production/processing costs (Shears, 2010 ; Spink, 2013). Practices such as dilution of food products to levels that reduce their nutritive value or to an extent that risks the health of consumers and/or masking the effects of dilution by adding other inferior substances or replacing quality ingredients with either weaker/inert ones, false branding/misbranding or mislabeling, etc., are all part of food fraudulence (Ellefson et al., 2013 ; Elliot, 2013). This term “food fraudulence” also encompasses other tendencies, such as giving false, inaccurate, or misleading information or statements regarding a particular food product (Ellefson et al., 2013). In the context of this topic, food fraudulence will not deal with other forms of food fraudulency tendencies such as those that deal with economically motivated kinds of fraudulency, misbranding, smuggling, tax evasion, and food counterfeiting practices. This topic will only deal with intentional food fraudulency tendencies with motivations that affect food quality and food safety, which endangers the health of consumers.
For any food product to be considered fraudulent or adulterated it must contain the following:
- any substance or ingredient, or an added ingredient, that may cause a health hazard to consumers;
- an ingredient or component (added externally or internally) that is regarded as spoiled/decomposed, regardless of whether this ingredient was formed during processing, handling, or storage, or it came from a disease that has affected the plant or animal from which the food originated, from the container/packaging, or stores where the foodstuff was kept/stored;
- does not contain any valuable component whether omitted, damaged, concealed, abstracted, or present in an inferior form;
- harmful ingredients such as additives (coloring agents, flavor enhancers, etc.);
- wrong measure of fill (volume, mass/weight, bulkiness) or strength (e.g. color intensity, flavor sharpness, etc.);
- does not contain proper information, such as food items sold under a different identity (origin, type of food, etc.) and foods imitating others or foods with wrong definitions.
However, caution should always be taken when defining the cause of the incidences in food fraudulence cases. In the scenario where it is proved beyond reasonable doubt that there has been an unintentional and deliberate action of food contamination or adulteration through either improper food handling, or during processing, or spoilage by microorganisms or addition of ingredients that will poison the food products, all these will constitute what is termed as issues related to food safety. The situation will only be regarded as food fraudulence when it has been proven that there has been an intentional cause for the presence of adulteration in the food for whatever reason, especially the economic gain.
The common aspect between the two terms is that both food fraudulence and food safety result in health risks to consumers. When there has been an incidence of either food fraudulence or food safety endangering consumers’ health, efforts are normally invested to address (prevent or reverse) the effects of intentional or deliberate adulteration that was caused for whatever motive, and this is defined as food defense. On the same note, cases that involve unintentional food adulterations (food spoilage or deterioration), which result in economic losses for the individuals or industry, constitute what can be termed as food quality issues. Food quality can be caused by various physical and chemical properties of the food. Now the efforts to prevent or measures put forward as intervention or responses to address food quality phenomena are known as food protection.
Bearing in mind the consequences of all these phenomena, authorities normally devise strategies and plans to prevent food adulteration incidences well before they take place. Among the strategies that are put in place are the enforcement of effective programs of risk‐based intervention strategies well in advance and also the institution of rapid reaction measures to address effects that can be caused by food fraudulence once it is discovered. For convenience, food fraudulence can generally be categorized into a number of groupings as follows:
- counterfeiting: in which case the perpetrators infringe the legal owners’ Intellectual Property, and produce a similar food product and package using similar packaging and without adhering to the standards;
- simulation: is another food fraudulence category that is similar to counterfeiting, where the design and formulation of simulated food products gives them a similar look of the real food product, but in reality it is similar and may have slightly different formulas or ratios of ingredients, and in most cases the simulated food products fail the compliance test in terms of quality assurance;
- adulteration: also a food fraudulence category that involves the addition of a foreign ingredient to a finished food product, for example adding brine to frozen meat and products, or adding melamine in milk;
- tampering: another category of food fraudulence that involves misusing either legitimate food products or food packaging, e.g. by changing the information, such as expiry period.
Currently, there is an ongoing fight against food fraudulence that is ever growing and expanding, covering almost all parts of the world. There is a widespread tendency of adulterations where foods, foodstuffs, food additives, and food supplements have been found to be contaminated or without the expected quality or labeling. The results of food adulteration cost the food industry greatly and affect consumers both health‐wise and economically. The sources of adulteration may be traced from the geographical identity of the place of origin of that particular food product, the brand name and method of food processing, or even the time it has been stored. Food fraudulence is currently attracting the interest of many stakeholders, both in private as well as public sectors, as an emerging risk that is threatening society. This is partly due to the complex nature, trends, and principles that govern distribution and global food supply chains. Unscrupulous food manufacturers and distributors entertain the practice of tampering with the ingredients of foodstuffs by cutting down levels or replacing altogether some of the ingredients in order to maximize profit (Elliot, 2013). The availability of numerous reports and publications suggests that there are major and serious food adulteration and contamination practices occurring, frequently and regularly (Ellefson et al., 2013).
For example, according to an article that appeared in the Washington Post on Tuesday, 30 March 2010; A01, which was entitled “FDA pressured to combat rising ‘food fraud’” by Lyndsey Layton, Washington Post Staff Writer, reports on fraudulence involving sheep’s milk cheese that was later discovered to be cow’s milk; another case was sturgeon caviar that was later proved to be Mississippi paddlefish (source: http://phe.rockefeller.edu/news/wp‐content/uploads/2010/04/FDA‐pressured‐to‐combat‐rising‐food‐fraud.pdf; accessed 11 September 2014). This article also pointed to instances where some honey‐makers tended to dilute honey products with either sugar beet or corn syrup. Other instances involved the sale of frozen catfish fillets claiming to be other brands such as red snapper, etc. but they were actually from Vietnam (source: http://phe.rockefeller.edu/news/wp‐content/uploads/2010/04/FDA‐pressured‐to‐combat‐rising‐food‐fraud.pdf; accessed 11 September 2014).
In general, deception in the food industry has been around for a long time, although the extent of its impact on consumers’ health or the economic sector is difficult to ascertain. There are contributing factors such as the current trend toward urban migration, as well as globalization that play a role in its widespread increase, both in terms of magnitude and extent (Ellefson et al., 2013). These factors (urbanization and globalization) encourage a special trend of food supply chain to sustain the huge population concentrated in urban centres. To control such a complex food supply chain in the current global economy with limited resources, creates room for criminals to practice unscrupulous business deals with food products. As time goes by, they come up with new ways of practicing fraudulence, which creates more challenges to deal with the problem.
Scientific Methods and Strategies for Verification of Food Fraudulence Cases
There are a variety of profiling methods that generate useful data (those chemical signals obtained from analytical instruments that can be de‐convoluted to give the composition of food), as well as many other chemical and biochemical techniques that are available to food forensic scientists, to ascertain any of the already mentioned food fraudulence cases. The advantage of profiling methods is that they can be applicable to complex samples such as foods and are also capable of performing a wide range of scientific measurements simultaneously. Among the chemical and biochemical techniques that are used to verify food adulterations or fraudulence are chromatography (e.g. liquid chromatography (LC), gas chromatography (GC), etc.); mass spectrometry (MS); nuclear magnetic resonance (NMR); infrared spectroscopy (IR); enzyme‐linked immunosorbent assays (ELISA); and polymerase chain reaction (PCR), etc.) (Pomeranz and Meloan, 1994). Data from these techniques can further be subjected to statistical analyses, using multivariate techniques such as partial least square (PLS) or principal component analysis (PCA), to provide more in‐depth information and variability of parameters that can reveal abnormal trends of behavior or lack of consistency.
Scientific Verification of Geographical Indications and Designation of Origin of Foods
There are three main types of geographical description or schemes for foods that play a significant role to protect the identity and names of foods, as well as other agricultural products. There is a scheme known as “Protected Designation of Origin” (PDO), which applies to those foodstuffs and food products originating/produced and/or prepared/processed in a particular geographical location using acceptable/known and standardized methods and techniques (Gonzalez et al., 2009).
The second type of scheme or geographical description of foods is known as a “Protected Geographical Indication” (PGI), which signifies that there is a connection with the geographical location or area in at least one step of either production, preparation, or processing of a particular foodstuff (Gonzalez et al., 2009). This second description of the geographical description (PGI) seems to be of more importance than PDO, due to the fact that it associates the food with a particular geographical location.
The third scheme is known as “Traditional Speciality Guaranteed” (TSG), which reveals the traditional nature or character in terms of either ingredients (composition) or the procedures followed during production.
Processes, Steps and Procedures to Distinguish the Geographical Origin of Foods
The identification of the origin of foods or the effects of different food production processes is not straightforward. The process must involve the identification of specific markers that distinguish food products, in order to ensure that there is no possibility of having either a false negative or a false positive. There must also be in‐depth scientific knowledge of the chemical composition of foods, effects, or contribution of environmental factors (biological and physico‐chemical factors), and other important differences between the target food items of interest to other similar food products found in other geographical locations. This calls upon the presence of analytical chemists who will establish procedures of correct identification of the exact discrepancy that defines the fraudulence in question (fraudulent food product and the type of fraudulence).
Analytical chemists will need to play an important role in developing appropriate methods that will reveal the exact chemical composition, as well as isotopic abundances of the elemental composition of that particular food product or other specific chemicals/molecules, spices, or flavors that may form part of the composition of the food products in question. Analytical chemists will also need to develop methods and strategies to identify products that may be formed during food processing or production, thus fingerprinting products by using appropriate analytical and bio‐analytical techniques, including chromatography, spectroscopy, or mass spectrometry. Measurements of this kind of work require large sample sizes, as well as the application of statistics for validation, otherwise the results may not be considered authentic enough.
Geographical Identification, Quality Verification and Authentication of the Origin for Fruit Nectars, Fruit Juices, Vegetable Juices, and Non‐alcoholic Beverages
The term “fruit juice” refers to a liquid derived from a fruit, while “fruit nectar” refers to an unfermented food product obtained by adding water to a fermentable food product. Generally, fruit nectars may contain additives such as sweeteners or honey. On the other hand, the general term “non‐alcoholic beverages” includes products such as soft drinks, energy drinks, bottled water, carbonated drinks, and sports and isotonic drinks. Fruit juices, vegetable juices, fruit nectars, and other non‐alcoholic beverages are normally verified on the basis of the composition of the additives incorporated for the purposes of adding or enhancing color and those that are added as flavoring or flavor enhancers. Also, these food products are verified on the basis of water content that forms part of the naturally derived fruit juice. Generally, for nectars and juices prepared from fruit, there are regulatory standard requirements that are supposed to be adhered to before the certification of the product for commercialization (sale). These include the requirement that they should possess and retain the same characteristic qualities of aroma (flavor and flavor sharpness), as well as the appearance (color and color intensity) to that of the fruit from which the product (fruit or nectar) was processed.
Another decisive factor that is crucial in the authentication or identification of the origin of fruit juices, vegetable juices, and nectars, is the measure of the main quality parameters that are normally required to be displayed on the label (showing composition). Verification of the measure of various ingredients in the fruits juices, vegetable juices, and nectar as claimed in the labeling, is always mandatory in order to prove compliance with the regulations. For instance, with some adulterations involving fruit juice blending, where a high‐quality juice can be blended with an inferior one (adulteration for economic gain), the information as well as the measure and quality of ingredients as it may appear on the labels may be different from the actual chemistry of the juice.
The problem of food adulteration related to juices and nectars has prompted the need for the development of analytical methods, techniques, and regimes to analyze and verify the identity and authenticity of fruit juices and fruit nectars.
The development of analytical procedures for this purpose has been faced with challenges due to the complex nature of these food products, as well as the variability of fruit juices and nectars in terms of their composition. Another challenging consideration comes from the fact that the analysis requires skilled personnel as well as advanced analytical instruments. For fruit/vegetable juices and fruit nectar, the detection of identity, adulteration, and authenticity involve the detection of mainly the types and ratios of organic acids, amino acids, sugars, or other sweeteners, antioxidants such as polyphenols and flavonoids, as well as inorganic elements, and these compounds can thus be used as indicators of adulteration.
For example, one of the nutritive compositions in fruit is sugars, which is one of the components that actually impart to the fruit and juices the characteristic taste, aroma, and flavor. Sugars also play other roles, including the role of an indicator of the conditions for storage. The abundances and ratios of these sugars is characteristic to fruits, such that if there is any significant difference, then the situation will represent a possible scenario of adulteration. This is because any attempt to add either a sweetener, syrup, sugar, water, or an inferior type of juice blend, will alter the ratios of various sugars and their abundances, thus confirming a fraud scenario. Sucrose (glucose and fructose), as well as sorbitol (a sugar alcohol), are the main types of sugars that are normally analyzed to confirm a fraud situation for fruit juices, vegetable juices, and nectars. The abundance and ratios of these sugars are qualitatively and quantitatively different for different types of fruit or vegetable juices and are dependent on a number of factors such as species, variety, geographical location where the fruits are grown (environment), and the maturation level of the fruit at the time of harvest. For example, pineapples, grapes, oranges, and apples from the same geographical location and maturation will have different profiles and ratios of sucrose, glucose, and fructose. Normally, glucose and fructose are found in higher levels in grapes and at the same time, sucrose in grapes is generally lower. The situation is the opposite in the case of apples, pineapples, and oranges. Sorbitol is generally lower in many fruits and fruit juices and where needed can only be added, in which case it has to be within the regulations and guidelines or else this will constitute an act of adulteration.
Sugars are the building molecules of carbohydrates and thus when analyzing sugars, methods used for carbohydrate analyses are normally applicable for sugars as well. The most common method involves the use of a high performance anion exchange chromatographic system equipped with a pulsed amperometric detector (HPAEC‐PAD). Where necessary, this can further be confirmed by the use of stable isotope methods to ascertain the results for authenticity and identification of adulteration. This type of chromatography is normally preferred for the separation of anionic species, which can either be anions in their natural form or those that can be ionized at high pH values, for example sugars and carbohydrate. Where species that ionize at high pH are analyzed using HPAEC, the mobile phase for such kinds of species will constitute mainly hydroxide‐based eluent solutions, because they are capable of producing anions from these analytes (e.g. sugars), which can form charges in neutral pH environments. The stationary phases (column packing materials) for HPAEC are normally prepared from non‐porous resins, in which microbeads with anion‐exchange moieties are attached to cation exchange resin particles to impart stability at all pH values. Moreover, the preference of non‐porous polymeric resins as stationary phases for HPAEC comes from the fact that they minimize band broadening in chromatograms, thus highly improving the separation of analytes.
After separation, they can be detected without the need for derivatization using a pulsed amperometric detector (PAD) in which various (specific) electrochemical potentials are applied to a working electrode for a period of time, causing oxidation‐reduction processes of the sugar’s hydroxyl groups at the surface of the working electrode. The redox processes at the electrode surface will cause losses in protons, which will result in currents being generated and the resulting current will be proportional to the magnitude of the hydroxyl groups of the sugar samples.
Stable Isotope Ratio Analysis (SIRA) of Sugars in Fruit Juices and Fruit Nectars: Isotope Signature
By definition, stable isotopes are the non‐radioactive atoms, with nuclei having the same number of protons but a different number of neutrons. Chemically, isotopes behave like other major elements such as carbon, hydrogen, oxygen, nitrogen, and sulfur, although there are some differences in terms of certain physico‐chemical properties that can be explained from the measure or magnitude of their mass differences. It is these differences that are exploited to enable the separation of isotopes from the major elements during many physical processes or during the course of a variety of chemical reactions (Cui et al., 2011 ; Lin and Ke, 1995). In the process of separating isotopes from other major elements, there are two main isotopic effects that are generally encountered, which include:
- the equilibrium fractionation that takes place during the isotopic exchange reactions, which triggers the conversion of a liquid phase into the gaseous phase;
- the second isotopic effect is termed the kinetic fractionation and involves unidirectional reactions characterized by reaction rates that are sensitive to certain positions of the masses of atoms of one of the reactants. Isotopic effects can be quantified (have got magnitudes) as well as the standard unit known as delta (δ), which can be expressed in terms of discrimination magnitude values (defining the deviation of a fractional factor, Δ, from unity) expressed as capital delta (Δ), defined by Equation 2.1:
The mathematical equation that expresses the isotopic composition (δ), which is defined as the isotope ratio measured against a certified standard, is given by Equation 2.2:
where δX = isotope ratio expressed in delta units as measured against a certified standard; Rsam = absolute isotope ratios of the sample being analyzed; and Rstd = absolute isotope ratios of the certified standard.
As defined previously, a stable isotope means that the isotope is non‐radioactive. Examples of the stable isotopes include those of carbon, hydrogen, nitrogen, sulfur, and oxygen. The use of isotopic analysis to ascertain the authenticity, identification of geographical origin, or the detection of adulterations is attractive, because it provides a marker isotopic identity that reveals the profile and distribution of certain stable isotopes and chemical elements in the given food product sample (e.g. sugars, juices, etc.).
The justification for the use of isotopes in foods of both plant and animal origin comes from the fact that there is a strong correlation between the isotopes present/found in plants as reflected in their various sources (air: CO2, NO2, NH4, SO2, etc.), soils, and water (H2O) to the processes that control the plants’ assimilation of the same elements as well as to the environment where the plants are growing. Considering plants as examples, the fraction patterns of carbon dioxide diffusion (CO2) is what actually governs the content and fraction of the carbon‐13 ratio absorption in the plants in that particular geographical location. The geochemistry of groundwater at specific geographical locations plays an important role in dictating the composition, abundance, and ratio of oxygen isotopes. How rich the soil is, in terms of nutrients (N and P), may determine and govern the availability and fraction ratio of nitrogen or phosphorus isotopes. The occurrence of natural disasters and phenomena such as volcanic eruptions, or anthropogenic activities such as the use of fertilizers in agriculture, contribute to the profiles of sulfur isotopes. Also, the age of the underlying geological structure and rocks of a particular location have an influence on the ratio of strontium‐87 and strontium‐86 isotopes. For example, if the ratio of strontium‐87 to strontium‐86 is less than 0.706, then the geology of that location is characterized by young basalt rocks and the plants growing in this particular location will have the same ratio of strontium isotopes. The geographical location characterized by old crystalline rocks will have the isotopic ratio of strontium‐87 to strontium‐86 greater than 0.701 (Brereton, 2013).
Generally, the isotopic trends in various geographical locations will have an influence on the vegetation and thus be reflected in the chemical composition of the flora and fauna of that particular location. This will therefore enable the fingerprinting and geographical identification of the food product’s origin.
On the other hand, the trend and profile of trace element composition from a particular geographical location is normally characteristic and specific to that area and therefore can also be used for fingerprinting and geographical identification of origin for various species. To sum up, we can say that a combination of the profiles for element composition and multi‐element stable isotope analysis may offer a stronger and more reliable approach for the determination of the geographical origin of food products.
There are a number of analytical instruments that are normally used for the measurement of stable isotopes, and these include the isotope ratio mass spectrometry (IRMS), which gives a measure of variations in isotopic ratios after isotopic fractionation, as well as Fourier transform infrared spectrometry (FTIR), which is mainly used for the measurement of deuterium. The IRMS uses differences in terms of the charge‐to‐mass ratio to separate the various isotopes of elements that have been fractionated. The isotope ratio of the same elements differ from place to place, because the ratios of isotopes are affected by various factors such as weather patterns, humidity, altitude, latitude, vegetation, topography, etc. For example, in geographical locations that experience low levels of humidity, the 18O isotope is also low as most of it is lost through precipitation phenomena and this affects the water composition fraction that gets into the plants and animals in the same magnitude, while 16O evaporates and adds to the atmospheric oxygen. The variability of isotopic ratios will also be reflected in the plants through to the fruits and the juice or nectar that is made from them. The analysis of stable isotopes will therefore verify the geographical origin from where the food product (fruits or vegetables) used to make juice came from. It will also reveal whether there is an unusual isotopic ratio, which can be an indication of adulteration.
Stable Isotope Ratio Analysis (SIRA) and Multi‐element Stable Isotope Analysis Techniques
As already pointed out, stable isotopes have become attractive in the process of identifying the origin of food products. The reasons behind this approach come from the fact that there is a systematic variation in terms of the distribution of stable isotopes globally. There is a relationship between the variation of stable carbon and hydrogen isotopes as observed with the photosynthetic mechanisms in plants, as well as the pattern and trend of the application of agrochemicals (particularly chemical fertilizers). These factors play a crucial role in shaping the uniqueness in terms of the distribution pattern and profile of stable isotopes in various geographical locations. In addition to this, climatic and environmental factors add to the uniqueness of the profile and pattern distribution of stable isotopes, making them unique for a particular region/location, thus making it possible to create isotopic landscapes known as isoscapes.
For this reason, stable isotopes can be used reliably to provide accurate information about the geographical origin of food products, detection of adulteration of food products, and identification of the difference between organic and conventional farming approaches (Kelly, 2003 ; Kelly and Bateman, 2009 ; Maggi et al., 2011). The isotopes that are widely or commonly used include carbon‐13 (13C), nitrogen‐15 (15N), sulfur‐34 (34S), deuterium (2H), and oxygen‐18 (18O).
For both plant‐based and animal‐derived food products, stable isotope ratios and their abundances has been a useful tool in quality assurance, as well as verification of geographical origin of food products. The water chemistry of a particular geographical location is known to be characteristic to that specific area and tends to influence the ratio of oxygen‐16 to oxygen‐18 isotopes (16O/18O), as well as of that of hydrogen to deuterium (1H/2H or H/D) (Maggi et al, 2011). On the other hand, the geology, soil chemistry, and the feed are also known to characterize the pattern of isotope ratios of a particular geographical location of carbon‐13 to that of carbon‐12 (12C/13C), strontium‐86 to that of strontium‐87 (86Sr/87Sr), sulfur‐32 to that of sulfur‐34 (32S/34S), and nitrogen‐14 to that of nitrogen‐15 (14N/15N) (Kelly and Bateman, 2009).
The sample preparation for the analyses, which involves 13C and 15N isotopes, normally requires the samples (usually placed in clean tin sample holders) to be converted to high purity CO2 gas and N2 gas respectively before their introduction to the gas chromatograph (GC) coupled to isotope ratio mass spectrometer (GC‐IRMS) (Kelly, 2003). The high purity gas products are then treated at high temperatures in an environment rich in oxygen (excess O2), and then an inert gas (helium preferably) is used to purge the combusted gas into combustion catalysts (normally oxides of chromium and copper wire) to affect the oxidation of other unwanted combustion by‐products such as sulfur and halogen derivatives. The combustion process results in a number of gases such as carbon dioxide, oxides of nitrogen, and water vapour, and these are catalytically reduced at a high temperature in a process that eliminates oxygen and also reduces oxides of nitrogen to nitrogen gas. Water and carbon dioxide are normally removed from the reaction system using magnesium perchlorate and other selective carbon adsorbents. In order to quantify and qualify the gases of interest, nitrogen and carbon dioxide, separation and detection using a gas chromatograph coupled to IRMS is normally employed. The qualifier ions for carbon dioxide are m/z = 44, 45, and 46, while those for nitrogen are m/z = 28, 29, and 30 (Maggi et al., 2011).
The analyses that involve 34S isotopes, like those for 13C and 15N, require a sample preparation step that produces a high‐purity sulfur dioxide (SO2) before introducing the sample to GC‐IRMS. In this analysis, the sample of interest is also placed into clean crucibles/sample holders made of tin and then subjected to high temperatures in a furnace, and the combustion is allowed to proceed in an environment rich in oxygen. The combustion gaseous products are then passed (using an inert helium gas) to the oxides of tungsten and zirconium oxide combustion catalysts and then they are subjected to the reduction process using copper wires. Water in the reaction mixture can be filtered through a water selective Nafion membrane, which allows only water to pass through and the SO2 is separated and quantified using a gas chromatograph coupled to IRMS (GC‐IRMS), where the qualifier ions monitored are m/z = 64, 65, and 66 (Kelly and Bateman, 2009).
For the deuterium (2H) and 18O isotope analyses, samples of interest have to be converted to high‐purity hydrogen (H2) and carbon monoxide (CO) gases respectively, before analysis using GC‐IRMS. The samples are normally placed into clean sample holder/crucibles/capsules made of silver and then subjected to high temperatures in a furnace in which glassy carbon is also introduced in order to convert them into H2 and CO gases. The resultant water product is removed using magnesium perchlorate, while CO2 is removed using CO2 selective adsorbents. The pure H2 and CO2 are then analyzed using GC‐IRMS. The qualifier masses for H2 are m/z = 2 and 3, while those of CO2 are m/z = 28, 29, and 30 (Kelly and Bateman, 2009).
For geographical identification (GI), the mean ratios values, such as Δ2H‰, Δ18O‰, etc. are correlated to the values of the same isotopes found at the latitude of production regions, as well as the parallel relationship to the Meteoric Water Line.
Multi‐element Pattern Analysis: Targeted Analysis Methods for Food Provenance: Examples for Honey, Fish, and Meat Products
Where the analyte to be analyzed is predefined and known prior to the analytical work, the method is termed as targeted analysis. There are a number of analytical instrumentations that may be involved in targeted analysis, such as hyphenated techniques involving chromatography and mass spectrometry (e.g. GC‐MS, GC‐MS/MS; LC‐MS, LC‐MS/MS, etc.) and also others such as nuclear magnetic resonance (NMR). Both the test and certified authentic/genuine samples are analyzed and the results compared and where there is any suspected case for non‐authenticity or adulteration, it will be revealed by the data from comparison of the two samples (test sample vs. certified sample). For example, in meat industries, there are several ways of binding off‐cuts and minced meat, as well as trimmings into meat products with features like that of steak meat. In this process, binders (glues) may be obtained from either blood or other neutral binding agents that have been proved not to impart any foreign color or odor characteristics to the processed meat product. In the case where blood is used as a binding agent, the blood preferred is normally bovine or porcine, such that the fibrin protein (from blood plasma) together with thrombin (enzyme responsible for blood clotting) are mixed with the meat for binding. However, the process is sometimes adulterated by blending undeclared products from different animals in the manufacture of meat products. A similar scenario also occurs in the processing of fish products. This type of fraud may in a large part be intended for economic gain as the binders are normally permitted by law as part of the food additives.
A tandem LC‐MS/MS is a tool that may be used to detect such kinds of fraudulence cases. In the analyses, the target samples will be the plasma samples from bovine as well as porcine (Grundy et al., 2013). The analysis is based on the fact that fibrin proteins from different animal species differ in terms of the mass spectral characteristics and this will be evident from the fragmentation pattern obtained using LC‐MS/MS for different species. However, proteomics‐based LC‐MS/MS methods, though useful in the identification of unique proteins preset in food products, may not be suitable as methods for the authenticity test, but are more suitable for highly processed meat where DNA fragments have already been denatured by the process. These methods are thus suitable for the forensic identification of both undeclared and declared components incorporated into food products.
Another sensitive and reliable method for the detection of meat adulteration is the real‐time chain polymerase reaction (RT‐PCR). This is a DNA‐based biochemical technique that analyses DNA fragments extracted from meat samples such as trimmings, cut‐offs, or lasagne (Chisholm et al., 2005). This technique can tell with certainty whether there is contamination of meat (e.g. beef) with horse meat, pork, etc. Alternatively, this test is also used to detect adulteration from the incorporation of banned substances in meat, such as hormonal substances or anti‐inflammatory agents such as phenylbutazone. RT‐PCR techniques can be useful in detecting possible undeclared genetically modified foods or other undeclared mixed food products such as mixed rice (e.g. high‐quality rice mixed with low‐quality rice) (Fumiere et al., 2013), mixed milk (buffalo milk mixed with cow’s milk) (López‐Calleja et al., 2004), and meat that came from some specific breeds (Conyers et al., 2012).
In PCR‐based methods, a specific sequence of the DNA fragment of interest is amplified and then copied for analysis using a variety of methods such as those based on electrophoretic principles. Species specific based PCR methods are useful in the verification of food products, due to the fact that the specific DNA sequences/fragments that are targeted are specific to that particular species and can easily be detected and identified, even where the food product is contained in a mixed heterogeneous pool of other DNA fragments from various other species. Moreover, PCR methods may also be useful in providing DNA signatures that can be identified in the DNA profile of different plant species where animals graze off the forage fed to other animals or of microbial populations colonizing a particular location (environment). The microbial population in milk for example can be fingerprinted using PCR‐based methods.
However, PCR‐based methods sometimes suffer from the effects of PCR inhibitors that may be present/added into food products, because the PCR inhibitors tend to suppress the amplification of the target DNA. In some cases, the food processing protocols may result in highly degraded DNA material, making it difficult to amplify and analyze. In these cases, extensive dilution may be desirable in order to minimize or eliminate the effects of PCR inhibitors. The dilution may be applied in cases where there is a large DNA sample size or otherwise very sensitive detection methods have to be employed.
Other methods with potential application in the determination of animal proteins for the purpose of geographical identification of the origin of the species include immunological‐based techniques such as the enzyme linked immunosorbent assay (ELISA) (Reaney and Bremer, 2013); classical microscopy based methods (van Raamsdonk et al., 2013); as well as near infrared microscopy (NIR) (Fernandez et al., 2013). The ELISA is based on the specificity of the antibody antigen reactions. The preference will be to use a combination of all these methods and techniques in order to obtain in‐depth information about the sample and more convincing evidence (Bremer et al., 2013). Otherwise, another approach, the gelatine method has been considered as confirmatory for establishing provenance of meat (especially skin and bone parts of the animal) from the feeds consumed by the animals.
Non‐targeted Metabolomic Methods for the Determination of Maturation, Expiry, and Shelf Life of Meat Products
In the meat industry, the quality of meat can be enhanced by allowing the meat and meat products to mature, a process that may imply maintaining the ageing process of meat at a particular set of temperatures, for a longer period of time. This creates room for deception, where labeling may fraudulently and intentionally indicate false claims about the ageing or expiry date of that meat product. Therefore, metabolomics methods have been developed and optimized to test and verify the information given in the labeling regarding the ageing of meat and the conditions at which the aging process was carried out. To do this, a non‐targeted analysis of the test samples is normally conducted using techniques such as 1H‐NMR to establish a profile of metabolites such as amino acids (leucine, phenylalanine, alanine), as well as others such as nicotinamide or nicotinic acid, which normally vary depending on the meat maturity and the physical conditions (e.g. temperature) to which the meat was subjected. The same approach can be suitable for the verification of the expiry date of meat products.
Apart from meat and fish, different types of honey are the other food product that can easily be adulterated. For example, the composition of chestnut honey contains kynurenic acid as a unique and characteristic compound of this product (Donarski et al., 2010). There are unique and characteristic compounds in the composition of honey, which include dihydroxyacetone and methylglyoxal. Different types of honey products are known to have antimicrobial as well as biocidal activity. Fraudulence in the honey industry may be caused by some unscrupulous tendencies to enhance the levels of beneficial components such as methylglyoxal by various means including heating. However, heating also generates other compounds such as hydroxymethylfurfural (HMF), which are unwanted, and the authorities have set threshold values of 40 mg/kg for HMF in unheated honey. Monitoring of compliance to the standards and authenticity can be performed using a number of techniques, including nuclear magnetic resonance (NMR) and high performance liquid chromatography coupled to infrared spectroscopy (HPLC‐IR).
Methods for Dairy Products Authentication
Physico‐chemical Property Measurements and Chemometrics
There are a number of authenticity tests that may be carried out for dairy‐related products such as milk and cheese. Some of these are simple and straightforward and can be done essentially in any laboratory. Physico‐chemical methods in the detection of dairy products such as cheese, milk, etc. involve the measurements of parameters such as total and soluble nitrogen, pH, moisture, salt content, etc. The limitations of this approach can be described by the fact that the analysis involves the measurements of general parameters that result in broad, bulky, and general observations, making it difficult if not impossible for fingerprinting. However, when this analytical approach is done in conjunction with chemometric multivariate statistical techniques, it becomes possible to classify or discriminate the authenticity of dairy products.
Chromatography, Mass Spectrometry and Chemometrics
Chromatographic methods, such as high performance liquid chromatography (HPLC) and gas chromatography (GC), utilizing their traditional detectors such as fluorescence, diode array (for HPLC), and flame ionization detector (GC), have been useful in the determination of dairy products authentication. Both HPLC and GC can also be coupled to a mass spectrometer to strengthen the quality of results obtained, because the use of mass spectrometry can result in unique and characteristic fragmentation patterns for the fingerprinting of the specific components in the dairy products, thus confirming the authenticity. In addition, chemometric tools such as principal component analysis (PCA) and hierarchical cluster analysis (HCA), strengthen further the validation of the discrimination of samples.
The HPLC analysis of dairy products (e.g. cheese, raw milk, and pasteurized milk) normally involves the process of proteolysis in order to break down the proteins into simpler components and amino acids. This process is then followed by the ethanolic extraction of the proteolysis components before the separation and the detection of both the ethanol‐soluble and ethanol‐insoluble extracts using HPLC coupled to an appropriate detector, including the mass spectrometer. HPLC analysis also involves the detection of amino acids to evaluate the proteolysis process and also because the measure of amino acids determines the ageing of the dairy products. The HPLC method together with chemometric tools offers the possibility to discriminate dairy products based on ripening stages and how the dairy products have been treated.
The shortcomings of the HPLC method for complex samples such as those of dairy products come from the fact that it certainly requires stringent and extensive sample preparation steps to get rid of hydrophobic undesirable components of the matrix, making the procedure laborious and time‐consuming. Moreover, the interpretation of the amino acid profiles from the results obtained from the HPLC analysis is complex and requires a competent chromatographer to understand them. Therefore, incorporation of statistical multivariate tools to discriminate the observations is always crucial.
Another chromatographic method that can be useful for the authentication of dairy products is head space gas chromatography that can also be coupled to a mass spectrometer. This technique is mostly applicable to the volatile fraction of the samples, and as far as dairy products are concerned, terpenes are the components of interest, which are volatile enough to be suitable for GC analysis. The profiles of terpenes can differentiate between the grazing and non‐grazing feeding system of the animals from which the milk was obtained. This is because the composition of plants used for feeding the animals (cows) has a significant influence on the profiles and composition of terpenes, which will then be reflected in the milk and other milk‐derived dairy products such as cheese. Thus, the profiles of terpenes can be a useful tool for the fingerprinting of dairy products.
Advanced Spectroscopic Methods: Vibrational Spectroscopy
Many food products contain components that can interact with the electromagnetic radiation (EMR) and display unique and characteristic spectral data to reveal important information about the functional groups and molecular bonds present in the food products. Therefore, the use of spectroscopic techniques for fingerprinting of food products has become attractive, particularly because these methods do not need stringent sample preparation steps. Spectroscopic methods are also known to be non‐destructive and capable of recording data from even small/tiny particles (nano‐gram to pico‐gram ranges). These attributes are essential in the food forensic analyses for authenticity and verification purposes.
Among the spectroscopic techniques that are generally used in the analysis of food products are ultra violet‐visible (UV‐Vis) spectroscopy, fluorescence spectroscopy, tetrahertz spectroscopy (THz), infrared (IR) spectroscopy, Raman spectroscopy, Mössbauer spectroscopy, and nuclear magnetic resonance (NMR). Spectroscopic methods are based on interactions between electromagnetic radiation (EMR) and sample to generate scientific information (data) about the components of a particular food product. The information or data obtained from spectroscopic studies are mainly about the functional groups, molecular composition, the types of chemical bonds present, structure, etc.
There are 17 regions/bands in the EMR spectrum where matter can interact with light to give a display of different types of spectral patterns and behavior (Belton, 1997). Some of the EMR regions, for instance the very high frequency band of gamma rays and hard X‐rays that are capable of exciting the nuclear transitions, may not be of importance in food analysis, as the transitions result in very little information about the chemical environments of the sample. However, these bands can be used to reveal information regarding nuclear states of the atoms in the food sample and can thus be suitable for elemental analysis. The lower frequency soft X‐rays and high frequency ultraviolet radiation can be used to excite transitions of the cores of the electrons when they are directed toward the sample (food product). However, these bands are also insensitive to the chemical environment of the food product (sample), resulting in information mainly about elemental composition and thus not of much help in verification or authentication of food products. On the other hand, the lower energy ultraviolet radiation is known to be sensitive to the chemical environment and may thus be of use in the analysis of food products (Belton, 1997). The sensitivity of lower UV radiation to the chemical environment of the samples may be attributed to the fact that the energy of the band able to excite transitions of the valence electrons normally takes part in chemical bonding. The problems associated with this band (lower UV) comes from the fact that the transitions are normally broad, thus affecting negatively the magnitude of chemical sensitivity.
Among the most important EMR regions, as far as food forensic analysis is concerned, is the near infrared (NIR), because in this region the molecular transitions take place through the overtones and combinations of chemical bond vibrations and not electronic transitions that are excited (Belton, 1997). This gives a reason for it to be used in food analyses and forensic investigations of food products. Another useful region of EMR for food analyses is the mid‐infrared (MIR), which like NIR experiences good sensitivity to chemical environments due to molecular vibrations occurring when the radiation is directed to the food samples (Belton, 1997). The spectral data obtained from this MIR‐EMR region provide valuable information regarding the molecular composition of the food product, as well as the physical properties of the absorbing species present in that food product (Belton, 1997). Just as in other infrared methods, mid‐infrared spectroscopy is to the transition of the vibrations of molecular chemical bonds. As described above, some molecules, especially those that are symmetrical like O ═ O, C ═ C, or N ═ N, are not IR active due to the relative high photon energy environments in IR instruments. This makes it necessary to use Fourier transform techniques as well as efficient sample preparation methods. This approach is useful in the analysis of food samples, especially those that are opaque and also those that would otherwise require stringent sample preparation methods (Belton, 1997).
Vibrational spectroscopy can be useful in the analyses of food components as an analytical technique, especially when it is in combination with chemometric multivariate tools (e.g. principal component analysis, etc.), in which case the method (vibrational spectroscopy) can offer unparalled results. These methods (vibrational spectroscopic methods) can also be suitable for conformational studies to discriminate food products on the basis of protein structure differences or polysaccharide patterns.
Other bands, such as the far‐infrared (FIR) and microwave, are normally useful in providing information on low frequency vibrations and the rotational motion of samples that are subjected to EMR magnitudes falling in these regions. In addition to this, microwave is the region that is associated with electron paramagnetic resonance (EPR), where transitions related to the magnetic states of electrons take place. These regions may not be particularly useful in food forensics, but may be of use in analyses involving transition metals and also synthetic and free radicals.
Generally, infrared spectroscopy and Raman spectroscopy have many features in common, such as microspectroscopic capabilities (they all can analyze samples that are in the nano‐ or pico‐gram range), and they are all non‐destructive, etc. Despite this similarity, IR and Raman have limitations as well as attractive features that make an analyst prefer one over the other, depending on the application. For instance, when the sample to be analyzed is hydrated or contains moisture (water), water is always a nuisance in IR measurements taken in the mid‐infrared regions, then Raman will be preferred for the analysis of this sample rather than IR. Again, Raman spectroscopy is based on the molecular polarizability of the molecule, while IR is based on the dipole moment of the molecules, in which case only molecules with dipole moments such as C ═ O, O─H, etc. will be IR active and not the homopolar molecules such as O ═ O, C ═ C, N ═ N, etc., which are very active on Raman.
The radio frequency region of the EMR is another useful band for food forensic scientists, as it displays good chemical and physical sensitivity to the samples of food products. This region is the one where experiments on the nuclear magnetic resonance (NMR) are carried out. The usefulness of this region (radio frequency) to food analysis is due to the fact that the band width of the nuclear transitions obtained are not broad but narrower, if compared to the wavelength used in the excitation process.
Another vibrational spectroscopic technique that may have applications in food forensics is Mössbauer spectroscopy which, like NMR spectroscopy, is associated with good sensitivity to the chemical and physical environment (food samples), because the change in frequency is normally very small when compared to the frequency originating from the exciting radiation.
From the facts narrated above, it is clear that only a few regions of EMR will be useful to the food forensic scientist or those regions that may actually be considered as tools that can be instrumental in the identification, verification, authentication, interrogation, or detection of the materials presented as evidence in food forensic related cases. Actually, the spectroscopic techniques that have been widely reported include infrared (NIR and MIR), Raman spectroscopy, NMR, and tetrahertz (THz) spectroscopy.
However, the main challenge when using vibrational spectroscopic methods in food forensic analyses is the complexity of food items originating from various sources (either plant or animal origins). This will result in complex spectra that will challenge the analyst to assign the functional groups correctly. However, when the analysis is involving the use of NMR, the challenge may be eliminated because NMR is capable of filtering the data/information such that signals for individual nuclei are recorded at the same time (Belton, 1997). Moreover, if other nuclei (apart from carbon‐13 or protons) are chosen, the observed spectra generated from the NMR are always simple, making it easier for interpretation. For example, if a phosphorus‐31 nucleus is chosen for NMR analysis of food samples, then the NMR will only select signals generated by phosphorus‐containing species, making it possible to identify inorganic phosphorus species, the organic phosphorus (in forms of esters, phosphorus bound to serine, etc.) due to the simplicity of the spectrum.
Choosing the appropriate nucleus in NMR analysis is possible because NMR spectroscopy is not elemental but rather an isotopic‐based technique, therefore the method can be more effective by performing either isotope substitution in the case for those low natural abundant isotopes or replacing a resonant nucleus with a non‐resonant nucleus for the purpose of enhancing the signal (Belton, 1997). For example, if the food sample contains water that seems to mask the signal, water (1H2O) can be replaced with heavy water (2H2O) and because deuterium (2H) displays less intense resonance, the resonance due to nuclei in food samples will be clearly observed. Alternatively, in food forensic analysis, it may be advantageous to incorporate isotopic nuclei that are rare in the system to be analyzed, as this can ensure isotopic selectivity in the NMR signal selection process (Belton, 1997).
In all these instances, the sample state that is analyzed by NMR is assumed to be in solutions and that isotopic nuclei are considered for selection. However, the application of NMR is not just limited to samples in solutions where only highly mobile nuclei molecular species will generate signals in a limited range of motional states or to only provide information for isotopic signals in a sample. NMR also provides information for samples that exist in solid states (not in solutions). However, solid samples have wider line‐widths, such that it is impossible to visualize the signals using ordinary or even high resolution NMR machines. The analysis of a solid sample is normally carried out using a special NMR technique known as cross‐polarization magic angle spinning (CP‐MAS). In CP‐MAS experiments, only those nuclei that have long motional correlation times are used to provide the signal for the sample. This technique, as the name suggests, involves the transfer of polarization from nuclei with high ratios of magnetic dipole moment (magnetogyric nuclei) to ones with low magnetogyric ratios. An example of cross‐polarization can be a transfer from a proton to carbon nuclei. This technique (CP‐MAS) can therefore be applied to food samples such as flours (wheat, corn), etc. to discriminate between proteins and lipids.
Sampling Approaches for Vibrational Spectroscopy Techniques
From the analytical chemistry point of view, sampling and sample preparation is the most important step in the analytical procedure and normally is the step that determines parameters such as detection limit, precision, accuracy, etc. Sample preparation steps are meant to exclude interfering molecules and other non‐target species, thus leaving the analyte of interest in its pure form and also pre‐concentrate or convert the analyte of interest into the form that is compatible with the requirements of the analytical instrument.
In food forensic related analyses, where samples are presented to provide evidence in a court of law for a fraudulence case, it is imperative that appropriate, robust, selective, and sensitive sampling and sample preparation techniques be employed. These sampling and sample preparation methods need to be capable of on‐site use, must be versatile and applicable to a wide range of analyte forms, and in different geographical locations. Some sample preparation protocols are applicable to bulky sample size, others macro‐ and micro‐sample size. Some of the vibrational spectroscopic techniques such as Raman spectroscopy (an emission/scattering process) are not complicated in the sense that they require minimal sample preparation when compared to infrared, which has extensive sample preparation procedures.
Sampling methods for Raman measurements may be grouped into three main categories, which include remote sampling, also known as a non‐invasive method, which is done through a fibre‐optic probe. Another involves the integrated Raman and optical spectroscopy, while the final sampling method is known as back‐scattering, based on using either 80‐ or 90‐degree sampling geometry.
Phenols, Polyphenols and Phenolic Flavonoids
Fruits and vegetables are known to be rich in phenols and flavonoids, which play an important role as antioxidants and radical scavengers. In the plant kingdom, there are numerous classes of phenols and flavonoids, with many containing one or more aromatic systems having hydroxyl functionalities attached to their rings and side chains. Among the most abundant phenolic antioxidants, which also give a color characteristic to some plants and fruits, are the anthocyanins. These anthocyanins are also regarded as a measure of quality of juices obtained from fruits or vegetables. There are several anthocyanins that are used to ascertain the geographical origin or authenticity of fruit juices and fruit nectars. Among these are the aglycone derivatives of anthocyanins known as anthocyanidins. Other anthocyanins that are normally used for this purpose include the hydroxycinnamic acids, ferulic acids, sinapic acids, and p‐coumaric acids. Other antioxidants that are also analyzed for geographical identification and authenticity include vitamins (A, C, E, and beta‐carotene), as well as selenium (an inorganic element) and caffeine.
Nearly all these components of the phenolic antioxidants and vitamins can be analyzed using high performance liquid chromatography with a UV‐Vis‐DAD detector. This is because the compounds contain aromatic systems with some being conjugated, thus containing chromophores giving them the ability to absorb UV‐Vis radiation.
Organic Acids in Fruit Juice and Fruit Nectar as Indicators for Geographical Origin
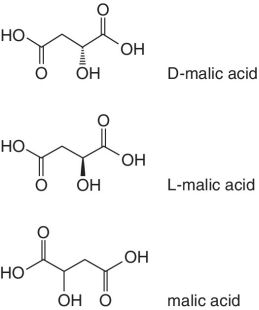
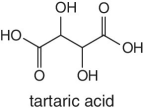
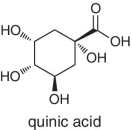
Organic acids such as quinic acid, fumaric acid, tartatic acid, malic acid, etc. form part of the natural composition of fruits. The abundances and ratios of these organic acids are normally different for each fruit and very characteristic to different fruit species and the juices processed from them. The relative concentration of these naturally occurring acids in fruits is highly dependent on the species or variety, degree of ripeness, and season. For example, tartatic acid is found in abundance in grapes, thus characteristic to grape juice and therefore regarded as an indicator and a test confirmation for grape juice authenticity. Similarly, in cases where adulteration involving dilution or spiking of a higher‐quality and expensive juice using grape juice is suspected, the authenticity testing will target the detection of tartaric acid.
Malic and quinic acids are the other organic acids found naturally in fruits, which are representative and characteristic to apples and apple juice. In cases of adulterations involving apple juice, measurements and detection of these two organic acids is always performed, as their concentrations will be different from the normal or natural levels.
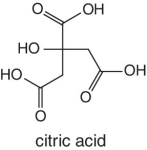
The abundances and ratios of quinic/citric acids, quinic/malic acids, as well as citric/malic acids is characteristic to cranberry and the juice processed from this fruit. Where authenticity is questioned, the measurements are performed for these acids.
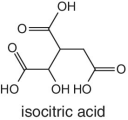
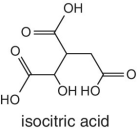
In the case of orange juice, the representative characteristic organic acids are citric and isocitric acids. The abundance and ratio of citric/isocitric is normally used to test for authenticity and the measure gives an indication of adulteration. The concentration of isocitric acid in oranges is normally very low but constant. The ratio of citric/isocitric acid greater than 130 is normally taken as an indicator of adulteration resulting from dilution involving citric acid. In other words, isocitric is the actual indicator for adulteration.
Adulteration of pomegranate juice can be indicated by the test involving measurements of quinic and tartaric acids.
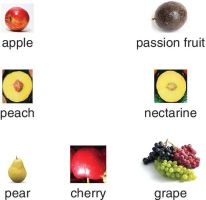
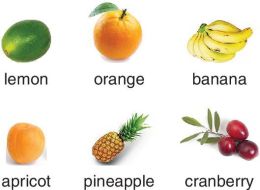
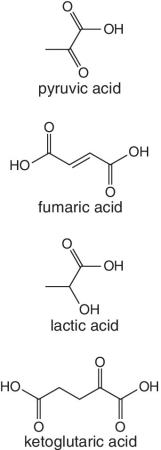
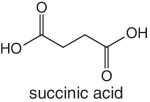
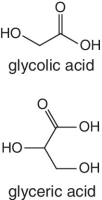
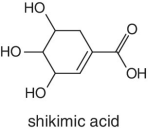
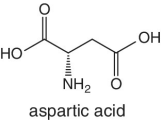
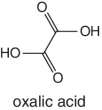
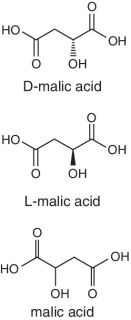
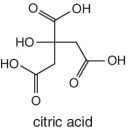
Tables 2.1a and 2.1b summarize the major organic acids found in fruits and vegetables, of which a test of authenticity may be carried out for verification.
Table 2.1a Major natural organic acids found in fruits.
Source: http://www.hawkinswatts.com/documents/Natural%20Acids%20of%20Fruits%20and%20Vegetables.pdf; accessed 20 September, 2014.
| Abundant organic acid | Fruit | Notes | |
| 1 |
|
|
|
| 2 |
|
 |
|
| 3 |
|

|
|
| 4 |
|

|
|
| Other organic acids that are found in fruits in minor quantities | |||
|

|
|
|
|
Apples, cherries, blackberries | ||
|
Apples, cherries, strawberries | ||
| lactoisocitric acid | Blackberries |
|
|
|
Cherries, strawberries |
|
|
|
Strawberries, blackberries, cherries | ||

|
Cranberries |
|
|

|
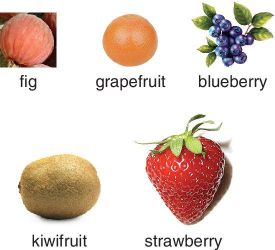
Figs |
|
|
|
Strawberries |
|
|
|
Grapefruits, grapes, pears, plums, oranges, limes, lemons |
|
|
|
|||
Table 2.1b Major natural organic acids found in vegetables.
Source: http://www.hawkinswatts.com/documents/Natural%20Acids%20of%20Fruits%20and%20Vegetables.pdf; accessed 20 September, 2014.
| Organic acid | Vegetable | Notes | |
| 1 |
|

|
|
| 2 |
|
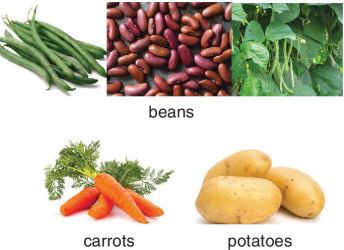

|
|
| 3 |
|

|
Isocitric acid is a characteristic organic acid in carrots |
| 4 | lactarimic acid |

|
Lactarimic acid is found exclusively in mushrooms as the dominant organic acid |
| Other organic acids that are found in vegetables minor quantities | |||
|
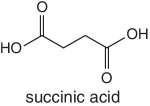
Beans, broccoli, tomatoes | ||
|
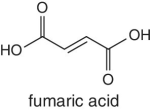
Beans, carrots, mushrooms, tomatoes | Found in mushrooms in minor quantities | |

|
Broccoli, potatoes | ||
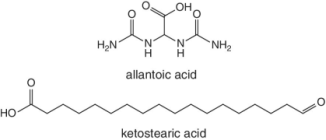
|
Mushrooms |
|
|
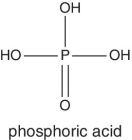
|
Potatoes, tomatoes | This organic acid is mostly found in potatoes and tomatoes | |
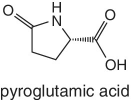
|
Potatoes | This organic acid is mostly found in potatoes | |
The analytical methods of choice for organic acids include RP‐HPLC or ion exchange HPLC equipped with UV‐Vis‐DAD, where derivatization of organic sugars may be desirable. Other detectors that are used with no need for derivatization are refractive index (RI), electrochemical detectors, conductimetric detectors, and mass spectrometers.
Amino Acids
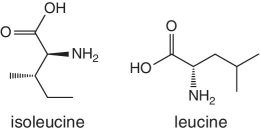
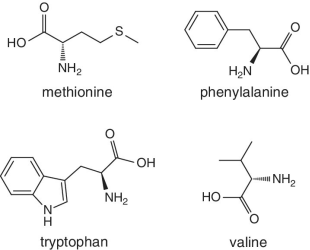
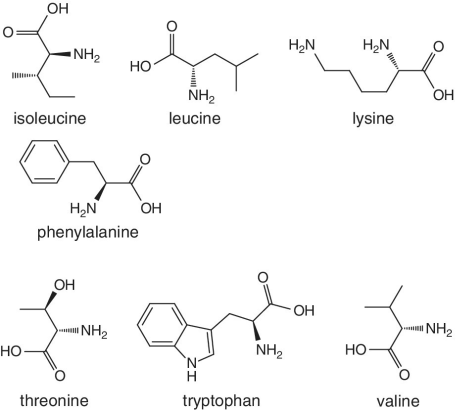
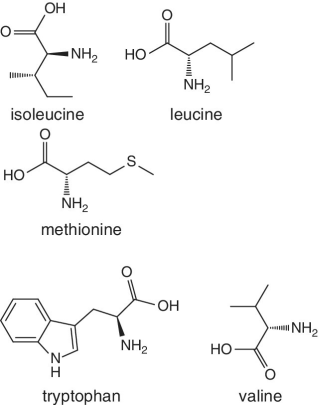
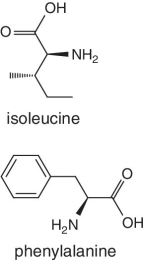
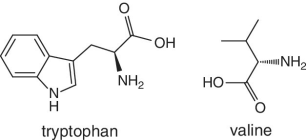
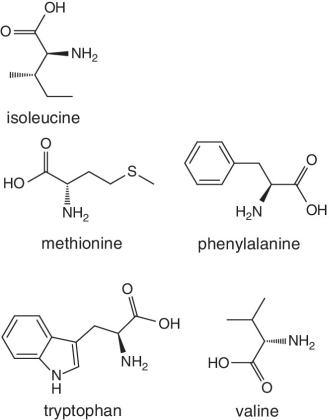
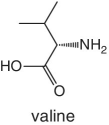
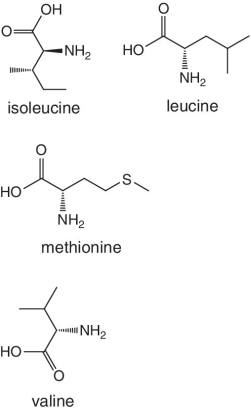
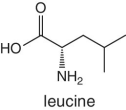
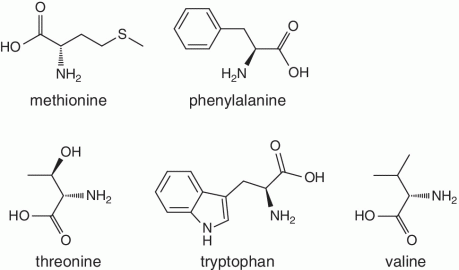
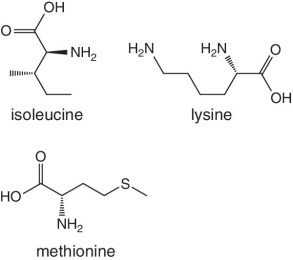
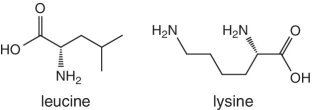
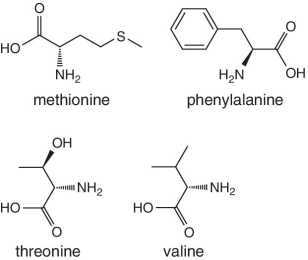
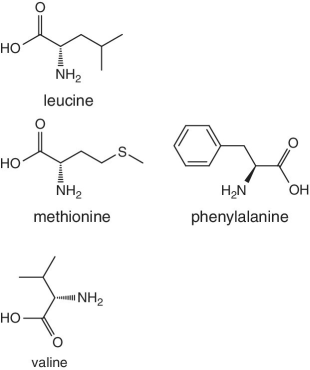
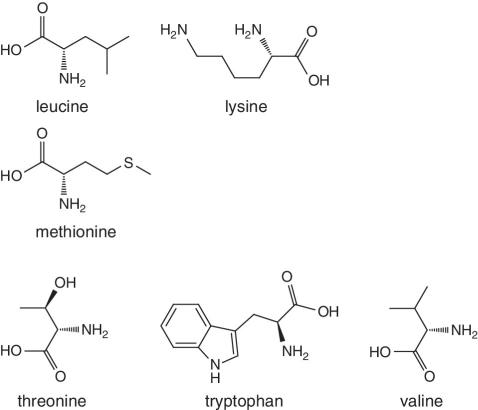
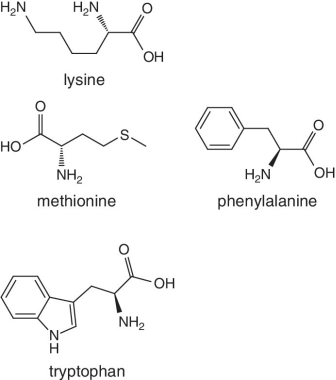
Unlike foods derived from animal origin, plant‐based foods such as fruits lack all the eight essential amino acids, though they are present in trace amounts. The presence of an appreciable amount of essential amino acids will indicate adulteration. Moreover, the distribution of essential amino acids differs in various fruits (as shown in Table 2.2).
Table 2.2 Essential amino acid profiles in fruits.
| Essential amino acid | Fruits | Notes |
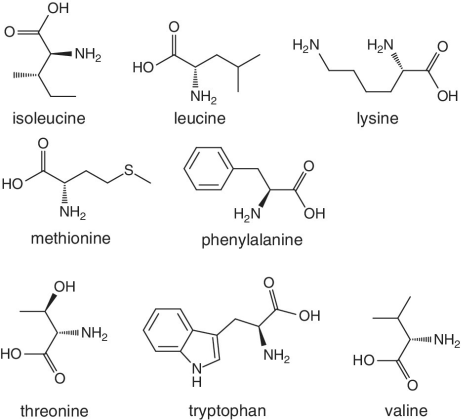
|
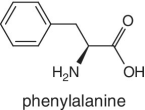
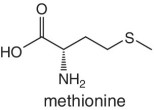
Bananas, apricots, peaches, avocados, persimmons | Trends of Isoleucine abundance in fruits are in the following order:‐ Bananas > apricots > peaches > avocados > persimmons > apricots > dates > kiwi > apples > oranges > cranberries > blueberries > plantains Trends of Leucine abundance in fruits is in the following order:‐ Bananas > apricots > peaches > guavas > avocados > figs >persimmons > raisins > pears > dates > apples > kiwi > olives > blueberries Trends of Lysine abundance in fruits are in the following order:‐ Amaranth > apricots > bananas > tamarinds > avocados > peaches > guavas > dates > oranges > pears > plantains > plums > watermelon Trends of Methionine abundance in fruits are in the following order:‐ Peaches > avocados > figs > oranges > kiwi > pears > grapes > raisins > apricots > plantains > guavas > plums > blueberries > cantaloupe > ripe olives > persimmons Trends of Phenylalanine abundance in fruits is in the following order:‐ Avocados > apricots > bananas > raisins > peaches > plums > figs > persimmons > oranges > dates > pears > grapefruit > elderberries > apples > star fruit > ripe olives Trends of Threonine abundance in fruits are in the following order:‐ Peaches > apricots > bananas > guavas > figs > avocados > raisins > pears > dates Trends of Tryptophan abundance in fruits is in the following order:‐ Apricots > raisins > avocados > apples > plums > persimmons > guavas > figs > kiwi > dates > oranges > peaches Trends of Valine abundance in fruits is in the following order:‐ Bananas > peaches > figs > apricots > avocado > guavas > raisins > dates > pears > apples > persimmons > kiwi > cranberries > ripe olives > blueberries > oranges |
|
Persimmons
NB: Lysine and threonine not present |
|
|
Dates
NB: Methionine not present |
|
|
Kiwi
NB: Lysine, phenylalanine, threonine not present |
|
|
Apples
NB: Leucine, lysine, methionine, threonine not present |
|
|
Oranges: NB: Leucine, lysine, threonine not present |
|

|
Cranberry
NB: contain mostly two amino acids: The following amino acids are not present:‐ Leucine, lysine, methionine, phenylalanine, threonine, tryptophan |
|
|
Blueberries
Missing the following amino acids: Lysine, phenylalanine, threonine, tryptophan |
|
|
Raisins and Figs:
NB: Isoleucine and lysine not present |
|
|
Plantains:
NB: Missing leucine, phenylalanine, threonine, tryptophan, valine |
|
|
Pears
NB: Missing isoleucine, tryptophan |
|
|
Olives
NB: Missing isoleucine, lysine, threonine, tryptophan |
|
|
Guavas
NB: Missing isoleucine, phenylalanine |
|
|
Plums
NB: Isoleucine, leucine, threonine, valine not present |
|

|
Watermelon
NB: Mostly lysine present |
|
|
Elderberries and grapefruit
NB: Mostly phenylalanine present |
|
|
Grapes
NB: Mostly methionine present |
Authentication of Alcoholic Beverages
An alcoholic product or alcoholic beverage refers to a drink containing ethanol content and includes wines, beers, and spirits. With regards to alcoholic beverages, normally the parameters that define the product are highly controlled to give unique properties in terms of alcoholic strength (ethanol concentration), color, flavor, odor, etc. These characteristics define a genuine product that may in many instances come from one manufacturer/industry/company. Any counterfeit/adulterated product will in most cases fail to meet these qualities, as they involve highly specific raw materials, fermenting agents, and production processes/procedures.
Generally, industries and brewing companies that produce alcoholic beverages use specific sources of products for fermentation. For example, some industries may prefer cereals such as corn, barley, etc.; others may use fruits such as grapes and others molasses, etc. Each of these sources will certainly result in specific fermentation products that will impart characteristic flavor, color, type, and strength of alcohol as well as alcohol ratios and compositions.
The specificity of various alcoholic beverages opens a way to detect adulteration and verification of authenticity. For example, in cases where a measure of methanol is lower than normal or where ethanol is higher than the expected concentration, adulteration may be suspected. The presence of methanol in an abnormal concentration from what is expected may be suspected to be due to the use of inferior or neutral raw materials. On the other hand, higher ethanol concentration than what may be expected may well be an indicator that the raw materials used are different and/or not genuine, something that may cause health problems to consumers. Moreover, some industries do allow the incorporation of additives such as specific sweeteners, colorants, or flavorings, while some do not. The various types of additives, amounts, ratios, etc. that are allowed by some industries, where they are added in the processing or in the case of those that do not allow the incorporation of additives, all of these scenarios provide ways to scientifically identify cases of adulteration or lack of authenticity. The test will certainly involve the analyses of test samples suspected of containing adulterations to the certified genuine (authentic) samples, where the discrepancy in terms of chemical composition will prove the presence and type of adulteration.
Instrumental analysis may also give evidence of adulteration. For example, if the counterfeit or test sample displays a strange UV/visible spectral pattern, it may be an indication of adulteration, which may be due to the presence of some foreign components in the product. Instrumental analysis may also give a comparison in terms of composition (quality and quantity) of the test sample and the certified genuine product. Any discrepancy will point to the possibility of adulteration.
For example, many whiskies and whisky brands display a very specific profile of chemical composition (fingerprint) and therefore this makes it possible and easy to link to geographical locations of production as well as give a test for authenticity of the product where adulteration is suspected. Other alcoholic beverages, such as vodka brands produced from various geographical locations, display similar characteristics in terms of their chemical profiles and composition (with minor differences). The case for vodka brands may be attributed to the nature and pattern of the processes involved in production rather than geographical factors. Nevertheless, the composition of all alcohol brands are well documented, such that to identify cases of adulterations scientifically is possible through comparisons with certified genuine products.
The methods and techniques used for the verification of authenticity of alcoholic beverages and their respective brands involve the analysis of volatile components of both the test/counterfeit samples and comparison with a measure found in the certified genuine sample. The methods of choice include the use of gas chromatography, UV/visible, pyrolysis mass spectrometry, 2H and 18O stable isotopic analysis, carbon isotope ratio (for the detection of the addition of neutral alcohols), infrared, and near infrared spectroscopy, as well as copper and other metals.
Chemometric Tools and Methods for Food Authentication and Fingerprinting
In the discussion above, we saw that the authenticity of food samples needs to be ascertained using different types of analytical instruments. The measurement of food samples generates large volumes of data that need to be worked out in order to decode the information contained in it. To be able to work out data in a professional way, a number of chemometric tools and methods have been designed to manipulate the data by employing multivariate analysis of these data and also chemometrics takes care of the aspects of experimental design. In other words, chemometrics deals with both “how to obtain information (with the aid of some validated mathematical model concepts) from and about the sample” and also “how to generate the experimental data (which takes into account the noise as well),” and the results are normally presented graphically for a better reflection of the information. The limitations of mathematical models that are designed for chemometric applications are that they are approximations, which are useful within the specified intervals, thus falling short of narrating the details of the chemical environment where the system of the experiment is centred. Moreover, chemometrics is only valid in cases where the experimental design ensures that the variables are treated in the same way as in a simultaneous mode, in the sense that it has to be in a MULTI‐variate style and not UNI‐variate, otherwise the in‐depth information about the sample will not be uncovered.
The chemometric experimental design optimizes the system and is vital, as it minimizes the number of the planned experiments (e.g. optimization experiments) and on the other hand, it ensures the acquiring of maximum information from and about the sample. The experimental design also creates the possibility to investigate how various factors interact, what kinds of responses are obtained, or what kinds of experimental domains are involved. By definition, “a factor” refers to those variables (quantitative or qualitative) normally plotted in the abscissa, x‐axis of the graph, and varied at known intervals depending on the experimental design for the intended information. The measurement regime of factors is continuous or taken in a discrete fashion, differentiated between qualitative and quantitative factors, with the former known as discrete measurements and the latter as continuous. Examples of qualitative factors include the type of solvents used as eluting phases in chromatography, etc. and examples of quantitative factors include concentration, temperature, pH, etc. On the other hand, responses as far as chemometrics are concerned refer to the observations (or the results) obtained from a particular experiment.
In chemometrics, the data involved may be categorized in three main ways, such that it may either be one way, two way, or three way. The way in which data is presented determines the choice of chemometric technique to be used for data treatment. For instance, if the spirulina tablet (food supplement) is suspected to contain microcystins (toxins) and the analysis of microcystin is conducted using HPLC‐DAD at 238 nm to give an absorbance unit magnitude of 2.74 mAU, this will constitute data containing just a single figure. However, if the absorbance measurements are considered together with other measurements, such as the retention time of microcystins at a fixed wavelength of 238 nm, then this will give a one‐way set of data measurement. If the absorbance measurements are generated at a range of wavelengths, for example 238–254 nm collected at an interval of 1 nm giving 17 absorbance measurements, this will be a two‐way kind of data (absorbance + retention time). In the case where the number of samples is taken into account, then it will give a three‐way kind of data (absorbance + retention time + number of samples with a known run time, e.g. 15 minutes and the spectrum being collected at a particular frequency, e.g. one spectrum per second).
This automatically points to the fact that the minimum condition for the multivariate chemometric technique to be considered is where the data has more than one dimension. Moreover, even where the data exist in more than one dimension, the choice of multivariate methods still depends on a number of factors. For example, principal component analysis (PCA) or partial least squares regression (PLS) can only be considered where a first‐order data set of a number of samples is tabulated. In cases where multi‐way sets of data are tabulated in two or more categories of variables, then other multivariate chemometric methods may be adopted, and include n‐way PLS, Parallel Factor Analysis (PARAFAC), etc.
When the analysis of the sample/samples has been performed, the results obtained (observations) can be employed to evaluate linear/quadratic/polynomial approximations of the regression model that relates the factors (plotted as x‐axis in the graph) to the respective responses (plotted as y‐axis in the graph) representing the following mathematical expression:

where β0 = intercept; β1 = regression coefficient of the first factor (x1 ); β2 = regression coefficient of the second factor (x2 ); β12 = regression coefficient of the interaction term between x1 and x2 ; and E denotes the error/residual.
In cases where the experiment is conducted for screening purposes, a linear model may be appropriate and where the experiment is meant for optimization purposes, then a quadratic model can be adopted, and cases that involve several dependent factors or responses in an experimental set, are best suited for a PLS model.
Conclusions
The need for proving provenance or fingerprinting of food products and ensuring the authenticity of food products is of paramount importance. This is due to a number of fraud cases that have involved food products. In general, consumers have been at risk due to fraudulence of food products. A good report is that food forensics has been able to develop methods to verify the authenticity of nearly all food products with great accuracy, such that culprits can easily be caught when and where they transgress the regulations and guidelines.
References
- Belton, P.S. (1997) Spectroscopic approaches to the measurement of food quality. Pure & Applied Chemistry, 69(1): 47–50.
- Brereton, P. (ed.) (2013) New Analytical Approaches for Verifying the Origin of Foods. Woodhead Publishing Ltd, New York.
- Chisholm, J., Conyers, C., Booth, C., Lawley, W. and Hird, H. (2005) The detection of horse and donkey using real‐time PCR. Meat Science, 70: 727–732.
- Conyers, C.M., Allnutt, T.R., Hird, H.J., Kaye, J. and Chisholm, J. (2012) Development of a microsatellite‐based method for the differentiation of European wild boar (Sus scrofa scrofa) from domestic pig breeds (Sus scrofa domestica). Food Journal of Agricultural and Food Chemistry, 60(13): 3341–3347.
- Cui, Y‐Q., Ma, J‐Y. and Sun, W. (2011) Application of stable isotope techniques to the study of soil salinization. Journal of Arid Land, 3(4): 285−291.
- Donarski, J.A., Jones, S.A., Harrison, M., Driffield, M. and Charlton, A.J. (2010) Identification of botanical biomarkers found in Corsican honey. Food Chemistry, 118: 987–994.
- Ellefson, W., Zach, L. and Sullivan, D. (eds) (2013) Improving Import Food Safety. IFT Press, Wiley‐Blackwell, Oxford.
- Elliott, C. (2013) Review into the Integrity and Assurance of Food Supply Networks – interim report December 2013. HM Government: Available online: https://www.gov.uk/government/uploads/system/uploads/attachment_data/file/264997/pb14089‐elliot‐review‐interim‐20131212.pdf
- Fernandez Pierna, J.A., Bten, V., Boix, A., von Holst, C., Perez Marin, D. et al. (2013) Near Infrared Microscopy (NIRM). In: Detection, Identification and Quantification of Processed Animal Proteins in Feedingstuffs (eds J.S. Jorgensen and V. Bæten). Presses Universitaires de Namur, pp. 81–91.
- Fumiere, O., Close, R., Karanam, M. and Berben, G. (2013) DNA based approaches for the species‐specific identification of animal material. In: Detection, Identification and Quantification of Processed Animal Proteins in Feedingstuffs (eds J.S. Jorgensen and V. Bæten). Presses Universitaires de Namur, pp. 113–124.
- Gonzalvez, A., Armenta, S. and de la Guardia, M. (2009) Trace‐element composition and stable‐isotope ratio for discrimination of foods with Protected Designation of Origin. TrAC Trends in Analytical Chemistry, 28(11): 1295–1311.
- Grundy, H.H., Read, W.A., Macarthur, R., Dickinson, M., Charlton, A.J. et al. (2013) Selected reaction monitoring method to determine the species origin of blood‐based binding agents in meats: A collaborative study. Food Chemistry, 141(4): 3531–3536.
- Kelly, S.D. (2003) Using stable isotope ratio mass spectrometry (IRMS) in food authentication and traceability. In: Food Authenticity And Traceability (ed. M. Lees). Woodhead, London, pp. 156–183.
- Kelly, S.D. and Bateman, A.S. (2009) Comparison of mineral concentrations in commercially grown organic and conventional crops – tomatoes (Lycopersicon esculentum) and lettuces (Lactuca sativa). Food Chemistry, 119: 738–745.
- Lin, G.H. and Ke, Y. (1995) Stable isotope techniques and global change research. In: Lectures on Modern Ecology (ed. B. Li). Science Press, Beijing, pp. 161–188.
- López‐Calleja, I., González Alonso, I., Fajardo, V., Rodríguez, M.A., Hernández, P.E. et al. (2004) PCR detection of cows’ milk in water buffalo milk and mozzarella cheese. International Dairy Journal, 15(11): 1122–1129.
- Maggi, L., Carmona, M., Kelly, S.D., Marigheto, N. and Alonso, G.L. (2011) Geographical origin differentiation of saffron spice (Crocus sativus L. stigmas) – Preliminary investigation using chemical and multi‐element (H, C, N) stable isotope analysis. Food Chemistry, 128: 543–548.
- Pomeranz, Y. and Meloan, C.E. (1994) Food analysis: Theory and practice, 3rd edition. Aspen Publishers Inc, New York.
- Reany, S. and Bremer, M. (2013) Immunological approaches for processed animal protein detection in animal feeds. In: Detection, Identification and Quantification of Processed Animal Proteins in Feedingstuffs (eds J.S. Jorgensen and V. Bæten). Presses Universitaires de Namur, 103–112.
- Shears, P. (2010) Food fraud – a current issue but an old problem. British Food Journal, 112(2): 198–213.
- Spink, J. (2013) Defining food fraud and the chemistry of the crime. In: Improving Import Food Safety (eds W. Ellefson, L. Zach and D. Sullivan). IFT Press, Wiley‐Blackwell, Oxford.
- van Raamsdonk, L.W.D., Pinotti, L., Veys, P., Vancutsem, J, Pridotkas, G. and Jorgensen, J.S. (2013) Markers for microscopic detection. In: Detection, Identification and Quantification of Processed Animal Proteins in Feedingstuffs (eds J.S. Jorgensen and V. Bæten). Presses Universitaires de Namur, pp. 59–69.
http://www.hawkinswatts.com/documents/Natural%20Acids%20of%20Fruits%20and%20Vegetables.pdf; accessed 20 September 2014.
http://alternativehealthatlanta.com/wp/wp‐content/uploads/2012/07/essential‐amino‐acids‐in‐plant‐based‐foods1.pdf; accessed 20 September 2014.
http://phe.rockefeller.edu/news/wp‐content/uploads/2010/04/FDA‐pressured‐to‐combat‐rising‐food‐fraud.pdf; accessed 11 September 2014.

