We have traveled quite a distance so far through the chapters of this book, understanding various concepts and learning some amazing algorithms. We have even worked on projects that have applications in our daily lives. In short, we have done data mining without using the term explicitly. Let us now take this opportunity to formally define data mining.
Mining, in the classical sense of the word, refers to the extraction of useful minerals from the Earth (such as coal mining). Put in the context of the information age, mining refers to the extraction of useful information from large pools of data. Thus, if we look carefully, Knowledge Mining or Knowledge Discovery from Data (KDD) seems to be a better representation than the term data mining. As is the case with many keywords, short and sweet catches the attention. Thus, you may find in many places the terms Knowledge Discovery from Data and data mining being used interchangeably, which is rightly so. The process of data mining, analogous to the mining of minerals, involves the following steps:
- Data cleansing to remove noise and unwanted data
- Data transformation to transform the data into relevant form for analysis
- Data/pattern evaluation to uncover interesting insights
- Data presentation to visualize knowledge in a useful form
If we take a minute to understand the preceding steps, we can see that we used exactly the same process across our projects. Please keep in mind that we have simply formalized and presented the process we have been following across chapters and not missed or modified any step done in previous chapters.
Now that we have formally defined data mining and seen the steps involved in transforming data to knowledge, let us focus on data from social networks. While data mining methodology is independent of the source of data, there are certain things to be kept in mind which could lead to better processing and improved results.
Like the mining of any other type of data, domain knowledge is definitely a plus for mining social network data. Even though social network analysis is an interdisciplinary subject (as discussed in the previous section), it primarily involves the analysis of data pertaining to users or entities and their interactions.
In previous chapters, we have seen all sorts of data from e-commerce platforms to banks to data related to the characteristics of flowers. The data we have seen has had different attributes and characteristics. But if we look carefully, the data was a result of some sort of measurement or event capture.
Coming onto the social network's domain, the playground is a little, if not completely different. Unlike what we have seen so far, data from social media platforms is extremely dynamic. When we say dynamic, we refer to the actual content on a data point and not its structure. The data point itself may (or may not) be structured, but the content itself is not.
Let us be specific and talk about data contained in a tweet. A sample tweet looks something like this:
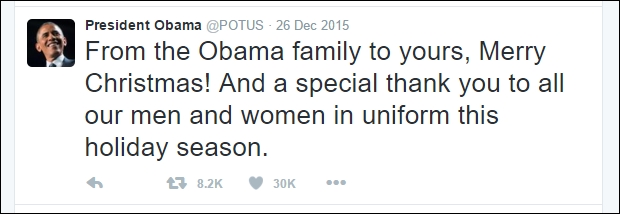
Image source: https://twitter.com/POTUS/status/680464195993911296
A tweet, as we all know, is a 140 character message. Since the message is generated by a user (usually), the actual message may be of a different length, language, and or it may contain images, links, videos, and more. Thus, a tweet is a structured data point which contains the handle of the user (@POTUS), the name of the user (President Obama), the message (From the Obama family...), along with information related to when was it tweeted (26 Dec 2015), the number of likes, and the number of retweets. A tweet may also contain hashtags, hyperlinks, images, and videos embedded within the message. As we will see in the coming sections, a tweet contains tons of metadata (data about the data) apart from the attributes discussed preceding. Similarly, data from other social networks also contains a lot more information than what usually meets the eye.
This much information from a single tweet coupled with millions of users tweeting frantically every second across the globe presents a huge amount of data with interesting patterns waiting to be discovered.
In its true sense, Twitter's data (and of social networks in general) represents the 3 Vs (Volume, Variety, and Velocity) of big data very well.
Note
143,199 tweets per second is a record achieved during the airing of the film Castle in the Sky in Japan on August 3, 2013. The average tweets per second is usually around 5700; the record multiplied it 25 times! Read more about it on the Twitter blog: https://blog.twitter.com/2013/new-tweets-per-second-record-and-how
Thus, the mining of data from a social network involves understanding the structure of the data point, the underlying philosophy or use of the social network (Twitter is used for quick exchange of information, while LinkedIn is used for professional networking), the velocity and volume of the data being generated, along with the thinking cap of a data scientist.
Towards the end of the chapter, we will also touch upon the challenges presented by social networks to the usual mining methodology.
When the amount of data is growing exponentially every passing minute, the outcome of data mining activity must empower decision-makers to quickly identify action points. The outcome should be free of noise/excess information, yet be crisp and complete enough to be useable.
This unique challenge of presenting information in its most convenient and useable form for easy consumption by its intended audience (which may be nontechnical) is an important aspect of the data mining process. So far in this book, we have analyzed data and made use of line graphs, bar graphs, histograms, and scatter plots to uncover and present insights. Before we make use of these and a few more visualizations/graphs in this chapter as well, let us try and understand their importance and use them wisely.
While working on a data mining assignment, we usually get so engrossed in the data, its complexities, algorithms, and whatnot, that we tend to overlook the part where we have to make the outcome consumable rather than a difficult to read sheet of numbers and jargon. Apart from making sure that the final report/document contains the correct and verified figures, we also need to make sure that the figures are presented in such a manner that it is easy for the end user to make use of it. To enable easy consumption of this information/knowledge, we take the help of different visualizations.
Since this isn't a book on visualizations, we've taken the liberty of skipping the usual line graphs, bar graphs, pie charts, histograms, and other details. Let us understand some unconventional yet widely known/used visualizations before we use them in the coming sections.
Social networks generate data in different forms and formats. The data on such platforms may be created, shared, modified, quoted, or used in various different ways. To represent complex relationships, one of the most widely used visualizations for social network data are tag clouds or word clouds. For example, objects such as text, images, videos, and blogs on these platforms are frequently tagged. Thus, a tag cloud/word cloud represents statistics of user-generated tags. These tags may represent the relative frequency of the use of words or their presence in multiple objects. The words/tags are differentiated using different font sizes and colors to represent the statistic of choice (mostly frequency).
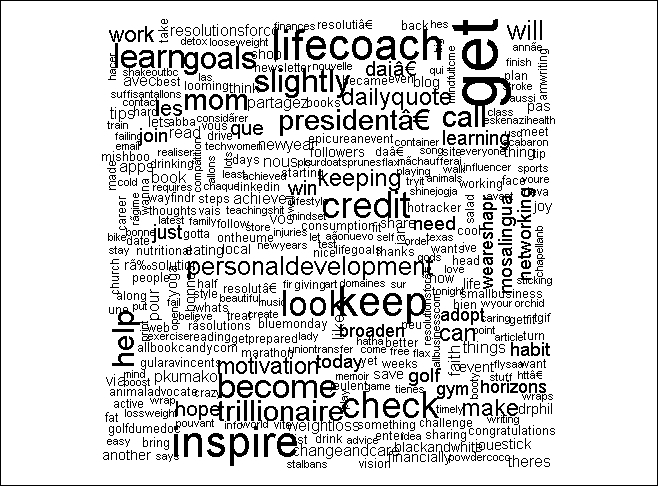
A word cloud depicting frequently used words in a subset of tweets
To represent data of high dimensionality, it is usually not possible to visualize all dimensions at the same time. Treemaps are one such type of visualization that partition all dimensions into subsets and present them in a hierarchical manner. Specifically, treemaps partition dimensions into a set of nested rectangles. One of the mostly widely cited examples of a treemap is the newsmap, which visualizes news aggregated by Google news and displays it in different categories shown by different colors; color gradients denote the appearance of the article (on a time scale), while the size of the rectangle denotes the popularity of the news item.
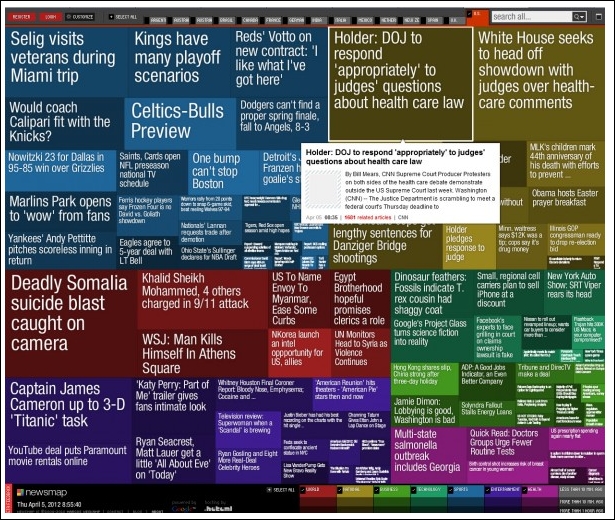
Treemap showing news aggregated by Google News
Image source: http://newsmap.jp/
Visualizations not only make outcomes easier to understand, they are very utilitarian as well. Most of the time, the outcome of an analysis process is multidimensional. To represent this data graphically on a two dimensional screen/piece of paper is a challenge. This is where pixel-oriented visualizations come into the picture. For an n-dimensional data set, pixel-oriented visualizations map each n-dimensional data point to a single pixel in n different sub-windows. Thus, each data point is split across n windows, one for each dimension. These help us map a large amount of data in single visualization. Pixel-oriented visualization look like this:
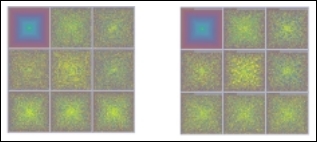
Sample pixel-oriented maps
Image source: http://bib.dbvis.de/uploadedFiles/163.pdf
Apart from the already mentioned visualizations, there are many other interesting visualizations, which come in handy for different use cases. For example, visualizations such as box plots come in handy for understanding data distribution and outlier detection. Similarly, there are visualizations such as Chernoff faces, scatter plots, network graphs, and so on which have their own merits and use cases.
Please do note that visualization is in itself a field of study and this section is merely trying to touch the tip of the iceberg. We urge readers to go through books/online content as shared in the References section of the chapter to read more on this.