The one library that we will need for this exercise is recommenderlab. The package was developed by the Southern Methodist University's Lyle Engineering Lab and they have an excellent website with supporting documentation at https://lyle.smu.edu/IDA/recommenderlab/:
> library(recommenderlab)

> data(Jester5k)

> Jester5k
5000 x 100 rating matrix of class 'realRatingMatrix' with
362106 ratings.
The rating matrix contains 362106 total ratings. It is quite easy to get a list of a user's ratings. Let's look at user number 10. The following output is abbreviated for the first five jokes:
> as(Jester5k[10,], "list")
$u12843
   j1    j2    j3    j4    j5 …
-1.99 -6.89  2.09 -4.42 -4.90 …
You can also look at the mean rating for a user (user 10) and/or the mean rating for a specific joke (joke 1), as follows:
> rowMeans(Jester5k[10,])
u12843
  -1.6

> colMeans(Jester5k[,1])
  j1
0.92
One method to get a better understanding of the data is to plot the ratings as a histogram, both the raw data and after normalization. We will do this with the getRating() function from recommenderlab:
> hist(getRatings(Jester5k), breaks=100)
The output of the preceding command is as follows:
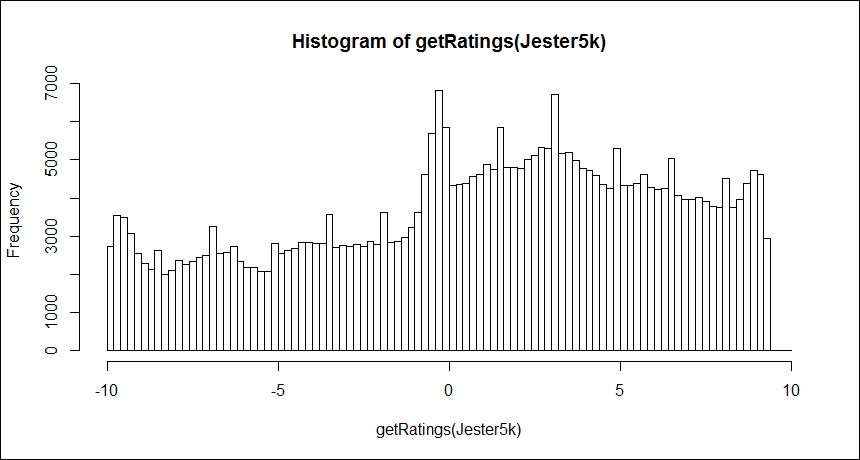
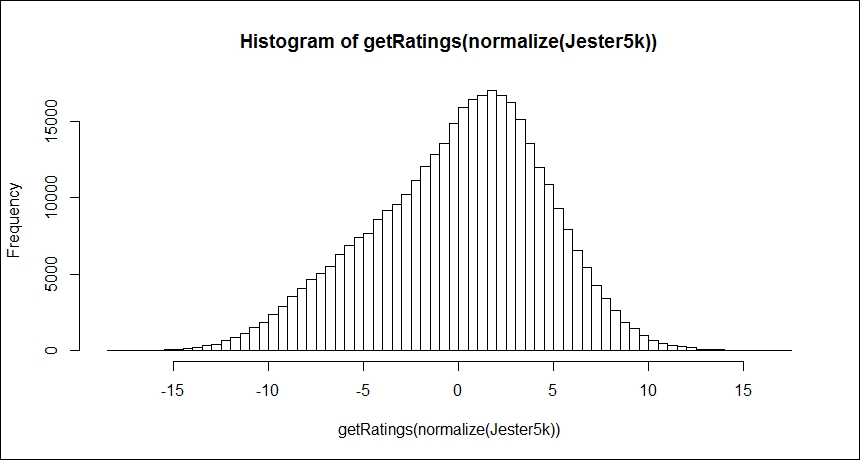
The normalize() function in the package centers the data by subtracting the mean of the ratings of the joke from that joke's rating. As the preceding distribution is slightly biased towards the positive ratings, normalizing the data can account for this; thus yielding a more normal distribution but still showing a slight skew towards the positive ratings, as follows:
> hist(getRatings(normalize(Jester5k)), breaks=100)
The following is the output of the preceding command:
Before modeling and evaluation, it is quite easy to create the train and test datasets with the recommenderlab package with the evaluationScheme() function. Let's do an 80/20 split of the data for the train and test sets. You can also choose k-fold cross-validation and bootstrap resampling if you want. We will also specify that for the test set, the algorithm will be given 15 ratings. This means that the other rating items will be used to compute the error. Additionally, we will specify what the threshold is for good rating; in our case, greater than or equal to 5:
> set.seed(123)

> e = evaluationScheme(Jester5k, method="split",
train=0.8, given=15, goodRating=5)

>  e
Evaluation scheme with 15 items given
Method: 'split' with 1 run(s).
Training set proportion: 0.800
Good ratings: >=5.000000
Data set: 5000 x 100 rating matrix of class
'realRatingMatrix' with 362106
 ratings.
With the train and test data established, we will now begin to model and evaluate the different recommenders: user-based, item-based, popular, SVD, PCA, and random.