Chapter 9. Exceptions, Errors, and Debugging
“Let it crash” is a brilliant insight, but one whose application you probably want to control. While it’s possible to write code that constantly breaks and recovers, it can be easier to write and maintain code that explicitly handles failure where it happens. Erlang is built to deal with problems like network errors, but you don’t want to add your own mistakes to the challenges. However you choose to deal with errors, you’ll definitely want to be able to track them down in your application.
Flavors of Errors
As you’ve already seen, some kinds of errors will keep Erlang from compiling your code, and the compiler will also give you warnings about potential issues, like variables that are declared but never used. Two other kinds of errors are common: runtime errors, which turn up when code is operating and can actually halt a function or process, and logic errors, which may not kill your program but can cause deeper headaches.
Logic errors are often the trickiest to diagnose, requiring careful thought and perhaps some time with the debugger, log files, or a test suite. Simple mathematical errors can take a lot of work to untangle. Sometimes issues are related to timing, when the sequence of operations isn’t what you expect. In severe cases, race conditions can create deadlocks and halting; more mild cases can produce bad results and confusion.
Runtime errors can also be annoying, but they are much more manageable. In some ways you can view handling runtime errors as part of the logic of your program, though you don’t want to get carried away. In Erlang, unlike many other environments, handling errors as errors may offer only minor advantages over letting an error kill a process and then dealing with the problem at the process level, as Example 8-10 showed.
Catching Runtime Errors as They Happen
If you want to catch runtime errors close to where they took place, the try…catch construct lets you wrap suspect code and handle problems (if any) that code creates. It makes it clear to both the compiler and the programmer that something unusual is happening, and lets you deal with any unfortunate consequences of that work.
For a simple example, look back to Example 3-1, which calculated fall velocity without considering the possibility that it would be handed a negative distance. The math:sqrt/1 function will produce a badarith error if it has a negative argument. Example 4-2 kept that problem from occurring by applying guards, but if you want to do more than block, you can take a more direct approach with try and catch, as shown in Example 9-1. (You can find it in ch09/ex1-tryCatch.)
Example 9-1. Using try and catch to handle a possible error
-module(drop).-export([fall_velocity/2]).fall_velocity(Planemo,Distance)->Gravity=casePlanemoofearth->9.8;moon->1.6;mars->3.71end,trymath:sqrt(2*Gravity*Distance)ofResult->Resultcatcherror:Error->{error,Error}end.
The calculation itself is now wrapped in a try. If the calculation succeeds, the pattern match following the of will be used. In this case, the calculation just produces one value, so matching the variable Result will put that value in Result, which then becomes the return value.
You can leave out the of clause entirely if you’re only creating one value; the result of the expression in the try will become the returned value. You probably won’t see of very frequently in code. This try…catch construct produces exactly the same results as in Example 9-1:
trymath:sqrt(2*Gravity*Distance)catcherror:Error->{error,Error}end.
If the calculation fails, in this case because of a negative argument, the pattern match in the catch clause comes into play. In this case, the atom error will match the class or exception type of the error (which can be error, throw, or exit), and the variable Error will collect the details of the error. It then returns a tuple, opening with the atom error and the contents of the Error variable, which will explain the type of error.
You can try the following on the command line:
1>c(drop).{ok,drop}2>drop:fall_velocity(earth,20).19.798989873223333>drop:fall_velocity(earth,-20).{error,badarith}
When the calculation is successful, you’ll just get the result. When it fails, the tuple tells you the kind of error that caused the problem. It’s not a complete solution, but it’s a foundation on which you can build.
You can have multiple statements in the try (much as you can in a case), separated by commas as usual. At least when you’re getting started, it’s easiest to keep the code you are trying simple so you can see where failures happened. However, if you wanted to watch for requests that provided an atom that didn’t match the planemos in the case, you could put it all into the try:
fall_velocity(Planemo,Distance)->tryGravity=casePlanemoofearth->9.8;moon->1.6;mars->3.71end,math:sqrt(2*Gravity*Distance)ofResult->Resultcatcherror:Error->{error,Error}end.
If you try an unsupported planemo, you’ll now see the code catch the problem, at least once you recompile the code to use the new version:
4>drop:fall_velocity(jupiter,20).** exception error: no case clause matching jupiterin function drop:fall_velocity/2 (drop.erl, line 5)5>c(drop).{ok,drop}6>drop:fall_velocity(jupiter,20).{error,{case_clause,jupiter}}
The case_clause error indicates that a case failed to match, and the second component of that tuple, jupiter, tells you the item that didn’t match.
You can also have multiple pattern matches in the catch. If your patterns don’t match the error in the catch clause, it gets sent up through the stack, to see if something else catches it. If nothing does, it is reported as a runtime error, as if the try hadn’t wrapped it.
If the code that might fail can create a mess, you may want to include an after clause after the catch clause and before the closing end. The code in an after clause is guaranteed to run whether the attempted code succeeds or fails, and can be a good place to address any side effects of the code. It doesn’t affect the return value of the clause.
Note
Erlang also includes an older catch construct that doesn’t use try. You may find this in someone else’s code, but probably shouldn’t include it in any new code that you write. It is less sophisticated and less readable than try…catch, though Chapter 11 shows one use for it in the shell.
Raising Exceptions with throw
You may want to create your own errors, or at least report results in a way that the try…catch mechanism can work with. The throw/1 function lets you create exceptions that can then be caught (or left to kill a process, which might be reported to the shell). It often takes a tuple as an argument, letting you provide more detail about the exception, but you can use whatever you think is appropriate. But if you handle exceptions, you definitely want to handle exceptions close to where you want to raise them.
Using throw/1 in the shell provides a simple example of what it does:
1>throw(my_exception).** exception throw: my_exception
You can pattern match for thrown exceptions in a catch clause by using throw instead of error:
trysome:function(argument)catcherror:Error->{found,Error};throw:Exception->{caught,Exception}end;
You probably should save throw for cases where you can’t come up with a better approach for signaling within your code, and be sure to use it only where you know you have nearby code that will catch it. Relying on other people and distant code to understand your invented exceptions may stretch their patience.
Note
The preceding example used found and caught to distinguish between the different kinds of exceptions, but most code will likely just use error for both.
Logging Progress and Failure
The io:format/2 function is useful for simple communications with the shell, but as your programs grow (and especially as they become distributed processes), hurling text toward standard output is less likely to get you the information you need. Erlang offers a set of functions for more formal logging. They can hook into more sophisticated logging systems, but it’s easy to get started with them as a way to structure messages from your application.
Three functions in the error_logger module give you three levels of reporting:
info_msg-
For logging ordinary news that doesn’t require intervention.
warning_msg-
For news that’s worse. Someone should do something eventually.
error_msg-
Something just plain broke, and needs to be looked at.
Like io:format, there are two versions of each function. The simpler version takes just a string, while the more sophisticated version takes a string and a list of arguments that get added to that string. Both use the same formatting structure as io:format, so you can pretty much replace any io:format calls you’d been using for debugging directly. All of these return ok.
As you can see, these calls produce reports that are visually distinctive, though warnings and errors get the same ERROR REPORT treatment:
1>error_logger:info_msg("The value is~p.~n",[360]).ok=INFO REPORT==== 12-Dec-2016::08:00:41 ===The value is 360.2>error_logger:warning_msg("Connection lost; will retry.").=ERROR REPORT==== 12-Dec-2016::08:01:33 ===Connection lost; will retry.okConnection lost; will retry.ok3>error_logger:error_msg("Unable to read database.~n").=ERROR REPORT==== 12-Dec-2016::08:03:45 ===Unable to read database.ok
The more verbose form produces only a mild improvement over io:format, so why would you use it? Because Erlang has much much more lurking under the surface. By default, when Erlang starts up, it sets up the error_logger module to report to the shell. However, if you turn on SASL—the Erlang System Architecture Support Libraries, not the authentication layer—you’ll be able to connect these notices to a much more sophisticated system for logging distributed processes. (If you just want to write your errors to disk, you should explore the error_logger:logfile/1 function.)
Note
It’s possible to break the logger with bad format strings, so if you want more reliable logging, you may want to check into the more spartan _report versions of these functions.
While logging information is useful, it’s not unusual to write code with subtle errors where you’re not positive what to log where. You could litter the code with reporting, or you could switch to a different set of tools, Erlang’s debugging facilities.
Debugging through a GUI
Erlang’s graphical debugger is the friendliest place to start, requiring only a minor change in how you compile code to get started. This demonstration will use the same code shown in Example 9-1, but you need to compile it with the debug_info flag, and start the debugger with debugger:start(). You’ll see a window like the one shown in Figure 9-1.
1>c(drop,[debug_info]).{ok,drop}2>debugger:start().{ok,<0.71.0>}
When it first opens, the debugger window is pretty empty looking. You need to tell it what you want to watch, by choosing Interpret… from the Module menu. (Depending on your operating system, that may be a regular menu or look like a button in the top row). As shown in Figure 9-2, you should see the drop module (you may need to navigate to it if you didn’t start in the same directory). If you select the drop module and click Choose, drop will appear in the left-hand pane of the Monitor window, as shown in Figure 9-3. You can then click Done to close the window and get back to the Monitor.
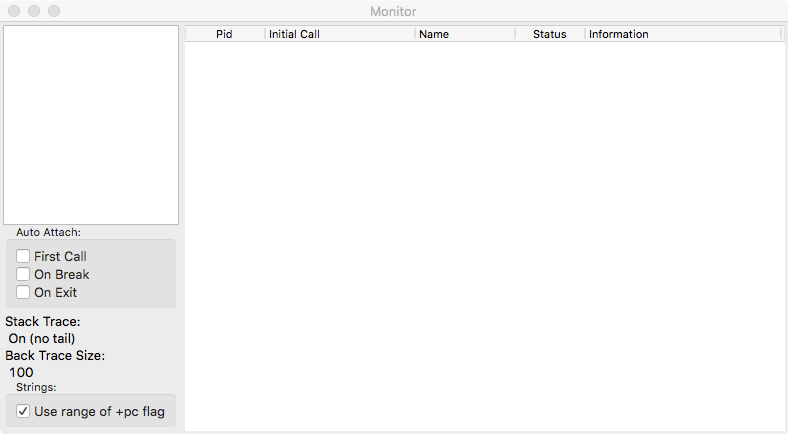
Figure 9-1. The debugger window when first opened
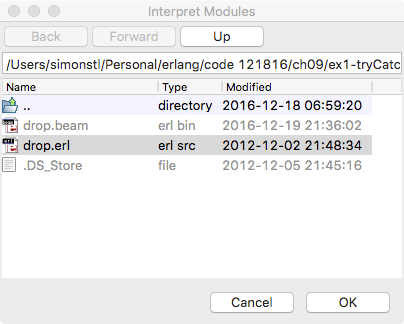
Figure 9-2. Choosing a module
Warning
The only way you’ll know you actually selected the module is its appearance in the Monitor pane. If your windows are stacked and you can’t see it, it’s easy to think that nothing happened. But it did!

Figure 9-3. A module name appears on the left-hand side
Once the module name appears in the left-hand side of the Monitor window, the debugger is ready to watch it. You need to tell the debugger, however, what you want to see. If you double-click on the name of the module (drop), you’ll get the View Module drop window shown in Figure 9-4, showing its code.
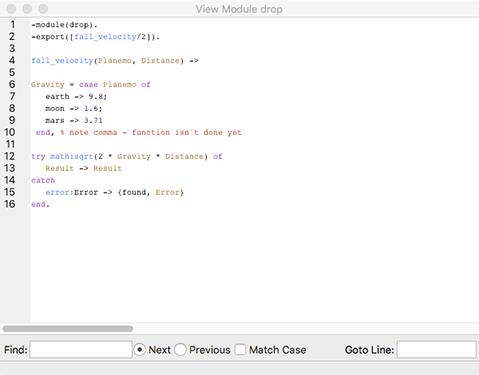
Figure 9-4. Examining the code for the drop module
You can add a breakpoint by clicking on a line of code, and then choosing Line Break… from the Break menu. You’ll see the Line Break dialog shown in Figure 9-5, with reasonable default settings. Click OK, and the View Module drop window will change to indicate the breakpoint, as shown in Figure 9-6. You can close this window, and just leave the Monitor window open.
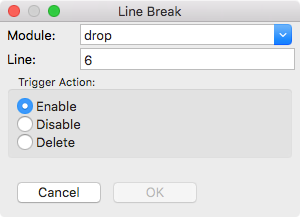
Figure 9-5. The Line Break dialog for setting breakpoints
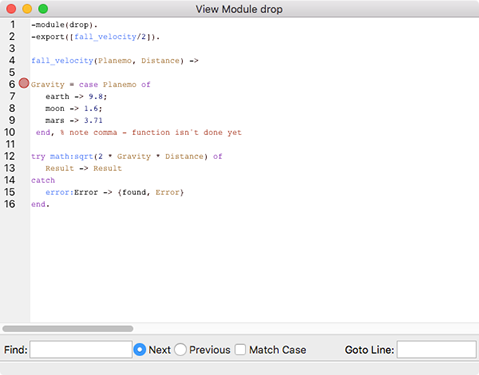
Figure 9-6. The drop module with a breakpoint set on line 6
Now, if you go back to the shell and request:
3>drop:fall_velocity(earth,20).
You’ll just get a pause. Nothing seems to happen, as the breakpoint stopped execution. However, in the Monitor window, you’ll see a new entry in the table on the right-hand side, as shown in Figure 9-7. If you double-click that new entry, you’ll get to the Attach Process window in Figure 9-8, which lets you step through the code line by line.
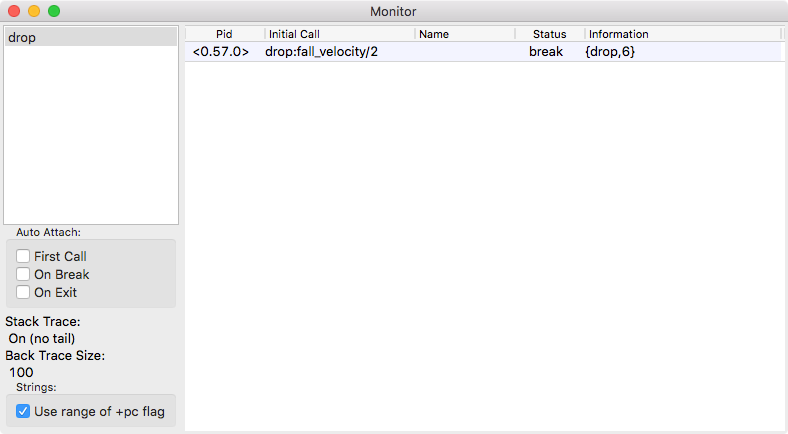
Figure 9-7. The Monitor window shows activity
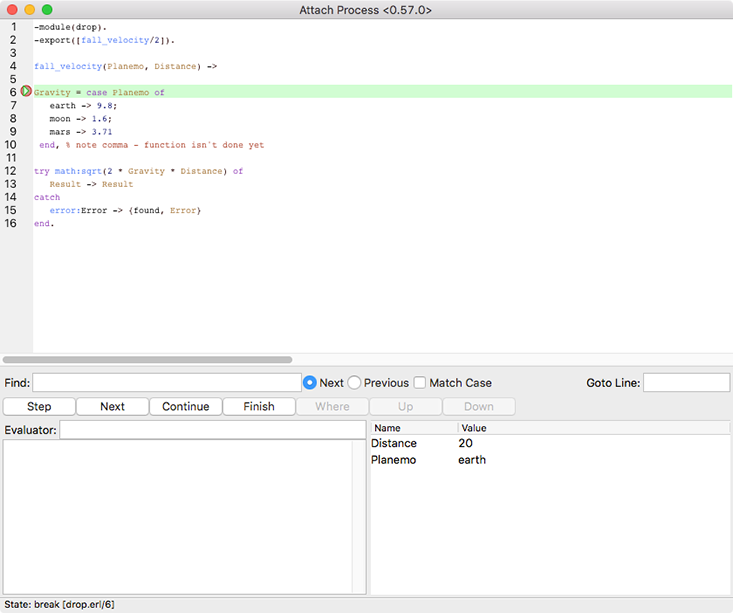
Figure 9-8. Code and bound values in the Attach Process window
Once you have the Attach Process window up, you can work through your code line by line (or tell it to continue) using the buttons in the middle line as follows:
- Step
-
Execute the current line of code and move into the next line. If the next line of code to be executed is in another function (and that function is in a module compiled for debugging), you’ll step through that function’s code.
- Next
-
Execute the current line of code and move to the next line of code in this module.
- Continue
-
End the line-by-line stepping and just have the code execute as usual.
- Finish
-
Similar to continue, but continues only for the current function. The debugger can keep working on the code when it returns from this function. (This is useful when you’ve stepped into a function whose details don’t interest you and you don’t have the patience to wait.)
- Where
-
Moves the code window to the currently executing line.
- Up and Down
-
Moves the code window up or down a function level in the stack.
Figures 9-9 through 9-12 show the results of stepping through the code executed by the drop:fall_velocity(earth,20) call. Note the changing bound variables and the final return to State: uninterpreted in Figure 9-12 when the call completes.
Any time the code is paused, you can use the Evaluator pane to make your own calculations using the values and functions available in the current scope. Unlike some debuggers, you can’t change the value of the bound variables here—because you can’t change the values of variables in Erlang generally.
In the end, the result also comes to the shell:
3> drop:fall_velocity(earth,20).
19.79898987322333
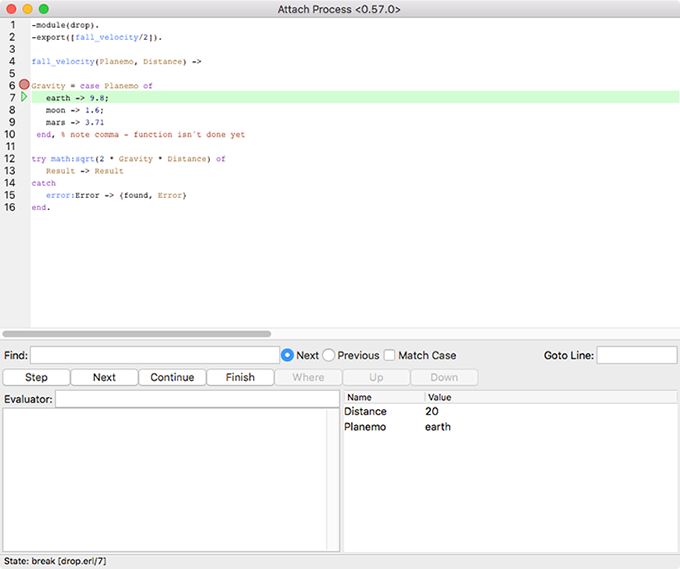
Figure 9-9. Stepping to the match on line 7
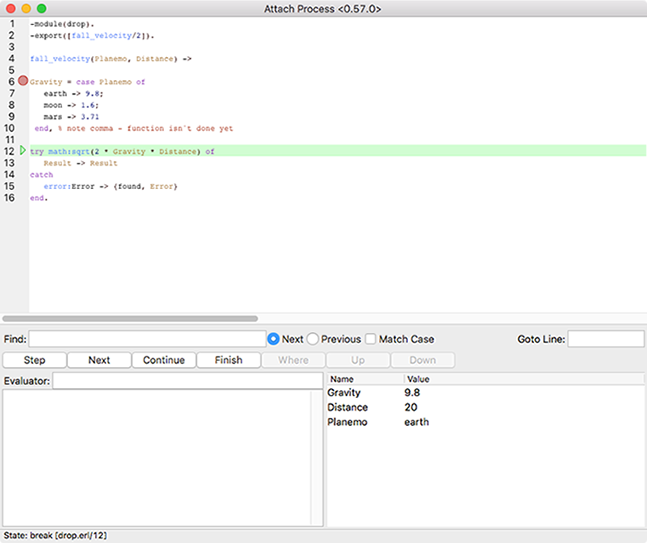
Figure 9-10. Next step: the try statement and calculation on line 12, with additional bound values
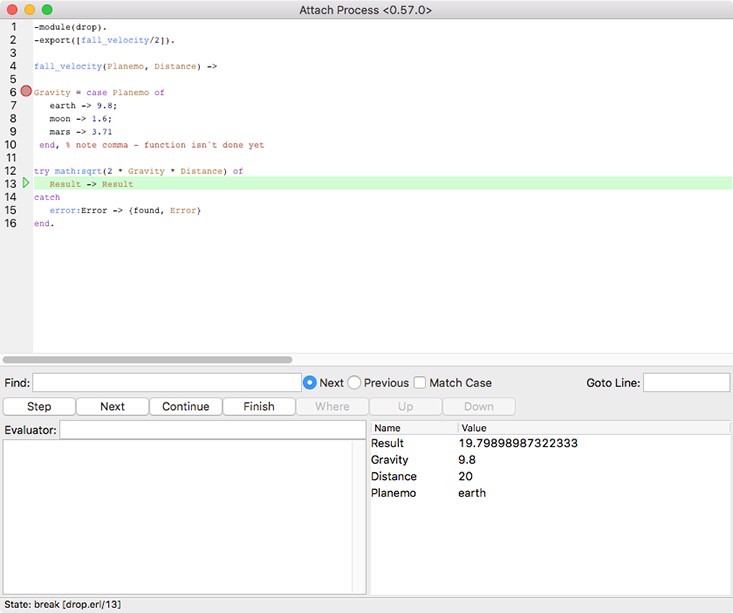
Figure 9-11. A successful calculation leads to line 13, which provides the return value
The debugger offers many more features, but this core set will get you started.
Tracing Messages
Erlang also offers a wide variety of tools for tracing code, both with other code (with the trace and trace_pattern built-in functions) and with a text-based debugger/reporter. The dbg module is the easiest place to start in this toolset, letting you specify what you want traced and showing you the results in the shell.
An easy place to get started is tracing messages sent between processes. You can use dbg:p to trace the messages sent between the mph_drop process defined in Example 8-8 and the drop process from Example 8-6. After compiling the modules—the debug_info flag isn’t needed here—you call dbg:tracer() to start reporting trace information to the shell. Then you spawn the mph_drop process as usual, and pass that pid to the dbg:p/2 process. The second argument here will be m, meaning that the trace should report the messages:
1>c(drop).{ok,drop}2>c(mph_drop).{ok,mph_drop}3>dbg:tracer().{ok,<0.43.0>}4>Pid1=spawn(mph_drop,mph_drop,[]).<0.46.0>5>dbg:p(Pid1,m).{ok,[{matched,nonode@nohost,1}]}
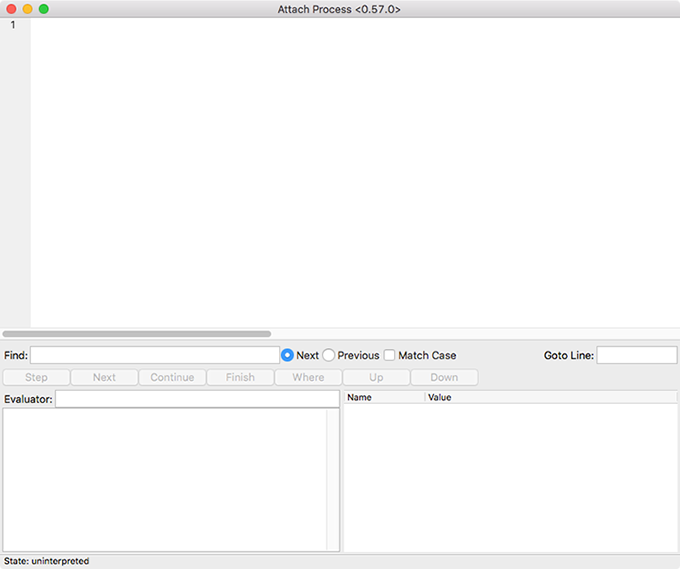
Figure 9-12. When the function call completes, the window goes mostly blank
Note
nonode@nohost just refers to the current Erlang environment when you aren’t distributing processing across multiple systems. If you’re running a distributed Erlang system, you’ll have multiple nodes, each with its own independent Erlang runtime with its own name.
Now when you send a message to the mph_drop process, you’ll get a set of reports on the resulting flow of messages. (<0.46.0> is the mph_drop process, and <0.47.0> is the drop process.)
6>Pid1!{moon,20}.(<0.46.0>) << {moon,20}(<0.46.0>) <0.47.0> ! {<0.46.0>,moon,20}On moon, a fall of 20 meters yields a velocity of 17.89549032 mph.(<0.46.0>) << {moon,20,8.0}(<0.46.0>) <0.24.0> ! {io_request,<0.46.0>,<0.24.0>,{put_chars,unicode,io_lib,format,["On ~p, a fall of ~p meters yields avelocity of ~p mph.~n",[moon,20,17.89549032]]}}{moon,20}(<0.46.0>) << {io_reply,<0.24.0>,ok}(<0.46.0>) << timeout
The << pointing to a pid indicates that that process received a message. Sends are indicated, as usual, with the pid followed by ! followed by the message.
In this case:
-
mph_drop(<0.46.0>) receives the message tuple{moon,20}. -
It sends a further message, the tuple
{<0.46.0>,moon,20}, to thedropprocess at pid <0.47.0>. -
On this run, the report from
mph_dropthat “On moon, a fall of 20 meters yields a velocity of 17.89549032 mph.” comes through faster than the tracing information. The rest of the trace indicates how that report got there. -
mph_dropreceives a tuple{moon,20,8.0}(fromdrop). -
Then it calls
io:format/2, which triggers another set of process messages to make the report, concluding with atimeoutthat doesn’t do anything.
The trace reports come through a bit after the actual execution of the code, but they make the flow of messages clear. You’ll want to learn to use dbg in its many variations to trace your code, and may eventually want to use match patterns and the trace functions themselves to create more elegant systems for watching specific code.
Watching Function Calls
If you just want to keep track of arguments moving between function calls, you can use the tracer to report on the sequence of calls. Chapter 4 demonstrated recursion and reported results along the way through io:format. There’s another way to see that work, again using the dbg module.
Example 4-11, the upward factorial calculator, started with a call to fact:factorial/1, which then called fact:factorial/3 recursively. dbg will let you see the actual function calls and their arguments, mixed with the io:format reporting. (You can find it in ch09/ex4-dbg.)
Tracing functions is a little trickier than tracing messages because you can’t just pass dbg:p/2 a pid. As shown on line 3 in the following code sample, you need to tell it you want it to report on all processes (all), and their calls (c). Once you’ve done that, you have to specify which calls you want it to report, using dbg:tpl as shown on line 4. It takes a module name (fact), function name (factorial), and optionally a match specification that lets you specify arguments more precisely. Variations on this function also let you specify arity.
So turn on the tracer, tell it you want to follow function calls, and specify a function (or functions, through multiple calls to dbg:tpl) to watch. Then call the function, and you’ll see a list of the calls.
1>c(fact).fact.erl:13: Warning: variable 'Current' is unusedfact.erl:13: Warning: variable 'N' is unused{ok,fact}2>dbg:tracer().{ok,<0.38.0>}3>dbg:p(all,c).{ok,[{matched,nonode@nohost,26}]}4>dbg:tpl(fact,factorial,[]).{ok,[{matched,nonode@nohost,2}]}5>fact:factorial(4).1 yields 1!(<0.31.0>) call fact:factorial(4)(<0.31.0>) call fact:factorial(1,4,1)2 yields 2!(<0.31.0>) call fact:factorial(2,4,1)3 yields 6!(<0.31.0>) call fact:factorial(3,4,2)4 yields 24!(<0.31.0>) call fact:factorial(4,4,6)Finished.(<0.31.0>) call fact:factorial(5,4,24)24
You can see that the sequence is a bit messy here, with the trace reporting coming a little bit after the io:format results from the function being traced. Because the trace is running in a separate process (at pid <0.38.0>) from the function (at pid <0.31.0>), its reporting may not line up smoothly (or at all, though it usually does).
When you’re done tracing, call dbg:stop/0 (if you might want to restart tracing with the same setup) or dbg:stop_clear/0 (if you know that when you start again you’ll want to set things up again).
The dbg module and the erlang:trace functions on which it builds are incredibly powerful tools.
Note
You can learn more about error handling in Chapters 3 and 17 of Erlang Programming (O’Reilly); Chapter 6 of Programming Erlang (Pragmatic); Section 2.8 and Chapters 5 and 7 of Erlang and OTP in Action (Manning); and Chapters 7 and 12 of Learn You Some Erlang For Great Good! (No Starch Press).