Chapter 26
What Have You Learned? A Summary
I’m sure by now you are well aware there is a lot of information in this book. I have shared with you my many years of academic research. I’m also sharing with you over 33 years of actual stock market experience. You learned how Warren Buffett uses Clean Surplus Accounting to project a stock’s price 10 years into the future. You then learned how he discounts that future, target price back to the present, which in turn determines his all-important purchase price.
Using a combination of Buffett’s method and my research work, you are now aware that you need to fill your portfolios with stocks that have high and consistent returns on equity (ROEs), with that ROE configured by Clean Surplus Accounting.
We saw in the published doctoral dissertation research that portfolios consisting of stocks with high ROEs outperformed portfolios that consisted of lower ROEs.
A random selection of 122 stocks that were asked about by our radio listeners showed the same findings that the doctoral dissertation research showed. Portfolios consisting of stocks with higher ROEs outperformed portfolios made up of stocks with lower ROEs.
Our model portfolio over the past 12 years has outperformed the S&P 500 index by over a two-to-one margin and also outperformed Buffett’s Berkshire Hathaway portfolio by almost the same amount.
Let’s review what you have learned but first please remember that in order to compare one company to another, we must first use accounting numbers that are calculated the exact same way between all companies. This is what Clean Surplus allows us to do. Only when Clean Surplus is used can we construct a truly comparable operating efficiency ratio and here is why:
- The ROE ratio is a ratio used to measure the operating efficiency of a company.
- It is the most widely accepted ratio used for comparing the operating efficiency of one company relative to the operating efficiency of another company.
- However, most of the investing, financial, and accounting professionals calculate the ratio in a manner not conducive to the comparison of operating efficiencies between different companies. In other words, they use the traditional accounting ROE, which does not lend itself to predictability. It is for this reason that the accounting profession developed Clean Surplus Accounting.
- Most finance professionals use earnings from the income statement for the return portion of ROE and book value from the balance sheet for the equity portion of the ROE ratio.
- However, the earnings number from the income statement contains non-recurring items, which are unique only to an individual company. These non-recurring items do not lend themselves to predictability because they do not occur in a predictable fashion.
- The earnings number is the tie-in between the income statement and the balance sheet. The balance sheet contains the book value (owners’ equity).
- If the earnings number becomes distorted because of non-recurring items, then the earnings number will in turn distort the book value (owners’ equity) on the balance sheet.
- If parts of a ratio (earnings and book value) contain individual company items that are unique to one company and not common to all companies, then that ratio cannot be used for comparison of one company to another company.
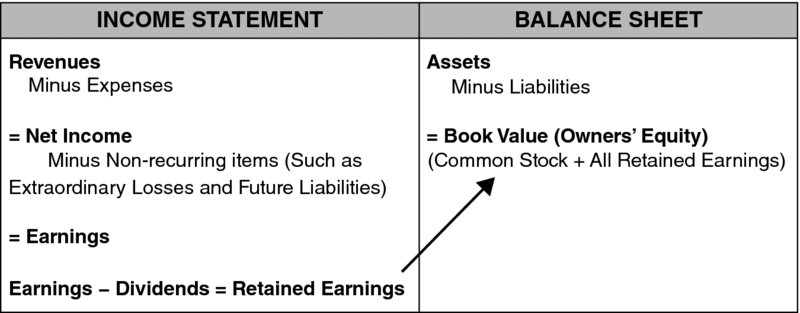
- Most of the investing world is using the wrong (traditional accounting) ROE, which is not a comparable nor predictable ratio (Figure 26.1). This is exactly why the accounting profession developed Clean Surplus. Thus, the investing world cannot truly compare companies relative to their operating efficiency if they are using a non-comparable ratio. This may be why most of the investing world cannot consistently outperform the market averages.
- Clean Surplus Accounting is designed to leave out items which do not lend themselves to predictability.
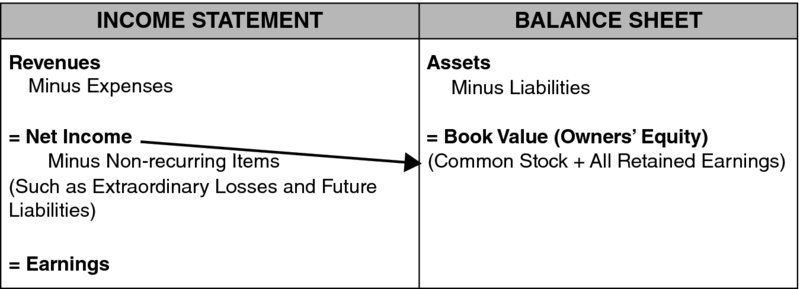
- Clean Surplus Accounting uses net income (earnings before non-recurring items) rather than earnings for the return portion of ROE (Figure 26.2). Net income is calculated in the same manner from company to company and does not contain items unique to one individual company and not another. Thus, it is a purer, more comparable number and certainly lends itself to predictability.
- Clean Surplus Accounting calculates book value (owners’ equity) using the true definition of owners’ equity, which is the amount of money investors have put into the company through issuing common stock and adding all Clean Surplus retained earnings (profits), which is net income minus dividends.
- Clean Surplus ROE thus configures both the return (net income) and equity (owners’ equity) in the ROE ratio the exact same way for all companies.
- If Clean Surplus ROE is configured in the exact same way for all companies, and it is, then Clean Surplus ROE and only Clean Surplus ROE may be used as a truly comparable efficiency ratio among all companies.
- Published academic research work (Clean Surplus Accounting: Value Relevance of Book Value and Earnings, Dr. Joseph Belmonte, 2002) indicates there is a high correlation (association, connection, relationship) between the Clean Surplus ROE of a portfolio and the total future returns of that portfolio.
- The published research contained in this book further shows that every portfolio that had a higher than average ROE outperformed the S&P 500 Index during the research test period.

Figure 26.1 Traditional Accounting

Figure 26.2 Clean Surplus Accounting
Dividend Income and Growth Strategy
The research shows that the Clean Surplus ROE is a good indicator of the total return of a stock over the following four-year time period. If a stock has a Clean Surplus ROE of 20 percent and reinvests all that it earns back into the company for growth, we can make a pretty good prediction that the stock will appreciate on average about 20 percent a year over time. This is just like your bank account (Table 26.1). If your bank is returning you 10 percent per year and you leave all your earnings (interest) in the bank, your account will grow 10 percent per year.
Table 26.1 Remember the Bank Account: This Is Clean Surplus Accounting
| Year | Equity | Interest | ROE |
| 5 | $146.00 | $14.60 | 10.0% |
| 4 | $133.00 | $13.30 | 10.0% |
| 3 | $121.00 | $12.10 | 10.0% |
| 2 | $110.00 | $11.00 | 10.0% |
| 1 | $100.00 | $10.00 | 10.0% |
Back to our 20 percent ROE stock: If the company takes half of the earnings and pays it out to shareholders in the form of dividends, then the stock cannot grow at 20 percent. If the company pays half of the earnings out to shareholders, then the maximum the stock can grow is 10 percent per year.
The key to our dividend income and growth strategy is being able to measure the dividend growth rate and also to be able to predict the approximate stock growth rate going into the future.
If this is so, then we can fill our dividend income and growth portfolio with stocks that are growing their dividends by 7–8 percent each year as well as being able to fairly well predict if the stock growth rate is also 8 percent or better.
Portfolio Insurance and Enhanced Income
We learned that we are able to buy insurance policies on our portfolio through the use of index put options. Think car insurance. Because car insurance is so costly, we buy car insurance with a deductible. In other words, we assume some of the risk of the first dollars of damage and let the insurance company assume the remaining, major portion of the risk.
Portfolio insurance is much the same. We try and insure about 90 percent of our portfolios because insuring 100 percent of the portfolio is much too costly.
Insuring 85 to 90 percent of a portfolio is still costly; however, we help to offset the cost of insurance through the use of certain enhanced income strategies. The most common form of enhanced income is the sale of covered options on some of our stocks.
We briefly mentioned that professionals like to use some form of technical analysis in order to sell covered calls so that their stocks will not be taken from the portfolio.
Putting the Odds of Success on My Side
Most of the readers of this book are very much like me. I want to put the odds of success on my side. Remember the definition of luck? When opportunity meets preparation. I feel you now have been sufficiently prepared to effectively take advantage of the opportunity that greets you through the understanding of this book. You are now one step ahead of most market analysts.
It wouldn’t be mere luck if your portfolio continually outperforms the market averages in the future, because by reading this book, you are putting the odds of success on your side. The academic world will call you “lucky,” but you know better. You are now prepared to garner the rewards of doing your homework. And we supply you the tools of outperformance through our computer program, the weekly video newsletter, and a host of educational video tutorials found on our website.
The next chapter will aid you in continuing your education. Through our website and a little help from your new friends at Buffett and Beyond Research, your portfolio will probably outperform almost everyone else over time. And since I know this to be true, I’m sure I’ll soon see you at the beach. Move over, Jimmy and Warren B.