Now, we know how to log important application messages. During development, we will face situations when only logging messages is not enough when analyzing application behavior or investigating bugs.
For us, it's important to have the ability to debug an application code during its execution on real Android devices or on emulators. So, let's debug something!
Open the main Application class and put the break point on line where we log the onCreate() method, as shown here:
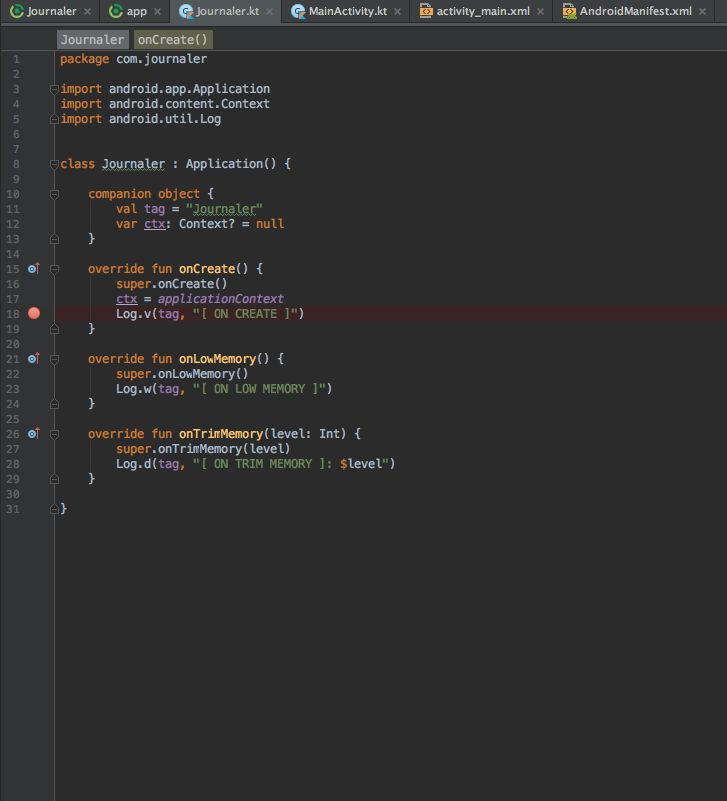
As you can see, we set the break point at line 18. We will add more break points. Let's add it in our main (and only) activity. Put a break point in each lifecycle event at lines where we perform logging.
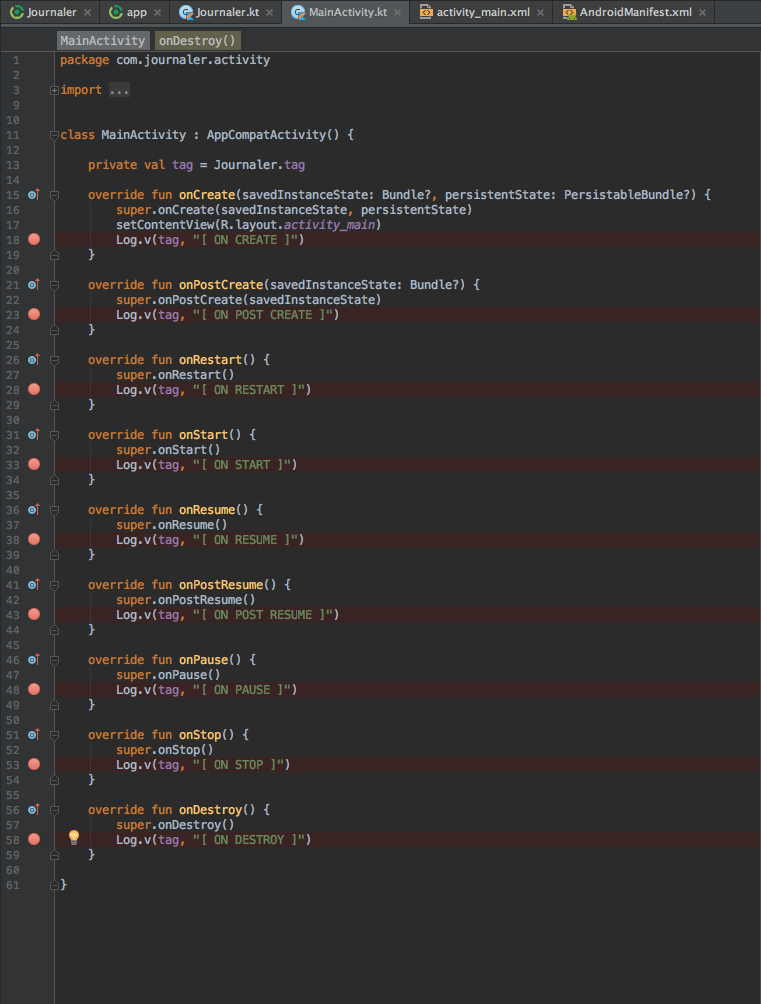
We set breakpoints at lines 18, 23, 28, 33, 38, and so on. Run the application in debug mode by clicking on the debug icon or by choosing Run | Debug app. The application is started in debug mode. Wait a little bit and a debugger will soon enter the first break point we set.
The following screenshot illustrates this:
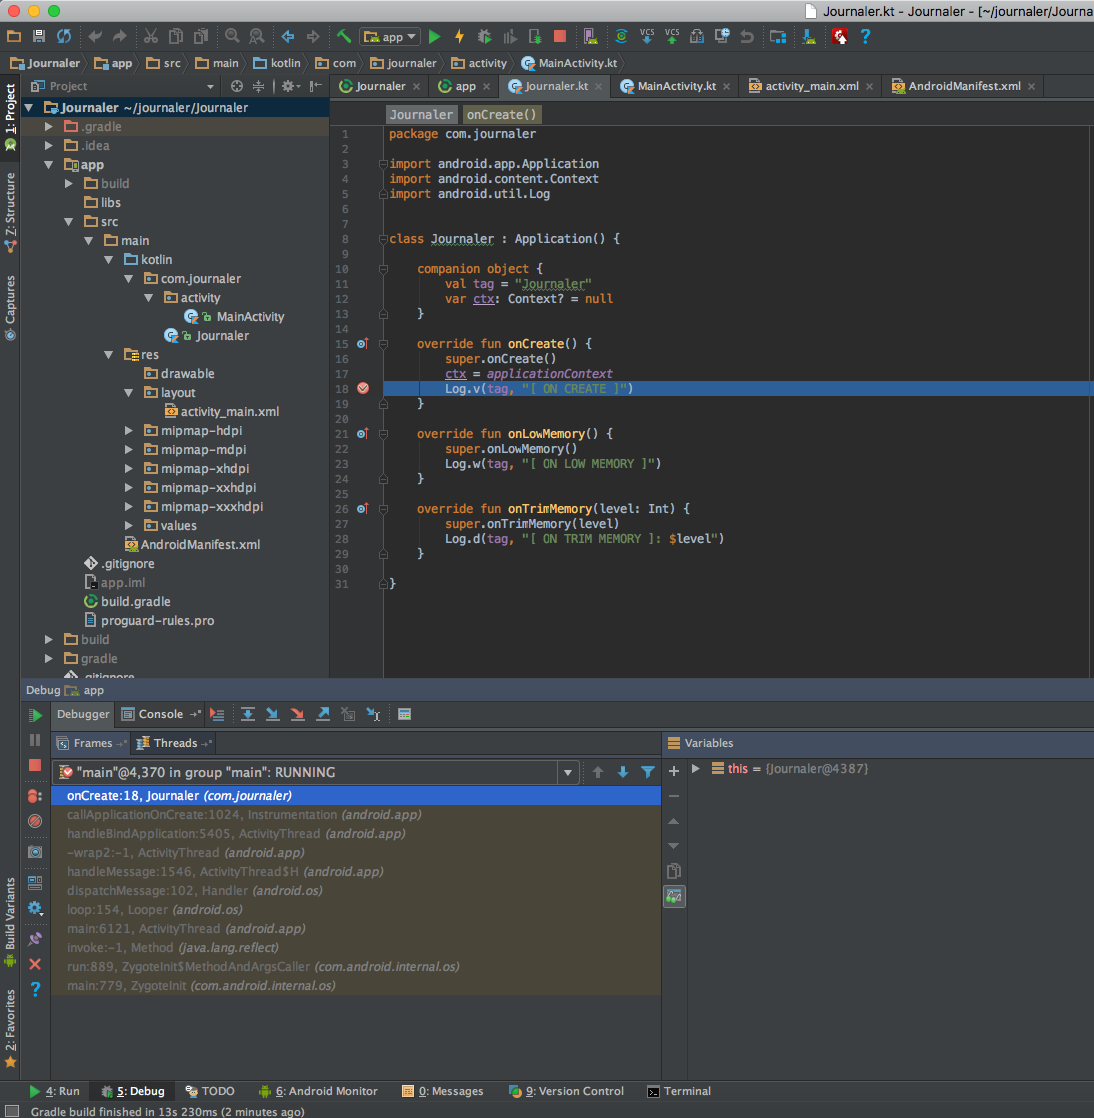
As you can see, the onCreate() method of the Application class is the first method we enter. Let's check if our applications enter lifecycle methods as expected. Click on the Resume Program icon from the Debugger pane. You may notice that we did not enter the onCreate() method for our main activity! We entered onStart() after the main Application class onCreate() method. Congratulations! You just discovered your first Android bug! Why did this happen? We used the wrong onCreate() method version instead of using the following line of code:
void onCreate(@Nullable Bundle savedInstanceState)
We accidentally overrode this:
     onCreate(Bundle savedInstanceState, PersistableBundle
     persistentState)
Thanks to debugging, we discovered this! Stop the debugger by clicking on the Stop icon from the Debugger pane and fix the code. Change the code lines to this:
    override fun onCreate(savedInstanceState: Bundle?) {
      super.onCreate(savedInstanceState)
      setContentView(R.layout.activity_main)
      Log.v(tag, "[ ON CREATE 1 ]")
    }

    override fun onCreate(savedInstanceState: Bundle?,
    persistentState: PersistableBundle?) {
      super.onCreate(savedInstanceState, persistentState)
      Log.v(tag, "[ ON CREATE 2 ]")
    }
We updated our log messages so we can track entering both the onCreate() method versions. Save your changes and start the application again in debug mode. Don't forget to set the break point to both onCreate() method overrides! Go through the break points one by one. Now we entered all break points in an expected order.
To see all break points, click on the View Breakpoints icon. The Breakpoints window appears, as shown here:

By double clicking on Breakpoint, you will be positioned at the line where it is set. Stop the debugger.
Imagine you can continue to develop your application for the next two years. Your application becomes really big, and it also executes some expensive operations. Running it directly in Debug mode can be very difficult and time consuming. We will lose a significant amount of time until it enters the break point we are interested in. What can we do about it? Applications running in debug mode are slower, and we have a slow and big application. How to skip the part where we are losing our precious time? We will demonstrate. Run your application by clicking on the Run icon or by choosing Run | Run 'app'. The application is executed and started on our deployment target (real device or emulator). Attach the debugger to your application by clicking on Attach debugger to the Android Process icon or by choosing Run | Attach debugger to Android. Choose the Process window that appears:
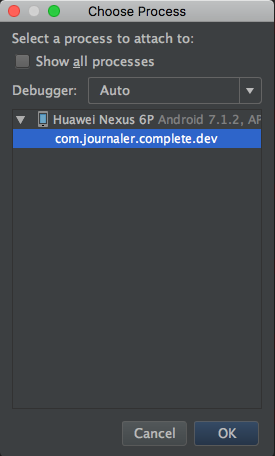
Pick our application process by double clicking on its package name. The Debugger pane appears. From your application, try to go back. Debugger enters the onPause() method of your main activity. Stop Debugger.