
Human activity recognition (HAR) is a growing field that provides valuable information about a person. Sensor-equipped smartwatches stand out in these studies in terms of their portability and cost. HAR systems usually preprocess raw signals, decompose signals, and then extract attributes to be used in the classifier. Attribute selection is an important step to reduce data size and provide appropriate parameters. In this chapter, classification of eight different actions (brushing teeth, walking, running, vacuuming, writing on the board, writing on paper, using the keyboard, and stationary) has been performed with smartwatch motion sensor data. Forty-two different features have been extracted from the motion sensor signals and the feature selection has been performed with the ReliefF algorithm. After that, performance evaluation has been performed with four different machine learning methods. With this study in which the best results have been obtained with the kernel-based extreme learning machine (KELM) algorithm, estimation of human action has been performed with high accuracy.
Wearable sensors are becoming popular in many areas such as medical, security, entertainment and commercial fields. These sensors are exceedingly useful in providing reliable and accurate information about people's actions and behaviors thus, a safe and healthy living environment is provided (Mukhopadhyay, 2015). Thus, it is possible to develop a more successful technology that can track the walking of older people who are in search of a measure against falling. In addition, a cost-effective system can also be established to investigate the relationship between a person's health status and the total number of daily living activities. The initial step in this direction is to develop a system that can classify a walking data set into different everyday life activities (Gupta & Dallas, 2014).
Monitoring and classifying human activities from wearable sensors can provide valuable information about patient’s mobility outside the hospital environment. Research in this field has attracted a great deal of attention in recent years. An activity monitoring approach that works with ubiquitous technologies and can be applied in clinical populations will provide great benefit to the decision making process based on the evidence for people with movement handicap (Capela, Lemaire & Baddour, 2015). Smartphones and smartwatches provide a handy, wearable, useful, easy-to-use computing environment rich with storage and computing power. Most of HAR systems have been developed for smartphones. Some of these systems use internal sensors and some use external biological sensors (Incel, Kose & Ersoy, 2013; Pantelopoulos & Bourbakis, 2010). When measuring movement or position, gyroscopes and accelerometers are prevalent selections because these sensors are affordable, small size, and can easily attach to the body. Several smartwatches and smartphones include gyroscopes and accelerometers thus; they are perfect devices for tracking in rehabilitation or real life environments. Wearable device sensors are used to measure the quality of post stroke movement such as upper extremity movement or walking characteristics (Patel, Huges, Hester, Stein, Akay, Dy & Bonata, 2010; Mizuike, Ohgi & Morita, 2009). Activity levels are usually measured by the number of passing of a certain threshold of total acceleration using accelerometer or other sensor data worn on the body (Fulk & Sazonov, 2011; Steele, Belza, Cain & Warms, 2003). On the other hand, activity level analysis lacks of content-based information. A system that provides content-based info about a person's actions will be a special interest for researchers and healthcare professionals (Capela, Lemaire & Baddour, 2015).
General guidelines for HAR are preprocessing, segmentation, feature extraction, feature selection and classification. Although a large number of attributes can be extracted from a raw signal, the accuracy of the classifier is not necessarily increased because the redundancy of the features is not a class indicator. For this reason, the feature selection process is used to decrease the data dimension and forward valuable attributes to the classifier (Capela, Lemaire & Baddour, 2015).
Unlike previous works, the main contribution of this study is to use hybrid methodology including ReliefF and KELM for feature selection and classification, respectively. Additionally, a new data set is constituted by collecting data from smartwatch motion sensors for this purpose. Eight different daily human activities (brushing teeth, walking, running, vacuuming, writing on the board, writing on paper, using the keyboard and stationary) are classified. In this study, sensor data (accelerometer, gyroscope) obtained from smartwatch is used and then 42 attributes are extracted. The ReliefF feature selection algorithm is used to detect the effective features. The obtained effective attributes are classified by KELM algorithm. Experiments have been carried out with different classification methods (support vector machine, kernel-based extreme learning machine, Naive Bayes and neural network) to evaluate the success of this algorithm.
Later on this section, studies carried out in the literature are mentioned. In the third part, data set used in the study, ReliefF and kernel based extreme learning machine algorithms are explained. Performed analyzes and the obtained results are discussed in fourth chapter. Finally, the obtained results are mentioned in the fifth chapter.
Related Works
Mannini et al. (2013) have classified human movements with only accelerometer sensor. Classification success have assessed separately according to window lengths and accelerometer position (wrist or ankle). Zhang and Sawchuk (2013) presented a new HAR framework using wearable motion sensors. Krishnan and Cook (2014) have proposed and evaluated a sliding window based approach in order to perform action recognition in on-line or streaming mode. They have incorporated time distortion and mutual information-based weighting into a window to show that different activities can be best characterized with different window lengths. Banos et al. (2014) have innovatively discovered the effects of sensor displacement caused by deliberate misplacement of sensors and self-positioning of the user. Alshurafa et al. (2014) have dealt with the action recognizing problem in which class labels exhibits wide variability and the data have high dimensionality. They have proposed a new powerful stochastic approach for classification of such data. Experiments have been reported using two clustering methods, Gauss mixture models (GMMs) and k-means clustering algorithm. The stochastic approach algorithm performs better than other famous classification techniques. Okeyo et al. (2014) have proposed a new approach to real-time sensor data partitioning for HAR. The approach center is a dynamic segmentation model based on the concept of different time windows, which narrows and expands the size of the segmentation window using the temporal information and activity recognition status of the sensor data and activities. Gao et al. (2014) has proposed a method for selecting sensors placed in various parts of the human body. The aim of the proposed system is to provide higher classification accuracy rate with signal processing algorithms. Zhan and Kuroda (2014) have presented a new method for identifying peripheral background sounds by using a wearable sensor. They have used a one-dimensional (1-D) Haar-like sound feature for the hidden Markov model (HMM) classification. While this method can provide high recognition accuracy, it can also meet power requirement of the wearable sensor. Banos et al. (2014) have presented an extensive study to determine the effect of the windowing procedure on the HAR process and to clarify some of the usual assumptions made during the design of the recognition system. Li et al. (2015) have presented a new method for automatic activity recognizing based on multi-sensor data. An offline adaptive HMM has been proposed to use this data voluminously and to overcome the big data problem. Yan et al. (2015) have proposed a multi-task clustering framework for daily live analysis activity from the visual data obtained from wearable cameras. Capela et al. (2015) have collected smart phone accelerometer and gyroscope sensor data from 41 healthy, elderly and stroke patients for recognition of human activities. 76 signal features have been extracted and sub-sets of these attributes have been selected using attribute selection methods (fast correlation based filter, ReliefF, correlation-based feature selection). After that, feature sub-sets have been evaluated using three general classifiers (decision trees, Naive Bayes and SVM). Massé et al. (2015) have developed an activity classifier based on fuzzy logic, taking body height changes (standing, sitting) into consideration. Attal et al. (2015) examined different classification methods used to describe human movements from wearable sensor data. Three sensor units have been used in the study and they have worn by healthy people at the key points of the lower / upper body arms (right thigh, left ankle and chest). The analyzes have been performed with four supervised classification techniques (k-nearest neighbors algorithm (kNN), SVM, GMMs and Random Forest) and three uncontrolled classification methods (k-means clustering, GMMs and hidden Markov models). The obtained results have been compared in terms of f-measure, recall, correct classification rate, specificity and sensitivity. Hammerla et al. (2016) have investigated deep, convolutional, and repetitive approaches in three representative data sets which include motion data captured by wearable sensors. Ballı and Sağbaş (2017) have classified nine different human movements by using 10 different machine learning methods with smartwatch accelerometer and step-counter sensors and they have also compared their performances. Bannach et al. (2017) have focused on the question of how the pattern recognition can benefit from any or minimal user input from new sources of information. The developed method is a variant of well-known machine learning principles, based on clustering. In the study carried out by Ballı and Sağbaş (2017), human actions (writing with keyboard, cleaning, writing on a paper, running, walking, writing on a board, standing, sitting and brushing teeth) have been classified by using only accelerometer sensor data of smartwatch and statistical learning methods (Bayesian networks, logistic regression, Naive Bayes, kNN and Multilayer Sensor Network). The most successful result has been obtained from the Bayesian Networks method. Summary of the literature is given in Table 1.
This study focuses on the feature selection which is uncommon in related works. Unlike the study evaluated by Zhan and Kurodo (2014) (sound) and Yan et al. (2015) (video), motion sensors are used in this work. In this respect, environmental problems have been avoided. In addition, Mannini et al. (2013), Crishnan and Cook (2014), Banos et al. (2014) and Okeyo et al. (2014) are examined the effects of the success of the classification of window lengths. Limited number of activity are classified by Alshurafa et al. (2014). In the study of Gao et al. (2014), the performance of the sensor position is taken into account. In this study, the data was obtained by smartwatch. In this way, confusion about the sensor position has been prevented. Capella et al. (2015) performed feature selection and compared the performance of three different machine learning methods. In this study, 4 different machine learning methods including KELM are used.
Table 1. Summary of the literature
| Author | Year | Detection | Device | Sensors | Methods |
|---|---|---|---|---|---|
| Mannini et al. | 2013 | Four Broad Activity Classes: Sedentary, Cycling, Ambulation and Other. | Triaxial Accelerometer (MMA7331LCR1) |
Accelerometer | Support Vector Machine |
| Zhang | 2013 | Jump Up, Walk (Forward, Right, Left), Run Forward, Go (Downstairs, Upstairs), Stand And Sit On A Chair | MotionNode | Accelerometer, Gyroscope and Magnetometer | Nearest neighbour, Naïve Bayes, SVM, Sparse representation –based classification |
| Crishnan and Cook | 2014 | Personal Hygiene, Take Medicine, Bathing, Bed to Toilet, Sleep, Cook, Eat, Enter Home, Relax, Leave Home, Other | Smart apartment testbeds | Binary discrete passive IR sensors | Support Vector Machine |
| Banos et al. | 2014 | 33 Typical Warm Up, Cool Down Exercises and Fitness | Xsens MTx | Accelerometer, Gyroscope and Magnetometer | Decision Trees, KNN, Naïve Bayes |
| Alshurafa et al. | 2014 | Jumping Jacks, Walking, Running | A Gulf Coast Data Concepts X6-2 mini tri-axis accelerometer | Accelerometer | S C4.5 Decision Trees, kNN and SVM |
| Gao et al. | 2014 | Standing–Sitting, Standing, Lying, Sitting, Walking (flat walking and up & down stairs), Standing–Lying, Lying–Standing, Sitting–Standing | Four Accelerometer- Based Sensors |
Accelerometer | SVM, Naïve Bayes, kNN, Decision Tree |
| Zhan and Kurodo | 2014 | Vacuum cleaner, Washing machine, Water sound from tap, Brush teeth, Shaving, Taking shower, Hair dryer, Urination (man), Flush toilet, Chewing cake (eat), Drinking, Oven-timer, Walk inside room, Walk, Run, Moving train, Rain hits an umbrella, Telephone ringing | Power-aware wearable sensor | Sound | Haar + Hidden Markov Models |
| Banos et al. | 2014 | 33 fitness activities | Wearable sensors | Accelerometer | Decision Trees, Naïve Bayes, Nearest Centroid Classifier, kNN |
| Li et al. | 2015 | Computer working, Eating, Meeting, Walking outside, Talking, Shopping, House working and Riding in a car | eButton | Camera, Accelerometer, Gyroscope, GPS, Compass, Light, Proximity, Barometer and Thermometer | Adaptive- Hidden Markov Model (HMM) |
| Yan et al. | 2015 | Using computer, Washing dishes, Drying hands/face, Washing hands/face, Drinking water/bottle and others | Camera | Video | Convex Multi-task Clustering and Earth Mover’s Distance Multi-Task Clustering |
| Capella et al. | 2015 | Stand, Sit, Lie, Stairs up, Stairs down, Ramp up, Ramp down, None | Smartphone | Accelerometer and Gyroscope | Bayes, SVM, J48 |
| Massé et al. | 2015 | Postural changes between lying, taking the elevator, short and long walking episodes, walking up and down the stairs, standing and sitting with and without arm movements, | Trunk-worn inertial and barometric pressure sensor | Accelerometer, Gyroscope and Barometer | Hierarchical Fuzzy Inference System |
| Attal et al. | 2015 | Stair descent, sitting down, Sitting, sitting on the ground, lying down, lying, standing up, stair ascent, from sitting to sitting on the ground, from lying to sitting on the ground, standing and walking, | MTx-Xbus | Accelerometer, Gyroscope and Magnetometer | Supervised Learning Gaussian Mixture Models, k-Nearest Neighbor, Support Vector Machines, Random Forest, k-Means, Hidden Markov Model and Gaussian mixture models |
| Ballı and Sağbaş | 2017 | Standing, Walking, Brushing teeth, Running, Typing, Vacuuming, Writing on board, Stationary, Writing | Moto 360 Smartwatch | Accelerometer and Step Counter | Naïve Bayes, Logistic Regression, kNN, Random Forest, Bayesian Network, Model Trees, Multilayer Perceptron, C4.5, Decision Table, Random Tree |
| Ballı and Sağbaş | 2017 | Typing, Vacuuming, Writing, Running, Walking, Writing on board, Standing, Sitting and Brushing teeth | Moto 360 Smartwatch | Accelerometer | Multilayer Perceptron, Naïve Bayes, Bayesian Network, Logistic Regression, kNN |
Dataset
The data set has been obtained using the 2nd generation Moto 360 brand smartwatch. This watch has an Android Wear operating system and can work in sync with smartphones. This device which has accelerometer, magnetometer, gyroscope, step-counter, pulse and ambient light sensors, can provide 100 sample sensor information per second. The interface of application developed for the smartwatch shown in Figure 1-a has a button to initiate or terminate the acquisition of sensor data.
| Figure 1. a) Screenshot of smartwatch dataset application b) Screenshot of smartphone dataset application |
|---|
|
The collected sensor information is transferred to the connected smartphone and saved to the phone's internal memory in CSV format with the desired name. The labeling of the action performed by the person is carried out on the smartphone side. A screenshot of the application developed for the smartphone is shown in Figure 1-b. The application developed for the smartwatch is set to collect 50 samples per second. These samples collected with this frequency are sufficient to detect the fastest human activity (Bieber & Peter, 2008). Samples that the application collects at certain intervals are transmitted to the paired smartphone. All collected data have been combined in a computer environment and 50,000 samples have been obtained for each class. These samples have been divided into 2 second windows and 500 patterns have been obtained for each class. It is aimed to reduce incorrect calculations to minimum between action transitions with 2-second windows. In the study, data has been collected for writing on the board, walking, running, brushing teeth, writing on paper, using keyboard, stationary and cleaning actions. Walking action has been diversified as individual's hands in his/her pocket, carrying an object, and walking while shaking of his/her hands. Cleaning involves the use of vacuum cleaner and dust removal. While the data of all actions are collecting, the smartwatch is positioned at the wrist of the individual who use that wrist for writing. The structure which shows storing the sensor data in the smartphone's internal memory and the flow of the work is shown in Figure 2.
| Figure 2. Proposed model for estimation of human movements |
|---|
 |
ReliefF Feature Selection Algorithm
The Relief algorithm is one of the most known feature selection method. It is an algorithm that can make highly accurate and effective attribute estimations. These estimations are achieved by weighting the features. The disadvantage of the Relief algorithm is that it cannot cope with incomplete data and it is limited with two class problems. In order to solve these and other problems, the ReliefF algorithm, which is an extended version of the Relief algorithm, has been proposed (Kononenko, 1994). This extended algorithm may overcome very powerful, noisy and incomplete data. If we look at the operating logic of ReliefF algorithm, first, a sample of Ri is chosen randomly, but later on, k nearest neighbor in same class called Hj and k nearest neighbor from different classes called Mj(C) have been selected. w[X] value is updated for all X attributes depending on the values of Ri, Hj and Mj(C). Feature weights range from (-1) to (+1). The largest positive values mean that feature is important. This process continues till the number specified by the user. In this algorithm, the update formula is the average contribution of miss and hits. The algorithm of the ReliefF method is presented in Figure 3 (Sen, Peker, Çavusoglu & Çelebi, 2014).
| Figure 3. Pseudo code of the ReliefF algorithm. |
|---|
 |
With the diff function, differences, in other words distances between samples and features are calculated. The calculation of this function depends on whether the features are written or numeric. Assume that I1 and I2 are samples, X is feature. If the features are written, then the calculation is as seen in Equation 1.
 (1)
(1)
If there are numerical features, then the calculation is as shown in Equation 2.
 (2)
(2)
Kernel Based Extreme Learning Machine (KELM)
The ELM proposed by Huang et al. (2006) is a learning algorithm developed for a feed-forward neural network model with a single hidden layer. Unlike gradient-based feed-forward networks, input weights and threshold values are randomly generated in ELM. In addition, analytical methods are used to calculate the output weights. In this way, the learning process is accelerated. Besides the ability of quick learning, ELM has better generalization performance than feed-forward networks which learn through the traditional backpropagation algorithm. Figure 4 shows the structure of the ELM algorithm.
| Figure 4. Structure of the single hidden layer feed forward neural network using ELM |
|---|
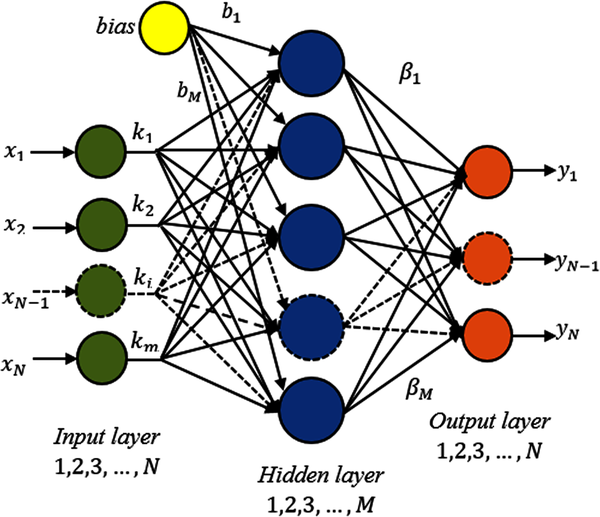 |
In Figure, x=(x1,x2,x3,…,xN) indicates input and y=(y1,y2,y3,…,yN) indicates output features. The mathematical expression of a network with M hidden layer neurons is calculated using Equation 3.
 (3)
(3)
where  represents weight values between the input layer and the hidden layer,
  represents weights between the output layer and hidden layer, b=b1,b2,…,bM represents the threshold values of hidden layer neurons and oj represents output values. g(∙) is the activation function.
In an ELM which has N hidden nerve cell and g(x) activation function, it is desirable for the error being approaching to zero. As a result,  is a targeted situation. Equation 4 can be written with re-interpreting of Equation 3.
 (4)
(4)
N equations given in Equation 4 can be abbreviated as in Equation 5:
Y = H (5)
where, H denotes the hidden layer output matrix. β denotes the output layer weights and Y denotes the output vector. These values are calculated using Equations 6-8.
 (6)
(6)
 (7)
(7)
 (8)
(8)
In ELM, input weights and thresholds of hidden layer neurons are randomly generated and H hidden layer output matrix is obtained analytically. Equation 4 expresses the linear equation structure that the ELM structure solves to produce the output. In traditional structures, processes are iteratively performed in the network learning process. ELM completes training by solving a linear equation only one time without iteration. Equation (9) is used to obtain β values from Equation 5:
= H+Y (9)
where H+, is defined as the Moore Penrose matrix which is the generalized inverse of the H output matrix.
Comparing to least square solution based ELM, in order to improve the generalization skills of ELM, Huang et al. (Huang, Zhou, Ding, & Zhang, 2012) proposed a kernel-based method for ELM design. In order to calculate the output weights as follows, they have suggested the addition of 1/C (where is a user-defined parameter) positive value.
 (10)
(10)
For this reason, the output function is expressed as follows:
 (11)
(11)
If the hidden feature mapping function h(x) is not known, a kernel matrix for ELM is used according to the following equation:
 (12)
(12)
where (xi,xj) is a kernel function. Many kernel functions such as linear, polynomial and radial-based functions can also be used in kernel based ELM. The output function of the KELM classifier can be expressed as seen in Equation 13.
 (13)
(13)
EXPERIMENTAL RESULTS AND DISCUSSION
Accelerometer and gyroscope sensor data obtained from smartwatch is used in this study. The accelerometer sensor measures the acceleration affecting the smartwatch in X, Y and Z axes direction. Raw accelerometer sensor information is obtained in the Android Wear operating system in three axes in m/sec2. The raw accelerometer sensor data  includes i=(1,2,3,…) vectors. In addition to the acceleration values, time information is also obtained. The gyro sensor gives the angular velocity that the smartwatch has performed in the X, Y and Z axes. The raw data obtained from the gyroscope sensor indicates the rotation of the smartphone around three physical axes in rad/sec (Su, Tong & Ji, 2014; Sağbaş & Ballı, 2016). Table 2 lists the feature extraction operations applied to the sensor data.
Table 2. Feature list
| Feature | Formula | |
|---|---|---|
| Minimum value: | Min V = min[xn] | (14) |
| Maximum value: | Max V = max[xn] | (15) |
| Standard deviation: |  |
(16) |
| Arithmetic Mean: |  |
(17) |
| Variance: |  |
(18) |
| Skewness: |  |
(19) |
| Kurthosis: |  |
(20) |
The feature extraction process presented in Table 2 is applied to raw data obtained from accelerometer and gyroscope sensors. The explanation of the feature and the abbreviations used in this study are given in Table 3.
Table 3. Features obtained from raw sensor data
| Feature | Feature Description | Abbreviation |
|---|---|---|
| 1, 2, 3 | Mean of acceleration (x, y, z) | ACCxMean, ACCyMean, ACCzMean |
| 4, 5, 6 | Standard deviation of acceleration (x, y, z) | ACCxStd, ACCyStd, ACCzStd |
| 7, 8, 9 | Mean of gyroscope data (x, y, z) | GYRxMean, GYRyMean, GYRzMean |
| 10, 11, 12 | Standard deviation of gyroscope data (x, y, z) | GYRxStd, GYRyStd, GYRzStd |
| 13, 14, 15 | Skewness of acceleration (x, y, z) | ACCxSkw, ACCySkw, ACCzSkw |
| 16, 17, 18 | Kurtosis of acceleration (x, y, z) | ACCxKurt, ACCyKurt, ACCzKurt |
| 19, 20, 21 | Skewness of gyroscope data (x, y, z) | GYRxSkw, GYRySkw, GYRzSkw |
| 22, 23, 24 | Kurtosis of gyroscope data (x, y, z) | GYRxKurt, GYRyKurt, GYRzKurt |
| 25, 26, 27 | Minimum value of acceleration (x, y, z) | ACCxMin, ACCyMin, ACCzMin |
| 28, 29, 30 | Maximum value of acceleration (x, y, z) | ACCxMax, ACCyMax, ACCzMax |
| 31, 32, 33 | Minimum value of gyroscope data (x, y, z) | GYRxMin, GYRyMin, GYRzMin |
| 34, 35, 36 | Maximum value of gyroscope data (x, y, z) | GYRxMax, GYRyMax, GYRzMax |
| 37, 38, 39 | Variance of acceleration (x, y, z) | ACCxVar, ACCyVar, ACCzVar |
| 40, 41, 42 | Variance of gyroscope data (x, y, z) | GYRxVar, GYRyVar, GYRzVar |
After the feature extraction process, ReliefF feature selection algorithm, which is from the effective feature selection algorithms, is applied. The order of the effective features obtained by applying the ReliefF algorithm is as follows: ACCxMean, ACCyMean, ACCzMean, ACCxMin, ACCxMax, ACCyStd, GYRzStd, ACCxStd, ACCyMax, GYRyStd, ACCyMin, GYRzMax, GYRzMin, GYRzVar, ACCzStd, GYRyVar, ACCzMin, ACCyVar, GYRyMax, GYRyMin, ACCxVar, GYRxStd, GYRxMax, ACCzMax, ACCzVar, GYRxMin, GYRxMean, GYRzMean, GYRzSkw, GYRxVar, GYRyMean, GYRzKurt, ACCxSkw, GYRySkw, ACCySkw, GYRxSkw, ACCxKurt, ACCyKurt, GYRyKurt, GYRxKurt, ACCzSkw and ACCzKurt. Figure 5 shows the classification accuracy rates of radial basis function (RBF) kernel and linear kernel functions of kernel based extreme learning machine method of feature sets determined by ReliefF algorithm.
| Figure 5. Changes in the classification accuracy with an increase in the number of selected features |
|---|
 |
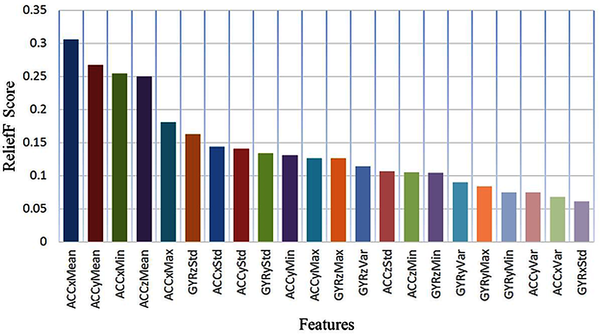
When Figure 5 is examined, it is seen that the classification accuracy is low up to the first 3 feature values in RBF kernel structure. It is seen that in some of the subclasses with 3 or more feature information, the classification accuracy rate is above 80%. This situation continues up to the subset with 35 features. After this point, accuracy rates have decreased sharply. When the linear kernel structure is examined, 9 features are needed to achieve 80% accuracy. Similarly, it is observed that in this kernel there is a serious decline in accuracy rates after a subset of 36 features. The most successful result in RBF kernel structure has obtained as 96.17% with 22 features. These features are as follows, respecively: ACCxMean, ACCyMean, ACCzMean, ACCxMin, ACCxMax, ACCyStd, GYRzStd, ACCxStd, ACCyMax, GYRyStd, ACCyMin, GYRzMax, GYRzMin, GYRzVar, ACCzStd, GYRyVar, ACCzMin, ACCyVar, GYRyMax, GYRyMin, ACCxVar and GYRxStd. ReliefF scoring values of the first 22 features are presented in Figure 6.
| Figure 6. Scores of the first 22 features |
|---|
 |
In the linear kernel structure, it has been obtained as 94.5% with 34 features. These features are respectively as follows: ACCxMean, ACCyMean, ACCzMean, ACCxMin, ACCxMax, ACCyStd, GYRzStd, ACCxStd, ACCyMax, GYRyStd, ACCyMin, GYRzMax, GYRzMin, GYRzVar, ACCzStd, GYRyVar, ACCzMin, ACCyVar, GYRyMax, GYRyMin, ACCxVar, GYRxStd, GYRxMax, ACCzMax, ACCzVar, GYRxMin, GYRxMean, GYRzMean, GYRzSkw, GYRxVar, GYRyMean, GYRzKurt, ACCxSkw and GYRySkw. In this context, it can be said that the RBF kernel structure is more efficient in this data set because it obtains more successful results with fewer features. Figure 7 shows the classification accuracy rates of different machine learning methods (KELM, Naive Bayes, neural network and SVM) of the feature sets determined by ReliefF algorithm. Regularization coefficient value has been chosen as 1000, kernel parameter has been chosen as 100 in KELM algorithm. With Figure 5 taken into consideration, RBF kernel is preferred. In the neural network algorithm, the maximum number of iterations is determined as 1000, the regularization factor is 0.5, and the number of hidden layers is 20. RBF kernel function is used in SVM. In the Naive Bayes method, relative frequency has been determined as the set in the probability estimation.
| Figure 7. Changes in classification accuracy by the increase in the number of selected features |
|---|
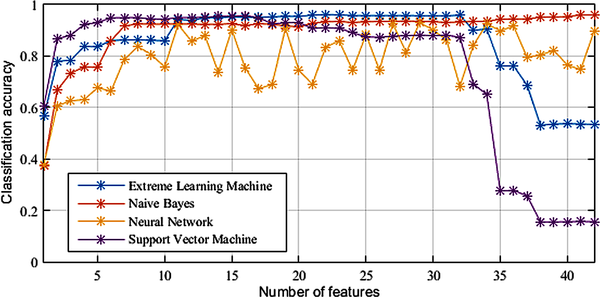 |
When Figure 7 is examined, it is seen that the SVM has increased the accuracy rate to above 80% starting from the 2nd feature. It has been observed that this success has been continued by SVM method till the 32nd feature subset and then the accuracy rate has decreased sharply. This method has achieved the most successful result with 95.75% from the 16 feature subset. Naive Bayes has achieved its highest classification success with 41 feature subset (96%), carrying the performance it has achieved on the 7 feature subset to the end of the tests. In the Neural Network method, the most successful result has been obtained with 93% from the 29 feature subset. According to Figure 7, NN method does not give very stable results and Naive Bayes is the most stable method.
Table 4. Number of features and accuracy rates of the best results
| Method | Number of Feature | Accuracy Rate |
|---|---|---|
| KELM | 22 | 96.17% |
| Naïve Bayes Algorithm | 41 | 96% |
| Neural Network | 29 | 93% |
| Support Vector Machine | 16 | 95.75% |
It is seen that the highest accuracy rate of 96.17% is obtained with KELM algorithm via using the feature set which has first 22 feature values. Then, Naive Bayes (41 features), SVM (16 features) and NN (29 features) methods are following respectively (Table 4). Closest success to the method proposed in this study has been the achieved by the Naïve Bayes algorithm. But, the Naïve Bayes algorithm has achieved this success rate with 41 features. The KELM algorithm has given a better success rate with fewer features. It is noteworthy that the KELM algorithm gives better results than powerful and efficient algorithms such as SVM and NN. Although the NN algorithm is an efficient algorithm, it is a significant disadvantage that it has a large number of parameters. Determining appropriate values for a large number of parameters such as learning rate, momentum coefficient, activation function and hidden layer neuron number is a very difficult process (Peker, 2016). This requires a large number of experiments and determination of parameter values (according to the results of these experiments) that give good results. In the KELM algorithm, experiments are performed by changing only two parameters (the penalty parameter and the kernel parameter ). In addition, the NN algorithm is a very time-consuming algorithm. Lower success rate has been obtained with the SVM algorithm comparing to the KELM algorithm. However, this difference is not very large and it is seen as 0.42 approximately. In addition, the SVM algorithm has achieved this result with fewer features.
The reason why the proposed method gives good results is using a two-stage hybrid modeling procedure combining the ReliefF algorithm with KELM. The ReliefF algorithm has been preferred because it is an efficient and robust feature selection algorithm. The advantage of KELM is that only two parameters (the penalty parameter and the kernel parameter ) need to be set, unlike ELM in which the appropriate values of weights and biases are need to be specified for improving the generalization performance (Zhu, Qin, Suganthan, & Huang, 2005; Ma, Ouyang, Chen, & Zhao, 2014). In addition, KELM not only trains as fast as ELM, but also can obtain good generalization performance. Effective results have been achieved by combining these two powerful methods.
Some of the features used in this study have been used in activity recognition applications in previous studies (Attal, Mohammed, Dedabrishvili, Chamroukhi, Oukhellou, & Amirat, 2015; Ballı & Sağbaş, 2017) However, the combination of selected features is important in machine learning applications. As seen in this study, using all the features does not always give good results. Significantly successful results in terms of classification performance can be achieved by creating the most appropriate combination of features for the related problem. For example; a result which can be obtained by using 3 features such as A, B and C together can be worse than a result that can be achieved using only B and C features. A detailed explanation of this situation has been given in the feature selection section. In this respect, it is considered that the combination of features obtained in this study will make a significant contribution to the literature.
In this study, ReliefF method has been used as a feature selection method. There are a number of feature selection algorithms known in the literature. For future studies, it is planned to perform more comprehensive analysis by using different feature selection algorithms.
This work suggests an effective model in order to help to perform action recognition with smartwatch motion sensors with high accuracy rates. The main novelty of the proposed study relates to the use of a hybrid methodology herein referred to as ReliefF + KELM, which integrates an effective feature selection method and a strong classifier. In this methodology, an effective feature set was obtained using the ReliefF algorithm. Application of this algorithm resulted in a smaller feature set by eliminating less relevant features. A KELM algorithm with high functionality and a very good classification capability was designed and developed during the classification stage of the proposed method. The prediction results obtained were very promising. Thus, a prediction system that can be used as a part of a computer-aided diagnosis system was developed. The remarkable results of the study and aimed studies for the future are listed below:
This research was previously published in the Handbook of Research on Predictive Modeling and Optimization Methods in Science and Engineering edited by Pijush Samui, Dookie Kim, Sanjiban Sekhar Roy, Tim Länsivaara, and Ravinesh Deo; pages 379-397, copyright year 2018 by Engineering Science Reference (an imprint of IGI Global).
This study is supported by Muğla Sıtkı Koçman University Scientific Research Projects under the grant number 016-061.
Alshurafa, N., Xu, W., Liu, J. J., Huang, M. C., Mortazavi, B., Roberts, C. K., & Sarrafzadeh, M. (2014). Designing a robust activity recognition framework for health and exergaming using wearable sensors. IEEE Journal of Biomedical and Health Informatics , 18(5), 1636–1646. doi:10.1109/JBHI.2013.2287504
Attal, F., Mohammed, S., Dedabrishvili, M., Chamroukhi, F., Oukhellou, L., & Amirat, Y. (2015). Physical human activity recognition using wearable sensors. Sensors (Basel) , 15(12), 31314–31338. doi:10.3390/s151229858
Ballı, S., & Sağbas, E. A. (2017). The Usage of Statistical Learning Methods on Wearable Devices and a Case Study: Activity Recognition on Smartwatches. In T. Hokimoto (Ed.), Advances in Statistical Methodologies and Their Application to Real Problems (pp. 259-277). Rijeka, Croatia: InTech.
Ballı, S., & Sağbaş, E. A. (2017). Classification of Human Motions with Smartwatch Sensors. Süleyman Demirel University Journal of Natural and Applied Sciences , 21(3), 980–990. doi:doi:10.19113/sdufbed.32689
Bannach, D., Jänicke, M., Rey, V. F., Tomforde, S., Sick, B., & Lukowicz, P. (2017). Self-Adaptation of Activity Recognition Systems to New Sensors. arXiv preprint arXiv:1701.08528
Banos, O., Galvez, J. M., Damas, M., Pomares, H., & Rojas, I. (2014). Window size impact in human activity recognition. Sensors (Basel) , 14(4), 6474–6499. doi:10.3390/s140406474
Banos, O., Toth, M. A., Damas, M., Pomares, H., & Rojas, I. (2014). Dealing with the effects of sensor displacement in wearable activity recognition. Sensors (Basel) , 14(6), 9995–10023. doi:10.3390/s140609995
BieberG.PeterC. (2008). Using physical activity for user behavior analysis. In Proceedings of the 1st international conference on Pervasive Technologies Related to Assistive Environments. (pp. 2015-221). Athens, Greece: ACM. 10.1145/1389586.1389692
Capela, N. A., Lemaire, E. D., & Baddour, N. (2015). Feature selection for wearable smartphone-based human activity recognition with able bodied, elderly, and stroke patients. PLoS One , 10(4), e0124414. doi:10.1371/journal.pone.0124414
Fulk, G. D., & Sazonov, E. (2011). Using sensors to measure activity in people with stroke. Topics in Stroke Rehabilitation , 18(6), 746–757. doi:10.1310/tsr1806-746
Gao, L., Bourke, A. K., & Nelson, J. (2014). Evaluation of accelerometer based multi-sensor versus single-sensor activity recognition systems. Medical Engineering & Physics , 36(6), 779–785. doi:10.1016/j.medengphy.2014.02.012
Gupta, P., & Dallas, T. (2014). Feature selection and activity recognition system using a single triaxial accelerometer. IEEE Transactions on Biomedical Engineering , 61(6), 1780–1786. doi:10.1109/TBME.2014.2307069
Hammerla, N. Y., Halloran, S., & Ploetz, T. (2016). Deep, convolutional, and recurrent models for human activity recognition using wearables. arXiv preprint arXiv:1604.08880
Huang, G.-B., Zhou, H., Ding, X., & Zhang, R. (2012). Extreme learning machine for regression and multiclass classification. IEEE Transactions on Systems, Man, and Cybernetics. Part B, Cybernetics , 42(2), 513–529. doi:10.1109/TSMCB.2011.2168604
Huang, G.-B., Zhu, Q.-Y., & Siew, C.-K. (2006). Extreme learning machine: Theory and applications. Neurocomputing , 70(1-3), 489–501. doi:10.1016/j.neucom.2005.12.126
Incel, O. D., Kose, M., & Ersoy, C. (2013). A review and taxonomy of activity recognition on mobile phones. BioNanoScience , 3(2), 145–171. doi:10.1007/s12668-013-0088-3
Kononenko, I. (1994). Estimating attributes: analysis and extensions of RELIEF. In European conference on machine learning (pp. 171-182). Springer.
Krishnan, N. C., & Cook, D. J. (2014). Activity recognition on streaming sensor data. Pervasive and Mobile Computing , 10, 138–154. doi:10.1016/j.pmcj.2012.07.003
Li, Z., Wei, Z., Yue, Y., Wang, H., Jia, W., Burke, L. E., & Sun, M. (2015). An adaptive hidden markov model for activity recognition based on a wearable multi-sensor device. Journal of Medical Systems , 39(5), 57–66. doi:10.1007/s10916-015-0239-x
Ma, C., Ouyang, J., Chen, H. L., & Zhao, X. H. (2014). An efficient diagnosis system for Parkinson’s disease using kernel-based extreme learning machine with subtractive clustering features weighting approach. Computational and Mathematical Methods in Medicine , 2014, 1–14. doi:10.1155/2014/985789
Mannini, A., Intille, S. S., Rosenberger, M., Sabatini, A. M., & Haskell, W. (2013). Activity recognition using a single accelerometer placed at the wrist or ankle. Medicine and Science in Sports and Exercise , 45(11), 2193–2203. doi:10.1249/MSS.0b013e31829736d6
Massé, F., Gonzenbach, R. R., Arami, A., Paraschiv-Ionescu, A., Luft, A. R., & Aminian, K. (2015). Improving activity recognition using a wearable barometric pressure sensor in mobility-impaired stroke patients. Journal of Neuroengineering and Rehabilitation , 12(1), 72–86. doi:10.1186/s12984-015-0060-2
Mizuike, C., Ohgi, S., & Morita, S. (2009). Analysis of stroke patient walking dynamics using a tri-axial accelerometer. Gait & Posture , 30(1), 60–64. doi:10.1016/j.gaitpost.2009.02.017
Mukhopadhyay, S. C. (2015). Wearable sensors for human activity monitoring: A review. IEEE Sensors Journal , 15(3), 1321–1330. doi:10.1109/JSEN.2014.2370945
Okeyo, G., Chen, L., Wang, H., & Sterritt, R. (2014). Dynamic sensor data segmentation for real-time knowledge-driven activity recognition. Pervasive and Mobile Computing , 10, 155–172. doi:10.1016/j.pmcj.2012.11.004
Pantelopoulos, A., & Bourbakis, N. G. (2010). A survey on wearable sensor-based systems for health monitoring and prognosis. IEEE Transactions on Systems, Man and Cybernetics. Part C, Applications and Reviews , 40(1), 1–12. doi:10.1109/TSMCC.2009.2032660
Patel, S., Hughes, R., Hester, T., Stein, J., Akay, M., Dy, J. G., & Bonato, P. (2010). A novel approach to monitor rehabilitation outcomes in stroke survivors using wearable technology. Proceedings of the IEEE , 98(3), 450–461. doi:10.1109/JPROC.2009.2038727
Peker, M. (2016). A new approach for automatic sleep scoring: Combining Taguchi based complex-valued neural network and complex wavelet transform. Computer Methods and Programs in Biomedicine , 129, 203–216. doi:10.1016/j.cmpb.2016.01.001
Sağbaş, E. A., & Ballı, S. (2016). Transportation mode detection by using smartphone sensors and machine learning. Pamukkale University Journal of Engineering Sciences , 22(5), 376–383. doi:10.5505/pajes.2015.63308
Sen, B., Peker, M., Çavusoğlu, A., & Çelebi, F. V. (2014). A comparative study on classification of sleep stage based on EEG signals using feature selection and classification algorithms. Journal of Medical Systems , 38(3), 18–38. doi:10.1007/s10916-014-0018-0
Steele, B. G., Belza, B., Cain, K., Warms, C., Coppersmith, J., & Howard, J. E. (2003). Bodies in motion: Monitoring daily activity and exercise with motion sensors in people with chronic pulmonary disease. Journal of Rehabilitation Research and Development , 40(5), 45–58. doi:10.1682/JRRD.2003.10.0045
Su, X., Tong, H., & Ji, P. (2014). Activity Recognition with Smartphone Sensors. Tsinghua Science and Technology , 19(3), 235–249. doi:10.1109/TST.2014.6838194
Yan, Y., Ricci, E., Liu, G., & Sebe, N. (2015). Egocentric daily activity recognition via multitask clustering. IEEE Transactions on Image Processing , 24(10), 2984–2995. doi:10.1109/TIP.2015.2438540
Zhan, Y., & Kuroda, T. (2014). Wearable sensor-based human activity recognition from environmental background sounds. Journal of Ambient Intelligence and Humanized Computing , 5(1), 77–89. doi:10.1007/s12652-012-0122-2
Zhang, M., & Sawchuk, A. A. (2013). Human daily activity recognition with sparse representation using wearable sensors. IEEE Journal of Biomedical and Health Informatics , 17(3), 553–560. doi:10.1109/JBHI.2013.2253613
Zhu, Q. Y., Qin, A. K., Suganthan, P. N., & Huang, G. B. (2005). Evolutionary extreme learning machine . Pattern Recognition , 38(10), 1759–1763. doi:10.1016/j.patcog.2005.03.028
Android/Android Wear: An open source free operating system developed and continues to be developed by Google for mobile and wearable devices.
Classification: Determining of the category to which the data belongs according to the learning set.
Feature Selection: Creation of the most efficient feature subset from the extracted features in order to perform a successful classification.
Machine Learning: A system that studies the construction and working principle of algorithms that can be learned as structural function and can predict from data.
Motion Detection: Detection of human movement with the help of various sensors.
Sensor: Electronic devices that sense outside information such as specific motion, light, object, and image.
Wearable Device: Devices that are positioned at various places in the body that can be found next to the user at any time, which does not prevent realization of daily activities.