The evolution of technology, along with the common use of different devices connected to the Internet, provides a vast growth in the volume and variety of data that are daily generated at high velocity, phenomenon commonly denominated as Big Data. Related with this, several Text Mining techniques make possible the extraction of useful insights from that data, benefiting the decision-making process across multiple areas, using the information, models, patterns or tendencies that these techniques are able to identify. With Sentiment Analysis, it is possible to understand which sentiments and opinions are implicit in this data. This paper proposes an architecture for Sentiment Analysis that uses data from the Twitter, which is able to collect, store, process and analyse data on a real-time fashion. To demonstrate its utility, practical applications are developed using real world examples where Sentiment Analysis brings benefits when applied. With the presented demonstration case, it is possible to verify the role of each used technology and the techniques adopted for Sentiment Analysis.
With increasing use of the Internet (social networks, forums, blogs, etc.) grows exponentially the volume of available data (Pang & Lee, 2008). When a user buys online, he usually shares feedback on the item and the store, or when he joins an event or goes to a restaurant, hotel or a movie, he usually also makes a comment about it. All these data can be used by several stakeholders in the decision-making process, considering the opinions that were expressed (Asur & Huberman, 2010).
Organizations show particular interest in these opinions that are freely left by users on the Internet. The world of news is one of the examples that can be used to demonstrate this interest in understanding what people feel when they share their opinion on the Internet. Currently, most newspapers already have an online version. The question to be answered is “Why? Why having an online version if it continues printed?”. The answer is simple: only online versions can hold readers’ opinions (Gebremeskel, 2011). Associated with the news world is Twitter, a social network that has millions of users sharing the latest news with a personal opinion or sentiment, providing a personal perspective that is interesting to analyse (Gebremeskel, 2011). As the number of Internet users grows, also grows the interest of organizations in retaining users and their opinions. To benefit from this reality, there is the need to analyse these opinions and use the gathered insights in the decision-making process.
Considering the vast amount of available data and the fact that these data may contain implicit peoples’ opinions/sentiments in them, there is the opportunity to use sentiment analysis techniques to understand what is mentioned and which feelings are expressed. This work is guided by this research question: Is it possible to define a Big Data architecture able to collect real-time data from Twitter and analyse the collected data for performing sentiment analysis? With this aim, the objectives of this work include the analysis of the current state-of-the-art, the proposal of an architecture that advances the state-of-the-art, and the validation of the proposed architecture with a demonstration case that goes from the collection to the analysis of the data, providing useful insights on data. Although the proposed architecture is, in this case, restricted to the use of data from Twitter, other data sources can be considered, as long as the collection mechanisms are prepared for that. Moreover, the demonstration case uses a particular set of keywords for data collection, only as an example, being possible to define any other set of keywords. In methodological terms, a proof-of-concept is provided through the implementation of the demonstration case, while for data collection, data treatment and data mining, the CRISP-DM methodology (Chapman et al., 2000) is used. This methodology starts by the business understanding, in order to analyse the application domain and the data analysis requirements. Then, data understanding allows the comprehension of the available data for identifying data quality problems, looking for wrong values, missing data, outliers, among others, and defining the appropriate strategies to correct or deal with these situations. After the data treatment, the collected data is ready for further data analysis. In the modelling phase, Sentiment Analysis is applied following a specific set of steps. Finally, the implemented steps are evaluated to test the feasibility of the proposed implementation. With this evaluation, and depending on the obtained results, it can be considered the need of reviewing the first phase (business understanding), and the following ones, to improve the obtained results.
This paper is organised as follows. After the introduction, related work is summarised, providing an overview of the work already undertaken is this area. The architecture is then presented, following an incremental approach that shows the several tested design options. The implementation and validation with a demonstration case shows the usefulness of the proposed architecture for sentiment analysis. This paper ends with some conclusions and proposals for future work.
Several works have pointed the impact of the analysis of tweet data in real contexts. The work of (Asur & Huberman, 2010) focused on the analysis of movies premieres based on Twitter data, being able the achieve a model that predicts box-office revenues for movies. During three months, the authors collected tweets related to twenty-four different movies, using the movie title words. The authors did not put aside the fact that before the premiere, producers do marketing campaigns with videos, photos or even actors statements and that these marketing campaigns cause an increase in retweets, sharing tweets advertising. (Asur & Huberman, 2010) used two comparison points about sentiment analysis to understand the movie success or failure: tweet polarity and subjectivity value. The subjectivity value is the ratio between positive or negative movie tweets and the number of tweets classified as neutral (no explicit feeling associated). With this analysis, the authors found one trend: movie subjectivity increases after the movie release due to a solid opinion that is formulated after watching the movie, allowing users to classify more easily the success or failure of the film with positive or negative sentiments.
(Gebremeskel, 2011) presents another perspective about Twitter data uses: the news. Using appropriate APIs, the author collected two different datasets: neutral data (without any kind of feeling associated to tweets, being essentially collected from news agencies) and subjective data (tweets with positive or negative sentiments) supported by two emoticons sets (positive and negative emoticons). This last dataset was split by language, defining an English dataset (with tweets written only in English) and a dataset with tweets in other languages. Based on the collected data, the author tested supervised and unsupervised learning approaches to interpret the sentiments of those tweets. In the unsupervised one, the tweets were analysed considering the used keywords and were classified using dictionaries with positive and negative words, which were counted to assign to each tweet a positive or negative sentiment. In the supervised approach, machine-learning algorithms, such as Naive Bayes, were used to perform the same task. After analysing the obtained results, the author concluded that the last approach obtained better results than the first one.
In another study, the authors have focused on understanding implicit information on informal language (and sometimes creative language) frequently used in social networks and blogs. To do this, (Kouloumpis, Wilson, & Moore, 2011) used three different datasets: the first dataset, a set of tweets with hashtags, was collected from Twitter Edinburgh Corpus; the second dataset included tweets with positive or negative emoticons, rejecting those that contain both sentiments; finally, the third used dataset, named iSieve, has approximately 4000 tweets related with certain topics and the sentiment labelled in the tweet reflects the associated sentiment. The collected data were analysed having in mind three objectives: identify emoticons and abbreviations (replacing the abbreviations by its meaning), identify the reinforcing of sentiments (for example with the use of Caps Lock) and, finally, identify Twitter special terms: hashtags, users’ identifiers or URLs. Looking to the three objectives in an integrated way, the authors were able to conclude that for Twitter data analysis, the most useful approach and the one that shows better results includes the use of lexicons in combination with the analysis of abbreviations, emoticons and reinforcing words.
(Kumari, Singh, More, Talpade, & Pathak, 2015) also looked at tweets sentiments collecting data by a streaming process without any restrictions (geographical or language). After the data collection, the collected tweets were automatically translated into English using Google Translate. All tweets were tagged as positive, negative or neutral using machine learning algorithms and all these tweets were used to train a Naive Bayes and the obtained model was used to classify the test data. The obtained results showed that this approach was able to obtain good results in the classification of the tweets polarity.
Although several works were already proposed for the analysis of tweet data, they were very specific and did not proposed a generic architecture that could be used in a Big Data context to collect and analyse vast amounts of data. This architecture is required due to the growing use of the Internet and consequent increase in data volume and, because of that, it is not enough to have a sentiment analysis technique. This sentiment analysis technique must be supported by appropriate technologies, able to collect, store, process and analyse data in a timely fashion.
A BIG DATA ARCHITECTURE FOR SENTIMENT ANALYSIS
As already mentioned, this work proposes an architecture for Sentiment Analysis that uses data from the Twitter social network. The proposal of the architecture was preceded by the evaluation and analysis of several Big Data technologies in order to identify the more adequate Big Data components to include in the architecture, due to the amount and variety of data that can be daily collected. Part of this previous work was described and presented in (Andrade & Santos, 2015), collecting data from the Twitter social network.
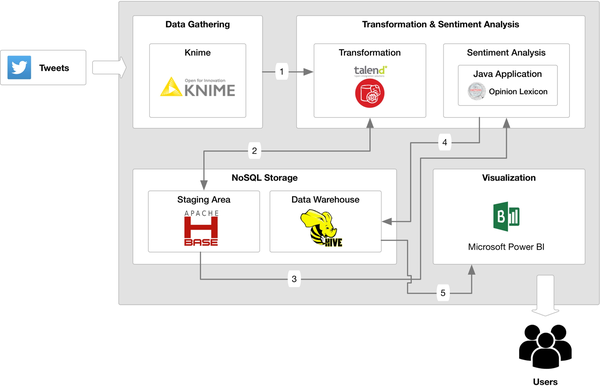
This preliminary version of the architecture (Figure 1) was tested in a demonstration case for the election of the “Word for 2014 in Portugal” (Andrade & Santos, 2015) and the data collection was performed using the Palladian tool from (KNIME, 2015), where it is possible to collect, in each call, until 10.000 historical tweets about the defined search words. In this case, the list of words was obtained from the Porto Editora conquest (Porto Editora, 2014). Depending on the word popularity it is possible to obtain more or less tweets when repeated calls of the data collection procedure are invoked.
| Figure 1. Preliminary version of the architecture (Adapted from: (Andrade & Santos, 2015)) |
|---|
|
All the data collected with KNIME are loaded into HBase (in a Cloudera (Cloudera, 2015) virtual machine) using Talend Open Studio for Big Data (Talend, 2015) (flows 1 and 2), being the key components for data management, since the automatic data collection process with KNIME causes data duplication. Using HBase with a key-value relationship allows the removal of repeated tweets, as the tweet itself is used as the key in the relationship. When this task is completed and the dataset is treated (flow 2), which is done using again the Talend Open Studio for Big Data (Talend, 2015), data come back to HBase where the polarities of the tweets are properly assigned (flow 3) by a specific routine developed in Java, which uses the words from the several lexicons. The final dataset is stored in Hive (flow 4) where it can be accessed by the Microsoft Excel Power BI (Power BI, 2014), being data analysis tasks performed using several charts integrated in specific dashboards (flow 5). Although this preliminary version of the architecture allowed the achievement of satisfactory results, it presented several drawbacks in the automatic data collection procedure, and in data processing and visualization. More details on the architecture, achieved results and limitations can be found in (Andrade & Santos, 2015).
The enhanced version of the architecture for Sentiment Analysis based on Big Data technologies aims to overcome some of the identified limitations and, more important, to give real-time characteristics to the architecture. As shown in Figure 2, the data collection is performed by streaming using the Twitter4J API (“Twitter4j”, 2007) (with specific code written in Java), being able to obtain tweets associated with specific words.
As data is collected, its processing is done in runtime (flow 1), associating to each tweet a sentiment (the feeling expressed by the user) taking into consideration the used lexicons. The tweets, now enriched with the corresponding sentiments, are loaded into HBase (flow2) for further analysis. As data is collected in real-time, and no recollection process takes place, the same twitter is not collected several times, as happened in the preliminary version of the architecture. For data analysis, this architecture uses several charts developed using Google Charts (Google, 2015), which are available through a web browser, allowing a detailed analysis of the collected and processed data (flow 3).
| Figure 2. Enhanced version of the architecture |
|---|
 |
At this point, it is important to recall that this enhanced version of the architecture adds real-time characteristics to the system. This means that tweets are collected as soon as they are published on the social network and, to each one of them, a sentiment represented by a polarity is associated. As data is refreshed in HBase as soon as it is collected, all analysis tasks use the most updated data.
Although benefiting from real-time characteristics, this enhanced version of the architecture presented limitations in data collection as reduced amounts of data were collected at the specified time frames. Moreover, and considering that HBase is more oriented for reading tasks, due to its key indexation, the aggregation of huge amounts of data for analysis tasks was compromised, delaying the visualization of results in the web browser.
In order to have an effective response in the web platform, a data aggregation step was added to the architecture, periodically aggregating the available data, causing no delays when the user requests data for analysis purposes. As presented in Figure 3, the tweets are collected, and stored in the staging area, using a specific table in HBase, being after that periodically aggregated using PIG (“Apache PIG”, 2015). The obtained aggregations are stored in another table in HBase that is accessed by the visualization component for data analysis purposes. This approach is similar to the one followed by Google Analytics (Chang et al., 2008), where a table with summarised data is obtained running periodic scheduled MapReduce (“Map Reduce”, 2013) jobs on the original data table, reducing the volume of data.
| Figure 3. Architecture for sentiment analysis in a big data context |
|---|
 |
Looking at Figure 3, the first identified data flow represents the data storage in HBase following a streaming procedure, where data is stored as soon as it is collected. After that, and from that table (flow 2), each tweet is treated and a polarity is assigned to it based on the chosen lexicons. In this general architecture, words in English were used in order to be possible the use of the available English lexicons, without the need of their translation for the identification of the polarity of the terms. The resulting data (with polarities) come back to the staging area to be stored in a new table and be aggregated by PIG queries (flow 3). After the aggregation, data is prepared to be available for the Web component (created with Bootstrap, PHP and Flot Charts) for data analysis and visualization (flow 4). All these steps and the technological details associated with the implementation and evaluation of this architecture are explained in the following section.
IMPLEMENTATION OF THE PROPOSED ARCHITECTURE IN A BIG DATA CONTEXT
This section presents the results obtained with the implementation of the proposed architecture in a Big Data context, testing several of its components with high amounts of data. This section starts with data collection and treatment, presenting also the followed sentiment analysis technique, making its evaluation and exhibiting the obtained results.
Data Collection and Treatment
To start the data collection process, it was necessary to define the list of search terms that guided the collection of tweets. For that, the list suggested by Cloud365 (Cloud365, 2015) was used in the implementation and validation of the architecture (Table 1). All the data was collected in a streaming process using the Twitter4J API, and for each term, the corresponding hashtag was defined and used for searching posts in Twitter. Each post integrates the text itself and has a set of associated attributes that allow the characterization of the tweet in terms of time, place, and user, among other attributes. Table 2 presents the several functions that can be used in the Twitter4J API, as well as the information that can be obtained from them. This information is very relevant in the sentiment analysis technique that will be implemented, as it gives semantic to the collected data.
Table 1. Search terms for the architecture implementation in a big data context
| Search Terms | Term Hashtag |
|---|---|
| Big Data | #bigdata |
| Cloud Computing | #cloudcomputing |
| Obama | #obama |
| Dead Combo | #deadcombo |
Table 2. Tweet associated attributes collected with Twitter4J API
| Twitter4J API Function | Associated Semantic | Type of Content |
|---|---|---|
| getText() | Tweet | Text |
| getFavoriteCount() | Tweet favourites count | Number |
| getRetweetCount() | Tweet retweets count | Number |
| isFavorited() | Was this tweet mark as a favourite by the user? | True or False |
| isRetweeted() | Was this tweet re-tweeted by the user? | True or False |
| isRetweet() | Is this tweet a re-tweet? | True or False |
| getCreateAt() | Tweet published date and time | Text |
| getGeoLocation() | Publication device geolocation | Text |
| getUser().getName() | Tweet publication user name | Text |
| getUser().getLocation() | City and/or country defined by the user as his/her residence | Text |
| getUser().getTimeZone() | Timezone associated with the user's location | Text |
| getUser().getLang() | User language | Text |
Taking into consideration the defined terms, the data collection, which results are presented in this paper, took place between September 28 and October 15, 2015, having only several hours of disruption due to the unavailability of the used computer. In total, 2.561.363 tweets were collected, and were stored into a HBase table, where the tweet itself was used as a key allowing the identification and removal of any duplications may exist, mainly due to double tweets posted in different publication’s seconds. This table ended with 2.097.001 records and its structure is presented in Table 3.
Table 3. HBase table structure: Staging area
| Table Name | Key | Column Family | Attributes |
|---|---|---|---|
| Tweet | tweet | Tweet IsRetweet IsFavorited IsRetweeted FavouriteCount RetweetCount | |
| user | UserName UserLang UserTimeZone UserLocation | ||
| other | Geolocation Date |
As tweets are texts in natural language that can be posted by the users, it was necessary to perform several data treatment tasks to clean and prepare the data for the sentiment analysis task. For these two million tweets, the performed data treatment tasks are presented in Table 4.
Table 4. Data treatment tasks preformed on tweets
| Case | Action on the Tweet | Extra Action |
|---|---|---|
| It contains substring “HTTP” | Remove the URL associated with the “HTTP” substring | Field “News” = true |
| It contains “RT” | Remove “RT” String | Field “Retweet” = true |
| It contains the “#” character | Remove “#” character | Field “Hashtag” = true; Field “TweetHashtag” = Duplication tweet with Hashtag |
| It contains the “@” character | Remove “@” character | Field “User” = true |
| The tweet is written in capital letters | Lowercase tweet transformation | Field “Capslock” = true |
| It contains quotes (“”) | Remove quotes (“”) | |
| It contains line breaks | Replace line breaks with spaces (“ ”) | |
| The tweet is not associated with the searched terms | Identify terms in the tweet | Field “Term”= term identified in the tweet |
All the data transformations presented in Table 4 are essential to ensure that special characters used in a social network context do not influence the polarity that will be assigned to the words. Some examples of this data treatment process can be seen in Figure 4.
| Figure 4. Before and after treatment data comparison |
|---|
 |
Although all these concerns, after the data transformation it was possible to verify that some of the attributes identified in Table 3 presented many missing values, compromising the possible analyses, or showed to be irrelevant for data analytics tasks. The identification of these situations was done and the definition of a set of unused attributes in the data analysis task was also performed (Table 5).
Table 5. Unused attributes in data analysis
| Field | Situation |
|---|---|
| UserLocation | Null value or filled with unidentifiable strings as countries or cities |
| UserName | Irrelevant for data analysis |
| UserLang | Register language on Twitter – it was considered irrelevant for data analysis |
| UserTimeZone | Filled with unidentifiable strings as time zones or cities without rule |
| IsFavorited IsRetweeted |
As the tweets were collected when published, all values were “False” because there was no time to be retweeted or favorited |
| FavoriteCount RetweetCount |
As happens in the previous field, all values were “0”. |
| GeoLocation | Most of the fields with a null value (mainly because device’s location be turned off) |
Sentiment Analysis Technique
For the implementation and evaluation of the proposed architecture in a Big Data context, all the collected tweets are written in English. This option allows the use of the original lexicons, with English words, without any change or translation, like the one occurred in the evaluation of the preliminary version of the architecture (Andrade & Santos, 2015). For the sentiment analysis technique, four lexicons were used: NRC Hashtag Sentiment Lexicon, Sentiment140 Lexicon, Opinion Lexicon for English and Text2Sentiment, which main characteristics are presented in Table 6.
Table 6. Lexicons and their characteristics
| Lexicon | Characteristics |
|---|---|
| NRC Hashtag Sentiment Lexicon Version 0.1 9 April 2013 (Mohammad, Kiritchenko, & Zhu, 2013) |
• Based on hashtags existing in tweets; • List of words with associated positive and negative sentiments; • Split into three files: unigrams-pmilexicon.txt (one term), bigrams-pmilexicon.txt (combination of two terms) and pairs-pmilexicon.txt (unigrams with bigrams); • Files contain: term sentiment (-5 to 5) and the number of times that the term is found with a positive or negative mark (hashtags or emoticons) – Example in Table 7; • Used files length: unigrams-pmilexicon.txt, 54.129 terms, and bigrams-pmilexicon.txt, 316.531 terms; • Referenced to in the document as: HSUni (unigrams) or HSBi (bigrams). |
| Sentiment140 Lexicon Version 0.1 9 April 2013 (Mohammad et al., 2013) and (Sentiment140, 2015) |
• List of words with positive and negative associated sentiments; • Split into three files: unigrams-pmilexicon.txt (one term), bigrams-pmilexicon.txt (combination of two terms) and pairs-pmilexicon.txt (unigrams with bigrams); • Files contain: term sentiment (-5 to 5) and the number of times that the term is found with a positive or negative mark (emoticons) – Example in Table 7; • Used files length: unigrams-pmilexicon.txt, 62.468 terms, and bigrams-pmilexicon.txt, 677.698 terms; • Referenced to in the document as: S140Uni (unigrams) or S140Bi (bigrams). |
| Opinion Lexicon for English (Liu & Hu, 2004) |
• List of words with positive and negative sentiments commonly used in social networks. To use this lexicon, has been assigned values to words polarity: 1 to positive words and -1 to negative words – Example in Table 7; • Split into two files: negative-words.txt and positive-words.txt. • Total terms number: 6.789; • Referenced to in the document as: OL. |
| Text2Sentiment (Warden, 2011) |
• List of words with positive or negative associated sentiments (-5 a 5) – Example in Table 7; • Number of terms: 2.477 – all terms in the same file; • Referenced to in the document as: T2S. |
Table 7. Words and polarities examples by lexicon
| Lexicon | Word Example | Polarity Example |
|---|---|---|
| Opinion Lexicon for English | safe aborted |
1 -1 |
| Text2Sentiment | important victimize |
2 -3 |
| Sentiment 140 Lexicon (Unigram) | dribbling seperate |
0.742 -0.42 |
| Sentiment 140 Lexicon (Bigram) | congrats dude rides home |
5.0 -0.643 |
| NRC Hashtag Sentiment Lexicon (Unigram) | #chinesefood #badhabit |
1.171 -1.718 |
| NRC Hashtag Sentiment Lexicon (Bigram) | chip cookies is addicted |
2.102 0.072 |
The assignment of the polarities by the use of lexicons was done using a routine in Java developed for that purpose. The data contained in each lexicon, words and their respective polarity, were stored in a HashMap where the search key corresponds to the word contained in the dictionary and where no changes to the dictionaries were made (words addition or deletion). To be possible the assignment of polarities, the following tasks were undertaken:
After completing all these tasks, tweets were classified with a polarity attending to each one of the used lexicons and, for that purpose, the following attributes were created: OL - Opinion Lexicon for English, T2S - Text2Sentiment, S140Uni - Sentiment140 Lexicon for unigrams, S140Bi - Sentiment140 Lexicon for bigrams, HSUni - NRC Hashtag Sentiment Lexicon for unigrams and HSBi - NRC Hashtag Sentiment Lexicon for bigrams. To each one of these attributes, the word Polarity was added, as exemplified in Figure 5.
| Figure 5. An example of data with the corresponding polarity |
|---|
 |
The polarity of a tweet is calculated considering the total number of positive words (PW) and the total number of negative words (NW) a tweet includes, considering the used lexicons, as follows:
One of the important measures in the implementation of the proposed architecture, namely in what concerns its ability to receive and process data in a real-time fashion, is the time each component needs to process large amounts of data. This will allow its use, or not, in a real environment. Using a single computer processing environment, with an Intel core i7, quad core, 8Gb of RAM, an SSD Disc and 5,5Gb of RAM dedicated to data processing, Table 8 presents the time needed to process the data (2 million records) using the different adopted lexicons.
| Figure 6. An example of data with PW and NW |
|---|
 |
Table 8. Computer time response in the assignment of polarities to tweets
| Lexicon | Response Time |
|---|---|
| Opinion Lexicon for English | 1 minute and 51 seconds |
| Text2Sentiment | 2 minutes and 36 seconds |
| Sentiment 140 Lexicon (unigram + bigram) | 4 minutes and 37 seconds |
| NRC Hashtag Sentiment Lexicon (unigram + bigram) | 6 minutes and 23 seconds |
Taking into consideration that this volume of data was achieved in about three weeks of continuous data collection, and that in a real scenario data can flows several times a day, data volume would be relatively smaller. Nevertheless, the list of terms to search could be higher, increasing the volume of data that could be collected. Considering that in every two hours it is necessary to process the volume of data that was collected in about three weeks, the total time needed to assign polarities would be around fifteen minutes, which is considered reasonable as the increase of the processing capabilities (number of machines) can drastically decrease this value.
As already mentioned in the previous section, after data treatment and having assigned the polarities to the tweets, the obtained data is stored in HBase. The new table created for this storage will be used in a data reduction task where duplicate tweets are merged. These duplications may appear after the removal, for instance, of an URL causing two or more tweets to be the same. In those cases, and as the tweet is used as the key in the HBase table, duplicate tweets are not stored. For the dataset under analysis, this lead to a total of 1.462.574 records stored in a table with the structure presented Table 9. Figure 7 presents an extract of this table in the HBase virtual machine environment. In the structure presented in Table 9 it is possible to see all the attributes that were defined to store the polarity of the tweets. It is also important to mention that all the attributes considered not relevant for the data analysis task, were not stored in this table.
Table 9. HBase table with polarities of the data
| Table Name | Key | Column Family | Data Stored |
|---|---|---|---|
| TwitterData | Tweet | tweet | Tweet TweetHashtag Retweet Hashtag Capslock User News |
| polarity | PolarityOL PWOL NWOL PolarityT2S PWT2S NWT2S PolarityS140Uni PWS140Uni NWS140Uni PolarityS140Bi PWS140Bi NWS140Bi PolarityHSUni PWHSUni NWHSUni PolarityHSBi PWHSBi NWHSBi |
| Figure 7. HBase table view with the polarities of the data |
|---|
 |
The volume of data can be, as already seen, substantially reduced after the data treatment task. In order to understand why this reduction happens and also to validate the undertaken work, an example will be presented. Figure 8 shows three tweets that were selected from the original dataset. In this figure, it is possible to see that these are three tweets with the exact same text only changing the link (URL) at the end of the message. The tweets were posted at the same time and, it seems, by the same user, but using different Twitter accounts. In this case, and in the context of this work, it is considered that it is irrelevant to analyse the three tweets, as all the words are the same, equally identified in the lexicons, resulting in an equal polarity and in the same expressed sentiment. This is why data treatment is so important and, in the case of URL removal, it provides a considerable reduction in the data volume for analysis.
| Figure 8. Example in data volume reduction for analysis |
|---|
 |
Before proceeding with the data aggregation and data analysis tasks, it is important to understand if the polarities assigned to the tweets correspond to the sentiments expressed by the users. As polarities are assigned in an automatic way through the use of the lexicons, and as users may express their sentiments in a sarcastic way, 400 tweets were randomly selected and were classified as positive, negative or neutral by 2 independent collaborators with different academic background. The obtained classifications are presented in Table 10, which compares the human classification with the different lexicons classification. For the sake of clarity, all positive polarities [1,5] are identified in the Positives column and all the negative polarities [-5, -1] in the Negatives column. The Performance column states the number of tweets equally classified as negative, neutral or positive, and the corresponding percentage.
Table 10. Tweets classification evaluation
| Neutral | Positives | Negatives | Performance | |
|---|---|---|---|---|
| Human Classification | 225 | 57 | 118 | |
| Opinion Lexicon for English | 241 | 94 | 65 | 217 (54%) |
| Text2Sentiment | 196 | 128 | 76 | 209 (52%) |
| Sentiment 140 Lexicon (Unigram) | 16 | 281 | 103 | 118 (30%) |
| Sentiment 140 Lexicon (Bigram) | 48 | 217 | 135 | 140 (35%) |
| NRC Hashtag Sentiment Lexicon (Unigram) | 15 | 135 | 250 | 157 (39%) |
| NRC Hashtag Sentiment Lexicon (Bigram) | 59 | 147 | 194 | 143 (36%) |
With the results presented in Table 10 it is possible to verify that, when comparing human classification with the lexicons classification, only Opinion Lexicon for English and Text2Sentiment show more than 50% of convergence, with more than 200 tweets equally classified. Although 400 tweets is a small number when compared with the 2 million available, it was possible to verify that most of the divergence appears in the neutral tweets, being human more suited to rank a tweet as neutral, while some of the lexicons classify as positive or negative. Increasing the number of human resources to classify tweets and learn from this process, as well as improving lexicons to deal with sarcasm, for instance, could help to improve the classification process. This, however, does not affect the proposed architecture, as the use of different or improved lexicons is not a limitation.
Data Aggregation and Analysis
In order to perform the analysis of the treated data, it was necessary to aggregate the data in order to make this process efficient. PIG carried out this task where, using various programmed queries, it was possible to obtain aggregated information of data polarities, as well as other summarized information about the tweets, as the total number of retweets, hashtags, among others, grouped by term. Figure 9 presents an example of one of these PIG queries. In this case, it calculates the average, maximum and minimum aggregated values for the Sentiment 140 lexicon polarities, following the procedure:
| Figure 9. PIG query - example of polarities aggregation for Sentiment140 lexicon |
|---|
 |
The remaining queries follow the same pattern in terms of development, being used for calculating the aggregated data by term considering the:
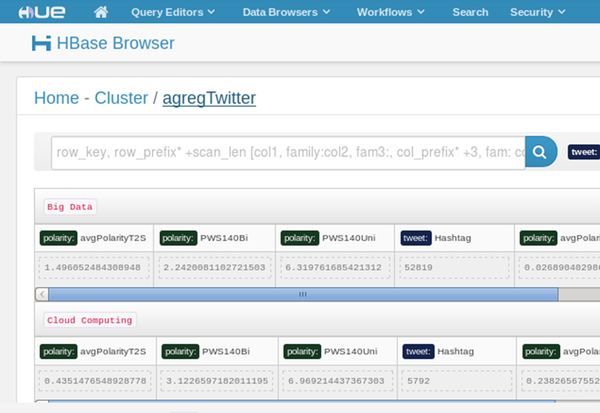
The result of the implementation of all queries was stored in a new HBase table, as already mentioned, the “agregTwitter”, where the key is the searched term as the aggregation of the data was centred in it. These aggregation queries showed runtimes of about 10 minutes, which is reasonable considering the used processing environment. The structure adopted for this table is presented in Table 11, where it is possible to verify that, besides the characterization of the tweet, all the aggregations by term are also stored. Figure 10 presents another perspective of this table, now in the implementation environment of HBase.
Table 11. Structure of the aggregated data table - “agregTwitter”
| Table Name | Key | Column Family | Stored Data | |
|---|---|---|---|---|
| agregTwitter | Term | tweet | TermCount RetweetsCount HashtagCount NewsCount CapslockCount UserCount | |
| polarity | avgPolarityOL minPolarityOL maxPolarityOL avgPWOL avgNWOL avgPolarityT2S minPolarityT2S maxPolarityT2S avgPWT2S avgNWT2S avgPolarityS140Uni minPolarityS140Uni maxPolarityS140Uni avgPWS140Uni avgNWS140Uni |
avgPolarityS140Bi minPolarityS140Bi maxPolarityS140Bi avgPWS140Bi avgNWS140Bi avgPolarityHSUni minPolarityHSUni maxPolarityHSUni avgPWHSUni avgNWHSUni avgPolarityHSBi minPolarityHSBi maxPolarityHSBi avgPWHSBi avgNWHSBi | ||
| Figure 10. View of the aggregated data table - “agregTwitter” |
|---|
 |
After data aggregation, data was analysed in the implemented Web platform, based on Bootstrap (“Bootstrap,” 2015) and Flot Charts (“Flot Charts,” 2014). Data is initially presented in a card format with the total number of collected tweets by searched term as shown in Figure 11. A huge difference can be seen, where the term with more records is “Obama” with more than 90% of the tweets associated with it. This can be explained by the popularity associated to a public figure. The two terms “Big Data” and “Cloud Computing”, although technical terms in the IT area, also present differences between them. The latter (“Dead Combo”) is a Portuguese musical band and, being tweets collected in English, the number of obtained tweets is very small. In this case, it can be questioned if this term should be included, or not, in this list. Considering that the band itself writes in English on Twitter and that this list is an example for demonstration and validation purposes, it is relevant to see the different results that can be obtained.
| Figure 11. Number of total records per term |
|---|
 |
| Figure 12. Tweets information |
|---|
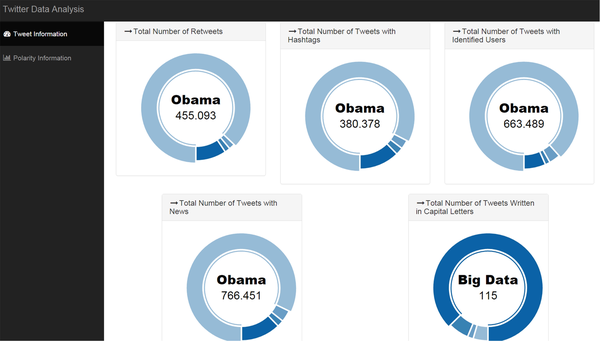 |
As explained earlier when PIG queries were presented, those queries created four records, one per term, with aggregated data. Analysing the information on these aggregates, Figure 12 shows that the term “Obama” appears again as the one with more information, either in the number of retweets, hashtags, users and news. The term “Big Data” is the one most cited in Caps Locks.
When analysing the polarities and the respective positive or negative sentiments, Figure 13 shows the general perception about each term, based on the different adopted lexicons. For the most technical terms, “Big Data” or “Cloud Computing”, five of the six lexicons give a positive polarity to them and, to the terms “Obama” and “Dead Combo”, four dictionaries give negative polarities to the “Obama” word and two dictionaries also give a negative polarity to the “Dead Combo” band, attending to the texts expressed on the analysed tweets. Furthermore, in this figure it is also possible to see that the lexicon that assigns more subjectivity to the tweets is the NRC Hashtag Sentiment Lexicon (unigram version) where polarities, whether positives or negatives, are further away from the neutral value (the fifth bar in each term on Figure 13). Continuing with subjectivity, the term that is more positive or negative, with regard to the neutral point, is “Cloud Computing”, where lexicons more unanimously classify tweets with higher positive or negative polarities.
| Figure 13. Sentiments expressed in the analysed tweets |
|---|
 |
To conclude the presentation of the obtained results, the analysis of the positive and negative number words identified by unigrams and bigrams lexicons, with respect to each term, is shown in Figure 14. This analysis is split by lexicon and by unigrams/bigrams. In overall, more positive words (the first and the third bar of each term) than negative words (the second and the fourth bar of each term) are identified. It is also recognizable that the unigrams versions (the first and the second bar of each term) of the two dictionaries are able to identify more words than bigrams dictionaries (the third and the fourth bar of each term), as unique words are more easily identified (unigram) than sets of two words (bigram).
| Figure 14. Positive and Negative words identified by lexicons |
|---|
 |
It should also be noted that this same analysis was performed for the two other dictionaries (Opinion Lexicon for English and Text2Sentiment) but, due to the reduced number of words they were able to identify, comparing with the other two lexicons (Sentiment140 and NRC Hashtag Sentiment), the results are not here presented. In average, the positive or negative values identified in those cases did not exceed the 1,5 value.
This paper presented an architecture for sentiment analysis in a big data context, where it is expected to collect data in a real-time fashion and be able to store, process and analyse that data. The presented proof-of-concept validates the proposed architecture and shows the contribution of this work for the collection and treatment of non-structured data, with the aim of performing Sentiment Analysis. Besides this theoretical proposal, the presented work also shows how several Big Data technologies can be integrated in a practical scenario and be used for sentiment analysis. In this sense, the architecture included common technologies used in Big Data, like Hadoop, HBase or Pig. To complement these technologies, tools for data cleaning, like the Talend Open Studio for Big Data, or Java for developing specific routines, were used. For data analysis and visualization, several charts were developed using a Web Platform with Flot Charts.
The proposed architecture was implemented and tested in a real scenario where data collected from the Twitter social network were analysed. In a context where more than 2 million records were collected, the implemented components showed appropriate response times, considering a processing environment integrating a single machine with Hadoop in a virtual context. As a proof-of-concept, it was possible to verify the adequacy of all components and the ability of the system to interpret and to show the sentiments expressed by the users of the posted tweets.
Regarding the used lexicons, for interpreting the expressed sentiments, satisfactory results were obtained with the use of available dictionaries (for unigrams and bigrams) that integrate a considerable number of words or pairs of words, which facilitated the task of assigning sentiments to the collected data.
Although the vast number of available words in the lexicons, it is difficult to analyse texts in which users use sarcastic expressions. This is one of the issues that is important to analyse in future work, as the study of contradictory expressions was not here covered and was found to be one of the issues that more errors can raise in the assignment of polarities through the use of lexicons, as humans can interpret the contradiction in words and give to each tweet its true meaning.
Another proposal for future work is the use of abbreviations, including appropriate lexicons, as abbreviations are commonly used in social networks mainly due to the limits imposed to the number of characters that can be used.
This research was previously published in the International Journal of Technology and Human Interaction (IJTHI), 13(3); edited by Anabela Mesquita and Chia-Wen Tsai; pages 47-67, copyright year 2017 by IGI Publishing (an imprint of IGI Global).
This work was supported by COMPETE: POCI-01-0145-FEDER-007043 and FCT – Fundação para a Ciência e Tecnologia within the Project Scope: UID/CEC/00319/2013, and funded by Cloud365, Lda. Besides, some of the figures in this paper use icons made by Freepik from www.flaticon.com.
Andrade, C., & Santos, M. (2015). O Twitter como agente facilitador de recolha e interpretação de sentimentos: Exemplo na escolha da palavra do ano (in Portuguese). In Atas da 15ª Conferência da Associação Portuguesa de Sistemas de Informação (15th Conference of the Portuguese Association of Information Systems). ISCTE Instituto Universitário de Lisboa, Portugal.
ApachePIG. (2015). Retrieved from https://pig.apache.org/
Asur, S., & Huberman, B. A. (2010). Predicting the Future with Social Media. Proceedings of the 2010 IEEE/WIC/ACM International Conference on Web Intelligence and Intelligent Agent Technology (WI-IAT) (Vol. 1, pp. 492–499). doi:10.1109/WI-IAT.2010.63
Bootstrap. (2015). Retrieved from http://getbootstrap.com/
Chang, F., Dean, J., Ghemawat, S., Hsieh, W. C., Wallach, D. A., & Burrows, M. … Gruber, R. E. (2008). Bigtable: A Distributed Storage System for Structured Data. ACM Trans. Comput. Syst., 26(2), 4:1–4:26. doi:10.1145/1365815.1365816
Chapman, P., Clinton, J., Kerber, R., Khabaza, T., Reinartz, T., Shearer, C., & Wirth, R. (2000). CRISP-DM 1.0 - Step-by-step data mining guide (Relatório Técnico) . SPSS.
Cloud365. (2015). Cloud365. Retrieved from http://www.cloud365.pt/default.aspx
Cloudera. (2015). Cloudera. Retrieved from http://www.cloudera.com/
Flot Charts. (2014). Retrieved from http://www.flotcharts.org/
Gebremeskel, G. (2011, February 28). Sentiment Analysis of Twitter posts about news. University of Malta.
Google. (2015). Google Charts. Retrieved from https://developers.google.com/chart/
KNIME. (2015). KNIME. Retrieved from https://www.knime.org/
KouloumpisE.WilsonT.MooreJ. (2011). Twitter Sentiment Analysis: The Good the Bad and the OMG! Presented at the Fifth International AAAI Conference on Weblogs and Social Media.
Kumari, P., Singh, S., More, D., Talpade, D., & Pathak, M. (2015). Sentiment Analysis of Tweets. International Journal of Science Technology & Engineering, 1(10), 130–134.
Liu, B., & Hu, M. (2004). Opinion Mining, Sentiment Analysis, and Opinion Spam Detection. Retrieved from http://www.cs.uic.edu/~liub/FBS/sentiment-analysis.html
Map Reduce. (2013). Retrieved from https://hadoop.apache.org/docs/r1.2.1/mapred_tutorial.html
Mohammad, S. M., Kiritchenko, S., & Zhu, X. (2013). NRC-Canada: Building the State-of-the-Art in Sentiment Analysis of Tweets. Retrieved from http://arxiv.org/abs/1308.6242
Pang, B., & Lee, L. (2008). Opinion Mining and Sentiment Analysis. Found. Trends Inf. Retr., 2(1–2), 1–135. doi:10.1561/1500000011
Porto Editora. (2014). De banco a xurdir, eis as candidatas a PALAVRA DO ANO 2014. Retrieved from http://www.portoeditora.pt/imprensa/noticia/ver/de-banco-a-xurdir-eis-as-candidatas-a-palavra-do-ano-2014?id=31982
Microsoft Power BI. (2014). Power BI Desktop. Retrieved January 9, 2016, from powerbi.microsoft.com
Sentiment140. (2015). For Academics - Sentiment140 - A Twitter Sentiment Analysis Tool. Retrieved from http://help.sentiment140.com/for-students
Talend. (2015). Talend Open Studio for Big Data. Retrieved from https://www.talend.com/products/big-data
Twitter4j - A Java library for the Twitter API. (2007). Retrieved from http://twitter4j.org/en/index.html
Warden, P. (2011). Text2sentiment Words. Retrieved from https://github.com/petewarden/dstk/blob/master/text2sentiment.rb