According to WHO, there are 60 - 80 million infertile couples worldwide with the highest incidence in some regions of Sub-Saharan Africa. The social stigma of infertility weighs especially heavily on women, who bear the sole blame for barren marriages in many developing countries and may face divorce as a result. Interviews were conducted with gynecologists at one of the Teaching Hospitals in Nigeria in order to identify likelihood variables for infertility. 14 risk factors were identified and data collected from 39 patients from the hospital was pre-processed and the variables used to formulate the predictive model for the likelihood of infertility in women using three different decision trees algorithms. The predictive model was simulated using WEKA environment. The results revealed that C4.5 algorithm had the highest accuracy of 74.4% while the least performance was for the random tree algorithm with a value of 53.8%. This chapter presents a predictive model which can assist gynecologists in making more objective decisions concerning infertility likelihood.
The goal of data mining is to learn from data and the strategy used may vary as per the requirement (Yap et al., 2007). Data mining is an interdisciplinary field and is gaining popularity because of exploring Database technology, Information Science, Machine Learning and Neural Networks along with Statistical techniques. This study aims at applying data mining techniques to clinical data in order to predict the likelihood of infertility in Nigerian women.
Infertility is defined as one year of frequent, unprotected intercourse during which pregnancy has not occurred (Zegers-Hochschild et al., 2009). In another definition, infertility is the inability of a sexually active woman who is not practicing contraception to have a live birth (American Society for Reproductive Medicine (American Society for Reproductive Medicine (ASRM), 2008). Infertility can be attributed to any abnormality in the female or male reproductive system (European IVF-Monitoring Consortium, 2008). The etiology is mostly distributed fairly equally among the male and female with factors ranging from ovarian dysfunction, tubal factors amongst others. A smaller percentage of cases are attributed to endometriosis, uterine or cervical factors, or other causes. In approximately, one fourth of couples, the cause is uncertain and is referred to as unexplained infertility, while etiology is multifactorial for some couples (Puscheck & Woodad, 2009). Developed and developing societies tend to differ in prevailing assumptions about childlessness while in developed societies, voluntary childlessness is viewed as a more viable and legitimate option and women without children are often presumed to be voluntarily childfree (ASRM, 2006).
Infertility is a worldwide problem, affecting 8% – 15% of the couples in their reproductive age (Puscheck & Woodad, 2009; Boivin et al., 2009; Audu et al., 2003). WHO estimates that there are 60 - 80 million infertile couples worldwide with the highest incidence in some regions of Sub-Saharan Africa which is said to have an infertility belt warped around its center as infertility rate may reach 50% compared to 20% in Eastern Mediterranean Region and 11% in the developed world (Okonofua, 1996). In some parts of this belt, infertility is said to constitute up to 65% of gynecological consultations (Idrisa, 2005). Early exposures (e.g. in utero or in childhood) could permanently reprogram men and women for fecundity or biologic capacity (e.g. gynecologic and urologic health or gravid health during pregnancy) and fertility outcomes (e.g. multiple births or gestational age at delivery) which could affect adults later on set diseases (Skakkebaek et al., 2001). Thus, infertility could have public health implications beyond simply the inability to have children.
In general, an infertility evaluation is initiated after 12 months of unprotected intercourse during which pregnancy has not been achieved. Earlier investigation may be considered when historical factors, such as previous pelvic inflammatory disease or amenorrhea suggest infertility, although physicians should be aware that earlier evaluation may lead to unnecessary testing and treatment in some cases. Evaluation can be initiated earlier if the female partner is older than 35 years, because fertility rates decrease and spontaneous miscarriage and chromosomal abnormality rates increase with advancing maternal age (Puscheck & Woodad, 2009). Partners can be evaluated together or separately which can be due to the fact that each person may want to reveal information which their partner may be unaware of, such as previous pregnancy or sexually transmitted disease.
The risk factors for infertility can be classified into: genital, endocrinal, developmental and general factors. Pelvic inflame ematory disease (PID) due to sexually transmitted diseases, unsafe abortion, or puerperal infection are the main causes of tubal infertility caused mainly by chlamydial infection. Polycystic ovarian syndrome (PCOS) is thought to be the commonest cause of an ovulatory infertility. Several lifestyle factors may affect reproduction, including habits of diet, clothing, exercise, and the use of alcohol, tobacco and recreational drugs. Exposure to textile dyes, lead, mercury and cadmium, volatile organic solvents and pesticides has been also associated with infertility. Estimates of the proportion of infertility cases attributable to male or female specific factors in developed countries were derived in the 1980s by the WHO: 8% of infertility cases were attributable to male factors, 37% to female factors, 35% to both the male and female, and 5% to an unknown cause (the remaining 15% became pregnant) (Zegers-Hochschild et al., 2009).
Data mining is the process of extracting patterns from data; these patterns may be discovered depending on the data mining tasks that are applied on the dataset (Gupta et al., 2011). Discovering knowledge in medical systems and health care scenarios is a herculean yet critical task (Bennett & Duob, 2010). Knowledge discovery (Cabena et al., 1997; Zhu & Davidson, 2007) describes the process of automatically searching large volumes of data for patterns that can be considered additional knowledge about the data (Mishra et al., 2010). The knowledge obtained through the process may become additional data that can be used for further manipulation and discovery (Desikan & Hsu, 2011). Clinical data mining is the application of data mining techniques using clinical data. It involves the conceptualization, extraction, analysis, and interpretation of available clinical data for practical knowledge-building, clinical decision-making and practitioner reflection (Gupta et al., 2011). The main objective of clinical data mining is to haul new and previously unknown clinical solutions and patterns to aid the clinicians in diagnosis, prognosis and therapy (Tan et al., 2005).
The basis for any data mining framework involves preliminary learning phase during which the problem is modeled followed by the test phase that validates the constructed model. The learning process can be accomplished either in a Supervised or Unsupervised manner (Vanneschi et al., 2011). Supervised learning (Idowu et al., 2015) requires the training data to be accompanied by class labels and the test data is classified based on the training set, whereas in unsupervised learning, the class label is unknown and the aim is to establish the existence of clusters or classes in the data. The models required to mine data are classified into Predictive and Descriptive models. Clusters, Feature Selection and Association rules are descriptive while classification and regression models are predictive models.
Predictive research aims at predicting future events or outcomes based on patterns within a set of variables and have gained popularity in medical research (Toll et al., 2008). Accurate predictive models can inform patients and physicians about the future course of an illness or the risk of developing an illness and thereby help guide decisions on screening and/or treatment. There are several important differences between traditional explanatory research and prediction research. Explanatory research typically applies statistical methods to test causal hypothesis using priori theoretical constructs (Singal et al., 2013a; Singal et al., 2012). In contrast, prediction research applies statistical methods and/or data mining techniques, without preconceived theoretical constructs to predict future outcomes (Singal et al., 2013b; Moons et al., 2009). A number of different techniques to develop predictive algorithms exist, using a variety of predictive tools/software (Waijee & Wiggins, 2010; Siegel et al., 2011); some examples include artificial neural networks, support vector machines, decision trees, naïve bayes, etc.
An efficient predictive model for predicting the likelihood of infertility in Nigerian women based on identified relevant causal variables using decision trees algorithm has been proposed in this paper. In addition, simple rules were induced from the decision tree structure proposed in order to assist the gynecologist in easily identifying infertility likelihood.
Related Work
There exist a number of literatures in the application of machine learning algorithms to the development of prediction models in the area of infertility and sterility related research. Related work has been discovered to be limited to the area of In-Vitro Fertilization (IVF) studies, sperm motility and likelihood of pregnancy etc. A number of the related work reviewed is as follows.
Girija & Shashidhara (2012), developed a predictive model for the classification of women health disease (fibroid) using decision trees algorithm. Data was collected from three (3) classes of people (no fibroid, mild condition and sever condition) and eight (8) features were used in developing the proposed predictive model. The results showed that the C4.5 decision trees algorithm implemented as J48 on WEKA was able to select two (2) important features as predictive for fibroid in women; the features selected were: the age of the patient and signs of heavy bleeding. The evaluation of the performance of the predictive model had a value of 56%.
Durairaj & Thamilselvan (2013), applied artificial neural networks for In Vitro Fertilization (IVF) data analysis and prediction with the aim of detecting the success rate of IVF. Data collected from patients (couples) containing information about the endometriosis, tubal factors and follicles in the ovaries, body mass index, sperm concentration, duration of infertility, embryos transferred and the physiological factors such as stress levels were used to develop the predictive model needed for the prediction of the success rate of IVF. The results showed that the prediction model developed using the identified variables had a correlation coefficient (r) of 0.498 with an accuracy of 75%.
Girela et al. (2013) applied artificial intelligence using machine learning algorithms to predict semen characteristics resulting from environmental factors, life habits and health status in order to develop a decision support system that can help in the study of male fertility potential. Semen samples collected from 123 young, healthy volunteers were analyzed and information regarding their life habits and health status was collected using a questionnaire. Sperm concentration and percentage of motile sperm were related to socio-demographic data, environmental factors, health status, and life habits in order to determine the predictive accuracy of the multi-layer perceptron network model developed. The results showed that the most important semen parameter is the sperm concentration with an accuracy of 90%, sensitivity of 95.45% and specificity of 50%.
Uyar et al. (2014) developed a predictive model for the outcome of implantation in an In Vitro Fertilization (IVF) setting using machine learning methods. The paper was aimed at predicting the outcome of implantation of an individual embryo in an IVF cycle in order to provide decision support on the number of embryos transferred. Electronic health records from 2453 embryos transferred at day 2 or day 3 after intracytoplasmic sperm injection (ICSI). Each embryo was identified using eighteen (18) clinical features and a class label (indicating positive and negative implantation outcomes). Naïve Bayes’ classifier was used to train the predictive model using 66.7% for training and the rest for testing over 10 runs and the evaluation of the performance showed a value of 80.4% for accuracy, 63.7% for sensitivity (true positive (TP) rate) and 17.6% for the false positive (FP) rate (1 – specificity).
Idowu et al. (2015) developed a predictive model for the likelihood of infertility in Nigerian women using the multi-layer perceptron (MLP) architecture of artificial neural network using three sets of clinical variables: personal profiles, medical and surgical history and gynecological history. Using a filter-based feature selection algorithm (consistency subset evaluator), six (6) relevant features were identified out of the fourteen (14) identified variables selected. A comparison of the performance of the predictive model developed was done using all fourteen (14) variables and the selected six (6) relevant variables – three different training methods was used: full dataset, percentage proportion (66% for training and 37% for testing) and 10-fold cross validation. The results of the comparison showed that using the full training set over-fitted the predictive model developed while the performance of the predictive model developed was shown to improve using the reduced feature set compared to using the whole 14 features. The accuracy of the developed model was observed to be 74.36% before and after feature selection using the 10-fold cross validation training method but improved from 69.23% (before feature selection) to 76.92% (after feature selection) using the percentage proportion training method.
Data Collection
For the purpose of this study, it was necessary to identify and collect the data needed for identifying infertility in women from gynecologist located at a University Teaching Hospital in south-western Nigeria. The variables identified include: age of menarche, age of marriage, family history of infertility, menstrual cycle, diabetes mellitus, hypertension, thyroid disease, pelvi-abdominal operation, endometriosis, fibroid disease, polycystic ovary, genital infection, previous termination of pregnancy, Sexually Transmitted Infection (STI) and the likelihood of infertility (identified using the labels: Likely, Unlikely and Probably) (Table 1). Data was collected from a total of 39 patients with a description of the variables in the dataset stated as follows:
Table 1. Identified variables for determining infertility
| S/N | Class of Risk | Risk Factors/Considered Parameters (Points) | Labels (Points) |
|---|---|---|---|
| 1. | Personal Profiles | Age of Menarche | ≤15 yrs or >15 yrs |
| 2. | Age of Marriage | ≤30 yrs or >30 yrs | |
| 3. | Family History of infertility | Yes or No | |
| 4. | Menstrual cycle | Regular or Irregular | |
| 5. | Medical and Surgical history | Diabetes Mellitus | Yes or No |
| 6. | Hypertension | Yes or No | |
| 7. | Thyroid | Yes or No | |
| 8. | Pelvi-abdominal operation had | Yes or No | |
| 9. | Gynecological history | Endometriosis | No or Yes |
| 10. | Fibroid | No or Yes | |
| 11. | Polycystic Ovary | No or Yes | |
| 12. | Genital Infection | No or Yes | |
| 13. | Sexually transmitted Infection (STI) | No or Yes | |
| 14. | Previous termination of pregnancy | No or Yes |
Data-Preprocessing
Following the collection of data from the required respondents; 39 patients with their respective attributes (14 infertility risk indicators) alongside the likelihood of infertility was identified. In addition, the task of data cleaning for noise removal (errors, misspellings etc.) and missing data were performed on the information collected from the health records. Following this process, all data cells describing the attributes (fields) of each patient were found to be filled. No missing data were found in the repository and all misspellings were corrected.
In order for the dataset collected to be fit for the simulation environment; the dataset was converted to a more compactible data storage format. This would make the dataset fit for all the necessary machine learning operations performed by the simulation environment. Important to the study is the ability of the machine learning techniques to identify the most important combination of features that are more likely to improve the predicting the likelihood of infertility.
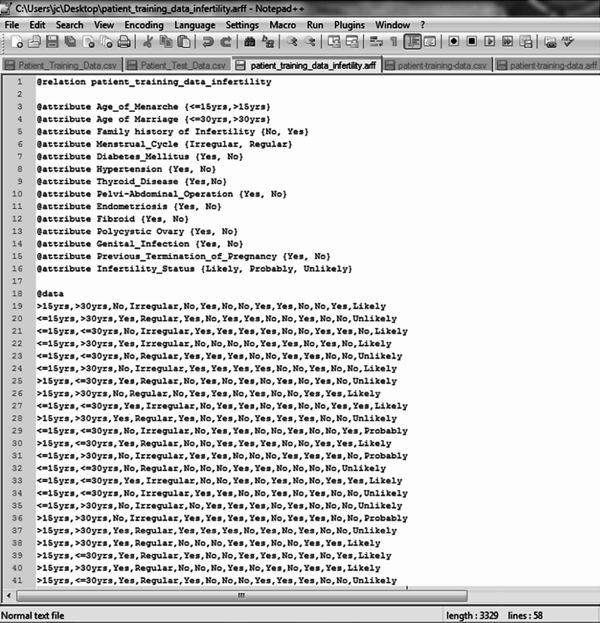
The dataset collected was converted to the required format needed for simulation; the Waikato Environment for Knowledge Analysis (WEKA) called the attribute relation file format (.arff) – a light-weight java application with a number of supervised and unsupervised machine learning tools. This format allows for the formal identification of the file name, attribute names and labels alongside the dataset that correspond to each attribute expressed using their respective labels. Figure 1 shows the format of the .arff file format chosen for the formal representation of the dataset using the 39 patient data collected.
| Figure 1. .arff file containing identified attributes |
|---|
|
Model Formulation
Systems that construct classifiers are one of the commonly used tools in data mining. Such systems take as input a collection of cases, each belonging to one of a small number of classes and described by its values for a fixed set of attributes, and output a classifier that can accurately predict the class to which a new case belongs. Supervised machine learning algorithms make it possible to assign a set of records (infertility risk indicators) to a target classes – the risk of infertility (Unlikely, Likely and Benign).
Supervised machine learning algorithms are Black-boxed models, thus it is not possible to give an exact description of the mathematical relationship existing among the independent variables (input variables) with respect to the target variable (output variable – risk of infertility). Cost functions are used by supervised machine learning algorithms to estimate the error in prediction during the training of data for model development. Gradient decent and other related algorithms are used to reduce the error by estimating cost function parameters.
The theory of a decision tree has the following parts: a root node is the starting point of the tree; branches connect nodes showing the flow from question to answer. Nodes that have child nodes are called interior nodes. Leaf or terminal nodes are nodes that do not have child nodes and represent a possible value of target variable given the variables represented by the path from the root. The rules are inducted by definition from each respective node to branch to leaf (Chaurasia et al., 2012).
The basic idea of decision tree analysis is to split the given data set into subsets by recursive portioning of the parent node into child node based on the homogeneity of within – node instances or separation of between-node instances with respect to target variables. For each node, attributes are examined and the splitter is chosen to be the attribute such that after dividing the nodes into child nodes according to the value of the attribute variable, the target variable is differentiated to the best using algorithm. Because of this, there is the need to distinguish between important attributes, and attributes which contribute little to overall decision process. Splitting points attribute variables and values of chosen variables are chosen based on Gini impurity and Gini gain as expressed below by (Chaurasia et al., 2012):


where f(t,i) is the probability of getting i in node t, and the target variable takes values in {1, 2, 3… m}. PL is the proportion of cases in node t divided to the left child node and PR is the proportion of cases in t sent to the right child node. If the target variable is continuous, the split criterion is used with the Least Squares Deviation (LSD) as impurity measure. If there is no Gini gain or the preset stopping rule are satisfied, the splitting process stops. Given a set S of cases, C4.5 first grows an initial tree using the divide-and-conquer algorithm as follows:
The pseudo-code for the decision tree Induction is shown as follows:
START
DTree(examples, features) returns a tree
If all examples are in one category then return a leaf node with that category label.
Else if the set of features is empty then return a leaf node with the category label that is the most common in examples
Else pick a feature F and create a node R for it
For each possible value vi of F:
Let examplesi be the subset of examples that have value vi for F
Add an out-going edge E to node R labeled with the value vi
If examplesi is empty then attach a leaf node to edge E labeled with the category that is the most common in examples.
Else call DTree(examplesi, features – {F}) and attach the resulting tree as the sub-tree under edge E.
Return the sub-tree rooted at R.
END
ID3 Decision Trees Algorithm
ID3 (Iterative Dichotomiser 3) developed by Quinlian (1993) is a classification tree used in the concept of information entropy. This provides a method to measure the number of bits each attribute can provide, and the attribute that yields the most information gain becomes the most important attribute and it should go at the top of the tree. Repeat this procedure until all the instances in the node are in the same category.
In this study, there are three outcomes, namely: Likely (u1), Unlikely (u2) and probably (u3) in the root node T of target variable. Let u1, u2 and u3 denote the number of probable, unlikely and likely records, respectively. The initial information entropy is given by as:

If attribute X (a risk indicator of infertility) with values {x1 and x2} is chosen to be the split predictor and partition the initial node into {T1, T2, T3… TN}, and u1, u2 and u3 denote the number of probable, unlikely and likely records in the child node j. The expected information EI(X) and information gain G(X) are given by and:

and information gain is defined as:
G(X) = I(u1,u2,u3) – EI(X).
C4.5 Decision Trees Algorithm
In 1993, Ross Quinlan made several improvements to ID.3 and extended it to C4.5 (Quinlan, 1993). Unlike ID.3 which deals with discrete attributes, C4.5 handles both continuous and discrete attributes by creating a threshold to split the attribute into two groups, those above the threshold and those that are up to and including the threshold. C4.5 also deals with records that have unknown attribute values. C4.5 algorithm used normalized information gain or gain ratio as a modified splitting criterion of information gain which is the ratio of information gain divided by the information due to the split of a node on the basis of the value of a specific attribute. The reason of this modification is that the information gain tends to favor attributes that have a large number of values.
The best approach in selecting the attribute for a specific node is to choose the one that maximize the given ratio. Stopping rule of C4.5 needs to be pre-specified and it initiated a pruning procedures by replacing branches that do not help with leaf nodes after they are created to decrease overall tree size and the estimated error of the tree. A rule set can be derived from the decision tree constructed by writing a rule for each path from the root node to the leaf node. After C4.5, Quinlan (1996) created C5.0 as an extended commercial version of C4.5 featuring a number of improvements including smaller decision trees, weighting different attributes and misclassification types, reducing noise, speed and memory efficiency, support for boosting which gives the trees more accuracy.
According to Wu et al. (2008) there are usually many tests that could be chosen in this last step. C4.5 uses two heuristic criteria to rank possible tests: information gain, which minimizes the total entropy of the subsets {Si - the risk factors of infertility} (but is heavily biased towards tests with numerous outcomes), and the default gain ratio that divides information gain by the information provided by the test outcomes. Attributes can be either numeric or nominal and this determines the format of the test outcomes. For a numeric attribute A they are {A ≤ h, A > h} where the threshold h is found by sorting S on the values of A and choosing the split between successive values that maximizes the criterion above. An attribute A with discrete values has by default one outcome for each value, but an option allows the values to be grouped into two or more subsets with one outcome for each subset.
The initial tree was then pruned to avoid over-fitting. The pruning algorithm was based on a pessimistic estimate of the error rate associated with a set of N cases, E of which do not belong to the most frequent class. Instead of E/N, C4.5 determines the upper limit of the binomial probability when E events have been observed in N trials, using a user-specified confidence whose default value is 0.25.
Pruning was carried out from the leaves to the root. The estimated error at a leaf with N cases and E errors is N times the pessimistic error rate as above. For a sub-tree, C4.5 adds the estimated errors of the branches and compares this to the estimated error if the sub-tree is replaced by a leaf; if the latter is no higher than the former, the sub-tree is pruned. Similarly,
C4.5 checks the estimated error if the sub-tree is replaced by one of its branches and when this appears beneficial the tree is modified accordingly. The pruning process was then completed in one pass through the tree.
Random Tree Algorithm
Random Tree is a supervised Classifier; it is an ensemble learning algorithm that generates many individual learners. It employs a bagging idea to produce a random set of data for constructing a decision tree. In standard tree each node is split using the best split among all variables. In a random forest, each node was split using the best among the subset of predicators (risk factors of infertility) randomly chosen at that node. Random trees were introduced by Leo Breiman and Adele Cutler. The algorithm could deal with both classification and regression problems. A random tree is a collection (ensemble) of tree predictors that is called forest. The classification works as follows: the random trees classifier takes the input feature vector, classifies it with every tree in the forest, and outputs the class label that received the majority of votes. In case of a regression, the classifier response is the average of the responses over all the trees in the forest. This study used the earlier described method since a classification of infertility model problem.
Random Trees are essentially the combination of two existing algorithms in Machine Learning: single model trees are combined with Random Forest ideas. Model trees are decision trees where every single leaf holds a linear model which is optimized for the local subspace described by this leaf. Random Forests have shown to improve the performance of single decision trees considerably: tree diversity is generated by two ways of randomization. First the training data was sampled with replacement for each single tree like in Bagging. Secondly, when growing a tree, instead of always computing the best possible split for each node only a random subset of all attributes is considered at every node, and the best split for that subset was computed.
Simulation of Prediction Model
In order to develop the predictive model needed for predicting infertility in Nigerian women, the dataset collected from a University Teaching Hospital in south-western Nigeria was used as the historical dataset for training and testing the prediction model using the selected decision trees algorithms. The WEKA simulation environment supports three different training methods, namely:
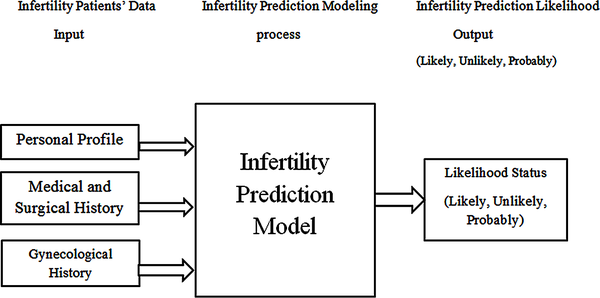
For this study, the full training dataset and the 10-fold cross validation techniques were used as the training technique for model development using the historical dataset containing 39 patient records using the identified 14 attributes (risk indicators for infertility likelihood). The framework used in developing the predictive model needed is shown in Figure 2.
| Figure 2. Infertility prediction modeling framework |
|---|
 |
Performance Evaluation of Model Evaluation
Following the development of the predictive model using all the proposed methods, the performance of the model was evaluated using the confusion matrix to determine the value of the performance metric chosen for this study. A confusion matrix contains information about actual and predicted classification done by a classification system and its performance is commonly evaluated using the data in the matrix. Also, correctly classified cases are placed in the true cells (positive and negative) while incorrect classifications are placed in the false cells (positive and negative) and this has generated the rule 1 to 4, below:
In order to capture the performance of the decision trees algorithm used to classify breast cancer risk, there is the need to plot the results of the classification on a confusion matrix. A confusion matrix is a square which shows the actual classification along the vertical and the predicted along the vertical. All correct classifications lie along the diagonal from the north-west corner to the south-east corner also called True Positives (TP) and True Negatives (TN) while other cells are called the False Positives (FP) and False Negatives (FN). In this study, the likely cases are considered as the positive case while the unlikely and probable cases are the negative cases.
| Figure 3. Confusion matrix of classification results |
|---|
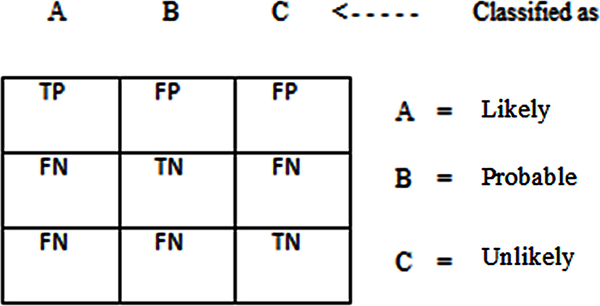 |
The confusion matrix shown in Figure 3 above assumes that the unlikely breast cancer case is the positive class; either way the performance will be evaluated considering each breast cancer case (Unlikely, Likely and Benign) as the positive class. The performance evaluation criteria allow the measurement of the accuracy of the models developed using the training dataset. The results of the classification recorded on a confusion matrix are used to determine the following performance evaluation criteria.
F-Measure: The harmonic mean of the precision and recall, see.


Data Description
The data containing information about the attributes and the respective infertility status for 39 patients is shown in Table 2. It was observed that out of the 39 patients, 19 were likely infertile, 3 were probably infertile and 17 were unlikely infertile. The highest distribution was: 23 with age of menacre less than or equal to 15 years, 23 had thyroid disease, 22 had no family history of infertility, 20 had no previous terminated pregnancy, 21 had irregular menstrual cycle, 21 had diabetes mellitus, 21 had hypertension, 21 had polycyctic ovary and 21 had no genital infection.
The lowest distribution was: 16 had age of menacre more than 15 years, 16 had no thyroid disease, 17 had family history of infertility, 17 had previously terminated pregnancy, 18 had irregular menstrual cycle, 18 had no diabetes mellitus, 18 had no hypertension, 18 had no polycyctic ovary and 18 had genital infection.
Table 2. Description of the identified variables
| Variable Type | Attributes | Labels | Values |
|---|---|---|---|
| Input | Age of Menacre | <=15 years | 23 |
| >15 years | 16 | ||
| Age of Marriage | <=30 years | 20 | |
| >30 years | 19 | ||
| Family History of Infertility | No | 22 | |
| Yes | 17 | ||
| Menstrual Cycle | Irregular | 21 | |
| Regular | 18 | ||
| Diabetes Mellitus | No | 18 | |
| Yes | 21 | ||
| Hypertension | No | 18 | |
| Yes | 21 | ||
| Thyroid Disease | No | 16 | |
| Yes | 23 | ||
| Pelvi-Abdominal Operation | No | 20 | |
| Yes | 19 | ||
| Endometriosis | No | 19 | |
| Yes | 20 | ||
| Fibroid | No | 20 | |
| Yes | 19 | ||
| Polycyctic Ovary | No | 18 | |
| Yes | 21 | ||
| Genital Infection | No | 21 | |
| Yes | 18 | ||
| Previous Terminated Pregnancy | No | 22 | |
| Yes | 17 | ||
| Output | Infertility Status | Likely | 19 |
| Probably | 3 | ||
| Unlikely | 17 |
Simulation Results
Three different decision trees algorithms were used to train the development of the prediction model for the likelihood of infertility using the dataset collected containing the 39 patients’ record. The decision trees algorithm used were: C45 algorithm – implemented on WEKA as J48 algorithm, ID3 algorithm and the Random tree algorithm. As discussed earlier, two training methods were used: the full training dataset and the 10-fold cross validation method. The performance of the model developed using each algorithm with each training method was evaluated and compared using the performance evaluation metrics.
Results of the C4.5 Decision Trees Algorithm
The J48 decision trees algorithm is a classifier used for generating pruned and unpruned C4.5 decision trees using the training dataset. Using the full training method for model training it was discovered that out of the 39 records, there were 34 (87.18%) correct classifications with 5 misclassifications (12.82%) made – this showed an accuracy of 87.2% (Figure 4). Out of 19 likely cases there were 18 correct classifications and 1 misclassified as unlikely; out of 3 probable cases there was 1 correct classification with 2 misclassifications for likely and out of 17 unlikely cases there was 15 correct classifications with 1 misclassification each to likely and probable (Figure 5 on the left). The size of the tree constructed was 9 with the number of leaves recorded as 5. The number of relevant attributes selected by the C4.5 decision Trees algorithm using the full training method was 4 (see Table 3).
| Figure 4. Results of the full training simulation using J48 algorithm |
|---|
 |
| Figure 5. Confusion matrix for each simulation process using J48 |
|---|
 |
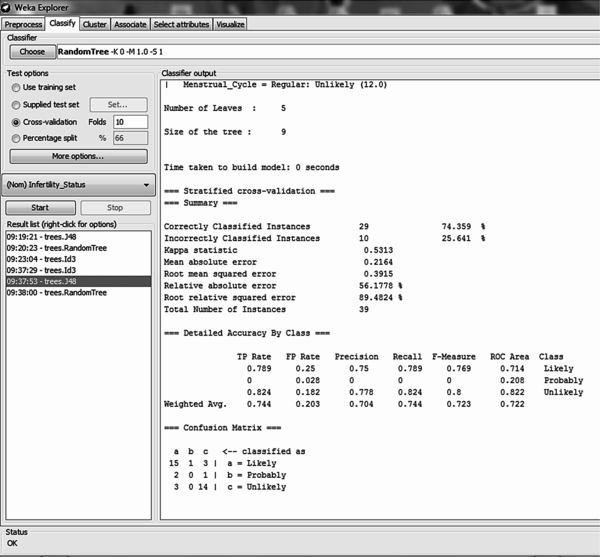
Using the 10-fold cross validation training method for model training it was discovered that out of the 39 records, there were 29 (74.36%) correct classifications and 10 (25.64%) misclassifications made – this showed an accuracy of 74.36% (Figure 6). Out of 19 likely cases there were 15 correct classifications with 1 misclassification to probable and 3 to unlikely; out of 3 probable cases there was no correct classification with 2 misclassifications to likely and 1 to unlikely; out of 17 unlikely cases there were 14 correct classifications with 3 misclassifications to likely (Figure 5 on the right). The size of the tree constructed was 9 with the number of leaves recorded as 5. The number of relevant attributes selected by the C4.5 decision trees algorithm using the 10-fold cross validation method was also 4 (see Table 3).
| Figure 6. Results of the 10-fold cross validation simulation using J48 algorithm |
|---|
 |
Results of the ID3 Decision Trees Algorithm
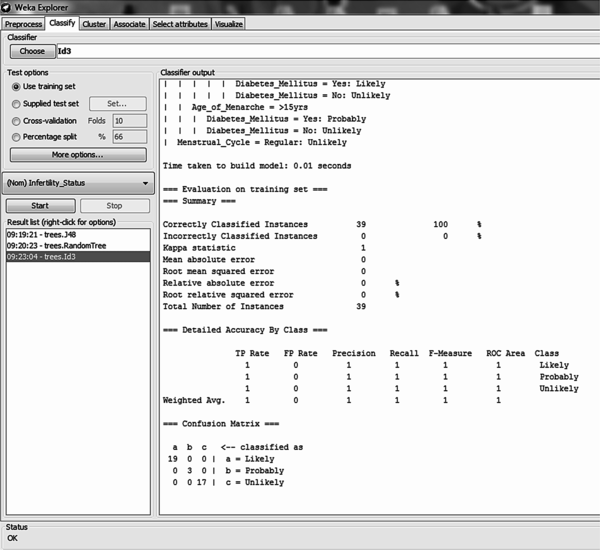
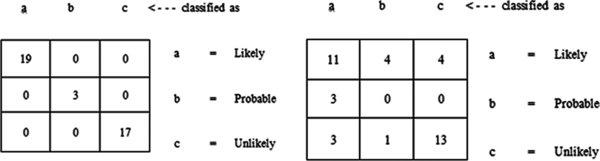
The ID3 decision tree algorithm is a classifier used for constructing an unpruned decision tree based on the ID3 algorithm using the training dataset. Using the full training method for model training it was discovered that out of the 39 records, all records were correctly classified – this showed an accuracy of 100% (Figure 7). All 19 likely cases, 3 probable cases and 17 unlikely cases were correctly classified (Figure 9 on the left).
The size of the tree constructed was 24 with the number of leaves recorded as 13. The number of relevant attributes selected by the ID3 decision trees algorithm using full training set was 8 (Table 3).
Using the 10-fold cross validation training method for model training it was discovered that out of the 39 records, there were 24 (61.54%) correct classifications and 15 (38.46%) misclassifications made – this showed an accuracy of 61.5% (Figure 8). Out of 19 likely cases there were 11 correct classifications with 4 misclassifications to probable and 4 to unlikely; out of 3 probable cases all 3 were misclassified to likely cases; out of 17 unlikely cases there were 13 correct classifications with 3 misclassifications to likely and 1 misclassification to probable (Figure 9 on the right). The size of the tree constructed was 24 with the number of leaves recorded as 12. The number of relevant attributes selected by the ID3 decision trees algorithm using the 10-fold cross validation method was 8 (Table 3).
| Figure 7. Results of the full training simulation using ID3 algorithm |
|---|
 |
| Figure 8. Results of the 10-fold cross validation simulation using ID3 algorithm |
|---|
 |
| Figure 9. Confusion matrix for each simulation process using ID3 |
|---|
 |
Results of the Random Decision Trees Algorithm
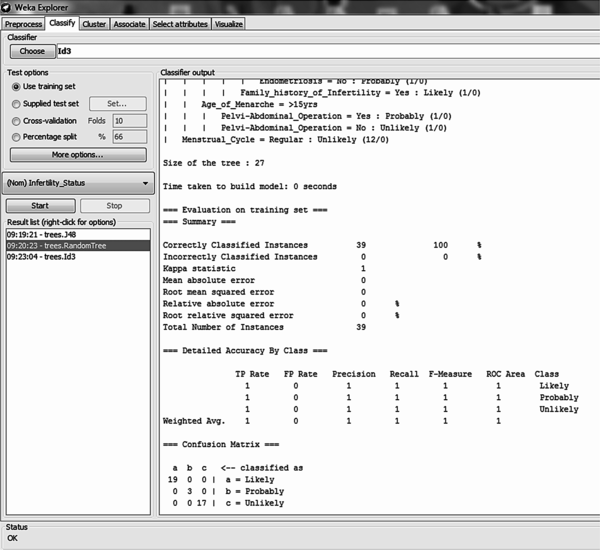
The Random decision tree algorithm is a classifier used for constructing a tree that considers k randomly chosen attributes at each node without any pruning using the training dataset. Using the full training method for model training it was discovered that out of the 39 records, all records were correctly classified – this showed an accuracy of 100% (Figure 10). All 19 likely cases, 3 probable cases and 17 unlikely cases were correctly classified (Figure 11 on the left). The size of the tree constructed was 27 with the number of leaves recorded as 14. The number of relevant attributes selected by the random tree decision trees algorithm using the full training method was 9 (Table 3).
Table 3. Summary of the relevant attributes selected
| Training Method | C4.5 Decision Trees | ID3 Decision Trees | Random Decision Trees | |||
|---|---|---|---|---|---|---|
| S/N | Full Training | 10-Fold Cross Validation | Full Training | 10-Fold Cross Validation | Full Training | 10-Fold Cross Validation |
| 1. | Termination of Pregnancy | Termination of Pregnancy | Termination of Pregnancy | Termination of Pregnancy | Termination of Pregnancy | Termination of Pregnancy |
| 2. | Fibroid | Fibroid | Fibroid | Fibroid | ||
| 3. | Thyroid Disease | Thyroid Disease | ||||
| 4. | Age of Marriage | Age of Marriage | Age of Marriage | Age of Marriage | ||
| 5. | Menstrual Cycle | Menstrual Cycle | Menstrual Cycle | Menstrual Cycle | Menstrual Cycle | Menstrual Cycle |
| 6. | Age of Menacre | Age of Menacre | Age of Menacre | Age of Menacre | Age of Menacre | Age of Menacre |
| 7. | Endometriosis | Endometriosis | ||||
| 8. | Family History | Family History | Family History | Family History | ||
| 9. | Genital Infection | Genital Infection | Genital Infection | Genital Infection | Pelvi-abdominal Operation | Pelvi-abdominal Operation |
| 10. | ||||||
| 11. | Diabetes Mellitus | Diabetes Mellitus | ||||
| Figure 10. Results of the full training simulation using Random decision tree algorithm |
|---|
 |
Using the 10-fold cross validation training method for model training it was discovered that out of the 39 records, there were 21 (53.85%) correct classifications and 18 (46.15%) misclassifications made – this showed an accuracy of 53.85% (Figure 12). Out of 19 likely cases there were 12 correct classifications with 2 misclassifications to probable and 5 to unlikely; out of 3 probable cases all 3 were misclassified to unlikely cases; out of 17 unlikely cases there were 9 correct classifications with 6 misclassifications to likely and 9 misclassifications to probable (Figure 11 on the right). The size of the tree constructed was 27 with the number of leaves recorded as 14. The number of relevant attributes selected by the random tree decision trees algorithm was 9 (Table 3).
| Figure 11. Confusion matrix for each simulation process using ID3 |
|---|
 |
| Figure 12. Results of the 10-fold cross validation simulation using Random tree |
|---|
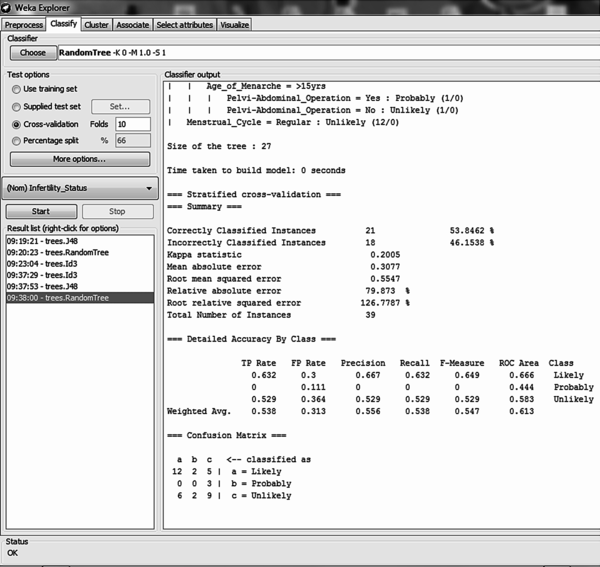 |
Table 4 gives a summary of the simulation results by presenting the average value of each performance metrics identified using the two training methods selected for the three decision trees algorithms selected for the study. It was discovered that using the training method for model development, the ID3 and the Random decision tree algorithms showed the highest accuracy with a value of 100% owing for 39 correct classifications while the C4.5 decision trees algorithm showed an accuracy of 87.2% with 34 correct classifications. Using this method it was discovered that the C4.5 algorithm was able to predict 87.2% of the actual positive cases (likely) while 9.5% of the negative (probably and unlikely) predicted cases were actually positive cases. The percentage of positive predicted cases that were actually positive cases was 74.4% while the value of 94% for the area under the ROC curve shows how effective the C4.5 algorithm is at prediction with a bias rate of 6%.
Using the 10-fold cross validation training method which is usually considered a more effective model development process due to its lesser likelihood of over-fitting data unlike the full training method, a number of observations were made. The C4.5 out-performed the other two algorithms with an accuracy of 74.4% while the ID3 and Random tree had accuracies of 61.5% and 53.8% respectively. 74.4% of the actual positive cases were correctly predicted by C4.5 unlike ID3 and Random tree which predicted 61.5% and 53.8% respectively. 20.3% of the negative predicted cases were actually positive cases for the C4.5 algorithm unlike the ID3 and the random tree algorithm which had values of 23.6% and 31.3% respectively. The C4.5 decision trees algorithm also out-performed the other algorithms for the evaluation of the precision and the area under the ROC curve with values of 74.4% and 72.2% respectively.
The result shows that the C4.5 decision trees algorithm is an effective model which can be used in predicting the likelihood of infertility in women given a number of relevant variables. It was also discovered that using the C4.5 decision trees algorithm, the number of relevant attributes identified to be predictive for infertility likelihood are:
Table 4. Results of the performance evaluation of the decision trees algorithm
| Metrics | Accuracy | TP Rate (Recall or Sensitivity) | FP Rate (False Alarm or 1-Specificity) | Precision | Area Under ROC Curve (AUC) | |
|---|---|---|---|---|---|---|
| C4.5 | Full training | 87.180 | 0.872 | 0.095 | 0.865 | 0.940 |
| 10-fold cross validation | 74.359 | 0.744 | 0.203 | 0.744 | 0.722 | |
| ID3 | Full training | 100.000 | 1.000 | 0.000 | 1.000 | 1.000 |
| 10-fold cross validation | 61.539 | 0.615 | 0.236 | 0.649 | 0.690 | |
| Random Tree | Full training | 100.000 | 1.000 | 0.000 | 1.000 | 1.000 |
| 10-fold cross validation | 53.846 | 0.538 | 0.313 | 0.547 | 0.613 | |
The tree developed using the C4.5 decision trees algorithm was used to induce the set of rules needed for predicting the likelihood of infertility in women. It is important that the accuracy of the model is 74.4% given a 95% confidence interval but the model can be improved by collecting more information on infertility which can help identify hidden trends not observed in the datasets used in developing the predictive model. The induced rule is as follows:
If Previous termination of pregnancy = “Yes” then infertility likelihood = “Likely”
Else If Previous termination of pregnancy = “No” then
If Menstrual Cycle = “Irregular” then
If Age of Menacre = “<= 15 years” then
If Genital Infection = “Yes” then infertility likelihood=“Likely”
Else If Genital Infection = “No” then infertility likelihood =“Unlikely”
Else If Age of Menacre = “> 15 years” then infertility likelihood=“Probably”
Else if Menstrual Cycle = “Regular” then likelihood of infertility=“Unlikely”
In this paper, the development of a predictive model for determining the likelihood of infertility in Nigerian women was proposed using dataset collected from patients in one of the Teaching Hospitals located in South-western Nigeria. 14 variables were identified by gynecologist to be necessary in predicting infertility in women for which a dataset containing information of 39 patients alongside their respective infertility status (likely, unlikely and probably) was also provided with 14 attributes following the identification of the required variables. Three decision trees algorithms were used to develop the predictive model using two different training methods – the full training and the 10-fold cross validation method.
After the process of data collection and pre-processing, the three decision trees algorithms were used to develop the predictive model using two different types of training method while the dataset collected from 39 patients was used as the historical dataset from which the training and testing dataset was collected. Using the full training method which is likely over-fitted; C4.5 had the least performance while ID3 and Random trees showed accuracy of 100% each. Using the 10-fold cross validation technique, the C4.5 decision trees algorithm out-performed the other two decision trees algorithm showing the effectiveness of the C4.5 decision trees algorithm in developing predictive model needed for the likelihood of infertility with an accuracy of 74.4%.
In addition, the three algorithms were able to identify a number of relevant variables – all identified termination of pregnancy, menstrual cycle and age of menacre; Age of Marriage, Fibroid and Family History were identified in addition by ID3 and Random trees; Thyroid disease, endometriosis and pelvi-abdominal operation in addition was identified by only random trees while diabetes mellitus in addition was identified by only the ID3 algorithm.
The C4.5 decision trees algorithm proved to be an effective algorithm for predicting infertility in women in addition to the attributes identified but it is believed that higher accuracy could be attained by increasing the number of records used and be identifying other relevant attributes which could help predict infertility in women. The model can also be integrated into existing health information systems used by hospitals to retrieve information regarding infertility which can be used in predicting the likelihood of infertility thus proving affective and efficient decision-support to practicing gynecologist.
This research was previously published in the Handbook of Research on Healthcare Administration and Management edited by Nilmini Wickramasinghe; pages 76-102, copyright year 2017 by Medical Information Science Reference (an imprint of IGI Global).
American Society for Reproductive Medicine (ASRM). (2006). Smoking and infertility. Fertility and Sterility , 86(5), 172–177. doi:10.1016/j.fertnstert.2006.08.018
American Society for Reproductive Medicine (ASRM). (2008). Fertility. Fertility and Sterility , 90(7), 2361–2365.
Andersen, A.N., Goossens, V., Ferraretti, A. P., Bhattacharya, S., Felberbaum, R., de Mouzon, J., & Nygren, K. G.European IVF-Monitoring Consortium, European Society of Human Reproduction and Embryology. (2008). Assisted reproductive technology in Europe, 2004: Results generated from European registers by ESHRE. Human Reproduction (Oxford, England) , 23(4), 756–771. doi:10.1093/humrep/den014
Audu, B. M., Massa, A. A., & Bukar, M. (2003). Clinical Presentation of Infertility in Gombe, North-Eastern, Nigeria. Tropical Journal of Obstetrics and Gynaecology , 20, 93–96.
Bennett, C. C., & Duob, T. W. (2010). Data mining and electronic health records: selecting optimal clinical treatments in practice. Proceedings of the 6th International conference on data mining (pp. 313 – 318). Retrieved from https://arxiv.org/ftp/arxiv/papers/1112/1112.1668.pdf
Boivin, J., Bunting, L., Collins, J. A., & Nygren, K. G. (2009). International Estimates of Infertility Prevalence and Treatment Seeking: Potential need and demand for infertility medical care. Human Reproduction (Oxford, England) , 24, 2379–2380. doi:10.1093/humrep/dep218
Cabena, P., Pablo, H., & Stadler, R. Verhees & Alessandro, Z. (1997). Discovering data mining: From concept to Implementation. Prentice Hall.
Chaurasia, S., Chakrabarti, P., & Chouraisia, N. (2012). An application of Classification Techniques on Breast Cancer Prognosis. International Journal of Computers and Applications , 59(3), 1–7.
DesikanP.HsuS. (2011). Data mining for health care management. Proceedings of the 2011 SIAM International Conference on Data Mining (pp. 24 – 28).
Durairaj, M. & Thamilselvan, P. (2013). Applications of Artificial Neural Network for IVF Data Analysis and Prediction. Journal of Engineering, Computers and Applied Sciences, 2(9), 11–15.
Girela, J. L., Gil, D., Johnsson, M., Gomez-Torres, M. J., & De Juan, J. (2013). Semen Parameters can be Predicted from Environmental Factors and Lifestyle Using Artificial Intelligence Methods. Biology of Reproduction , 88(4), 1–8. doi:10.1095/biolreprod.112.104653
Girija, D. K., & Shashidhara, M. S. (2012). Classification of Women Health Disease (Fibroid) Using Decision Tree Algorithm. International Journal of Computer Applications in Engineering Sciences , 2(3), 205–209.
Gupta, S., Kumar, D., & Sharma, A. (2011). Data mining classification techniques applied for breast cancer diagnosis and prognosis. Indian Journal of Computer Science and Engineering , 2(2), 188–195.
Idowu, P. A., Sarumi, S. O., & Balogun, J. A. (2015). A Prediction Model for the likelihood of Infertility in women. Proceedings of the 9th International Conference on Information and Communications Technology (ICT) Applications, Ilorin, Kwara (pp. 78 – 88).
Idowu, P. A., Williams, K. O., Balogun, J. A., & Oluwaranti, A. I. (2015). Breast cancer risk prediction using data mining classification techniques. Transactions on Networks and Communications , 3(2), 1–11.
Idrisa, A. (2005). Infertility . In Kwawukume, E. Y., & Emuveyan, E. E. (Eds.), Comprehensive Gynaecology in the tropics (pp. 333–345). Accra: Graphic Packaging.
Mishra, D., Das, A.K., Mishra, M. & Mishra, S. (2010). Predictive data mining: Promising Future and Applications. International Journal of Computer and Communications technology, 2(1), 1–7.
Moons, K. G., Royston, P., Vergouwe, Y., Grobbee, D. E., & Altman, D. G. (2009). Prognosis and prognostic research: What, why and how? BMJ (Clinical Research Ed.) , 338(1), 375. doi:10.1136/bmj.b375
Okonofua, F. (1996). Infertility in Developing Countries. British Journal of Obstetrics and Gynaecology , 103, 957–962. doi:10.1111/j.1471-0528.1996.tb09542.x
Puscheck, E. E., & Woodad, T. Z. (2009) Infertility: e-Medicine Specialties. Obstetrics and Gynaecology. Retrieved from http://emedicine.medscape.com/article/274143
Quinlan, J. R. (1993). C4.5: Programs for machine learning . San Francisco, CA: Morgan Kaufmann Publishers.
QuinlanJ. R. (1996) Bagging, boosting, and C4.5. Proceedings of the 13th National Conference on Artificial Intelligence (pp. 725-730).
Siegel, C. A., Siegel, L. S., Hyams, J. S., Kugathasan, S., Markowitz, J., Rosh, J. R., & Dubinsky, M. C. (2011). Real-time tool to display disease course and treatment response for children with Crohn’s disease. Inflammatory Bowel Diseases , 17(1), 30–38. doi:10.1002/ibd.21386
Singal, A. G., Mukherjee, A., & Higgins, P. D. (2013a). Machine learning algorithms outperform conventional regression models in identifying risk factors for hepatocellular carcinoma in patients with cirrhosis. The American Journal of Gastroenterology , 108, 1723–1730. doi:10.1038/ajg.2013.332
Singal, A. G., Rahimi, R. S., Clark, C., Ma, Y., Cuthbert, J. A., Rockey, D. C., & Amarasingham, R. (2013b). An automated model using electronic medical record data to identify patients with cirrhosis at high risk of readmission. Clinical Gastroenterology and Hepatology , 11(10), 1335–1341. doi:10.1016/j.cgh.2013.03.022
Singal, A. G., Yopp, A. C., Gupta, S., Skinner, C. S., Halm, E. A., Okolo, E., & Tiro, J. A. (2012). Failure rates in the hepatocellular carcinoma surveillance process. Cancer Prevention Research (Philadelphia, Pa.) , 5(9), 1124–1130. doi:10.1158/1940-6207.CAPR-12-0046
Skakkebaek, N. E., Rajpert-De, M. E., & Main, K. M. (2001). Testicular dysgenesis syndrome: An increasingly common developmental disorder with environmental aspects. Human Reproduction (Oxford, England) , 16(5), 972–980. doi:10.1093/humrep/16.5.972
Tan, P.-N., Steinbach, M., & Kumar, V. (2005). Introduction to data mining . London: Oxford Publishers.
Toll, D. B., Janssen, K. J. M., Vergouwe, Y., & Moons, K. G. M. (2008). Validating, updating and impact of clinical prediction rules: A review. Journal of Clinical Epidemiology , 61(11), 1085–1094. doi:10.1016/j.jclinepi.2008.04.008
Uyar, A., Bener, A., & Ciray, H. N. (2014). Predictive Modeling of Implantation Outcome in an In Vitro Fertilization Setting: An Application of Machine Learning methods. Medical Decision Making, May. Retrieved from ResearchGate, http://www.researchgate.net/publication/262536801
Vanneschi, L., Farinaccio, A., Mauri, G., Antoniotti, M., Provero, P., & Giacobini, M. (2011). A comparison of machine learning techniques for survival prediction in breast cancer. Bio Data Mining , 4(12), 1–13.
Waljee, A. K., & Higgins, P. D. (2010). Machine learning in medicine: A primer for physicians. The American Journal of Gastroenterology , 105(6), 1224–1226. doi:10.1038/ajg.2010.173
Wu, X., Kumar, V., Quinlain, J. R., Ghosh, J., Yang, Q., Motoda, H., & Steinberg, D. (2008). Top 10 algorithms in data mining. Knowledge and Information Systems , 14(1), 1–37. doi:10.1007/s10115-007-0114-2
Yap, G.-E., Tan, A.-H., & Pang, H.-H. (2007). Learning Causal models for noisy biological data mining: An application to ovarian cancer detection. Association for the advancement of Artificial Intelligence, 354 – 359. Retrieved from https://www.aaai.org/Papers/AAAI/2007/AAAI07-055.pdf
Zegers-Hochschild, F., Adamson, G. D., de Mouzon, J., Ishihara, O., Mansour, R., Nygren, K., & van der Poel, S. (2009). International Committee for Monitoring Assisted Reproductive Technology (ICMART) and the World Health Organization. Human Reproduction (Oxford, England) , 24(11), 2683–2687. doi:10.1093/humrep/dep343
ZhuQ.DavidsonI. (2007). Knowledge discovery and data mining: challenges and Realities. Proceedings of International Conference on Data Mining (pp. 14-18). 10.4018/978-1-59904-252-7