1 Introduction
Understanding human mobility patterns can help in the exploration of the underlying driving factors of society as many aspects of life are associated with them. The first efforts to learn human mobility patterns were associated with classic social sciences. Since the nineteenth century, sociologists in what are called time-use or time-budget studies have been measuring the time people spend doing different activities throughout the day [13]. In contrast, methods for human mobility data collection have shifted over time as now both developed and developing countries are facing the increase of the pervasiveness of mobile devices [3, 6]. Positioning technologies that serve these devices such as the cellular antenna (GSM networks), global navigation satellite systems (GPS), and more recently the WiFi positioning system (WPS) provide large amounts of spatio-temporal data in a continuous way at low costs [9]. When dealing with raw data, final users cannot make sense of it without processing and applying techniques to extract meaningful information from its content. Many researchers have made efforts in exploring these data in order to find places, locations, and regions [7, 17, 18]. Hence, individuals can state a place as something with a meaning such as work, home, university while a pair of numbers like “39.98450, 116.29929” has no useful meaning to them. Therefore, detecting significant places and the frequency of movements between them is fundamental to understand human behavior.
Several studies confirmed the intuition that human mobility is highly predictable, centered on a small number of base locations [5]. This opens a wide range of opportunities for more intelligent recommendations and support for routine activities. Still, empirical studies on individual mobility patterns are scarce.
The main contributions of this paper are related as follows: we introduce a new dataset acquired from a Telecom company that comprises many different cities in Brazil. We also present a new density-based clustering for spatio-temporal data to identify meaningful places. Moreover, in the last step, we apply a Gaussian Mixture Model (GMM) over the Origin  Destination matrix of trips between meaningful places to automatically separate the trajectories for identification of user habits.
The following section presents the literature review and the most important related works. The remainder of the paper describes the methodology and the data sets utilized to assert the validity of the methods in Sect. 3, in Sect. 4 we discuss the experiments and results obtained. Finally, the conclusions and future work are presented in Sect. 5.
2 Related Work
Many researchers have been proposing methods to identify meaningful locations and habits from users for diverse goals. In this section, we review some relevant works which leverage the information contained in GPS and mobile phone data (GSM) for a multitude of different applications.
According to [7], several methods based on density have been proposed in order to discover regions of interest although most of these methods are used to aggregate spatial point objects. Some authors were more interested in the semantic movement trajectories. [8] introduced a model that makes use of movement datasets which has trajectories defined as sequences of time-stamped stops and moves between locations. In order to discover personalized visited-POIs, [11] proposed a method to estimate fine-grained and pre-defined locations. In [1] the authors explore raw GPS data to identify meaningful places in a region and describe user’s profiles and similarities among them.
Many researchers were also interested in mobility patterns. Most location-based services provide recommendations based on a user’s current location or a given route or destination. Even though there are indications that human movement is highly predictable, daily and weekly routines of individual users constitute a largely unexplored and unexploited area. [12] used more than 800 million of CDR data to identify weekly patterns of human mobility through mobile phone data. In [10], the authors present a methodology based on density-based clustering, clustering-based sequential mining and Apriori algorithm for analyzing user location information in order to identify user habits.
3 Problem Statement and Methodology
The objective of this work is to propose a methodology to identify user habits from GPS and GSM data without any apriori or external information. We propose a variation of DBSCAN clustering technique that is able to perform cluster of locations like buildings and squares in a better way and apply a GMM in order to separate the days and hours a given user moves between the clustered locations.
Before entering in details of the methodology, we introduce the definition of points and trajectories:
A point is a triple of the form p = (latitude, longitude, time) that represents a latitude-longitude location and a time-stamp. A trajectory is a sequence of ordered points triples Tr =  ,
,  , . . . ,
  where
where  is a point and
The first step of the methodology is the preprocessing task that is including among other activities, the data cleaning process where we perform outliers and noise removal. The second is the feature engineering to derive new information from the original data (in the form of latitude, longitude, and a time-stamp) to calculate key features such as time delta of the transitions, traveled distance between points, velocity, start and stop positions, time and day of the week, length and duration of a trajectory. In this work, we denote a new trajectory every time an individual stop moving or the time delta between points is more than 30 min.
3.1 User Stay Points Detection
Stay points are regions where a given user has stayed for a while within a defined radius. The algorithm is a hybrid density and time-based proposed in [15] that calculates the distance between two sets of points  and
and  in order to find those that are below a distance threshold. Next, it checks for how long the user stayed in that radius by looking at time threshold. At last step, it calculates the stay points centroid by getting the mean of the coordinates of the set of points. For this experiment, we set the parameters Distance-threshold as 200 m and the Time-threshold to 20 min as suggested in [18].
3.2 Meaningful Locations
A meaningful place is defined as a frequent location visited by an individual and does not need to be related to any other person or group like in the case of the POIs. Taking into account we already have the user’s stay points, now we need to look for those places (stay points) a person visits repeatedly in order to form the so-called users’ meaningful places.
Location detection techniques commonly make use of density-based methods. This is because the mechanism of density-based clustering is able to detect clusters of arbitrary shapes without specifying the number of the clusters in the data a priori and is also tolerant of outliers (noise).
The Location Clustering method proposed by [2], operates attributing in a way that once it forms a cluster, these points are eliminated from the neighbourhood and avoid new points to overlap to them. In this way, the remaining observations are available to form new clusters surrounding the previous center that could maybe be part of it. Our method, on the other hand, keeps a short memory for those points revisiting and maybe reclassifying them to the new cluster as the density of the new class turns to be more relevant.
One main advantage over the classical DBSCAN [4] implementation is that given the arbitrary shape of the trajectories, sometimes the clusters form straight chains which may not be a good representation of a location as normally buildings are in a squared or circular shape. Our method is robust to these situations as it classifies as noise those points that fall out of the neighbour’s radius which is away from the centroid of the cluster. Another drawback of this original DBSCAN approach is that it does not return a centroid for each cluster. As we are looking for meaningful places over the set of stay points (Sect. 3.1), we need to find the centroid for each of the returned labels of the DBSCAN.
3.3 Identification of Habits
Individuals have a remarkable propensity to return to their frequently visited places. Hence, the interactions between individuals and these places are likely to represent the individual’s characteristics. After clustering the user stay points into meaningful places as described in Sect. 3.2 we ended up with: trajectories connecting non-meaningful places (those who start and end in places classified as noise), trajectories connecting one meaningful place at the end or at the start and trajectories connecting two meaningful places. For the habits study purpose, we will focus on the last item as we are interested in discovering frequent movements across meaningful places.
From this list of grouped trajectories is possible to identify the most important places of a given user as we can perform a count on the occurrences of trips connecting two locations. Groups with very low values, close to zero, means that there are no habits connecting those places or the eps parameter used to perform the clustering in step 3.2 is too small. For this study, we are considering only the two locations that have at least 5 (five) trajectories connecting them.
3.4 Gaussian Mixture Model to Classify the Different Habits
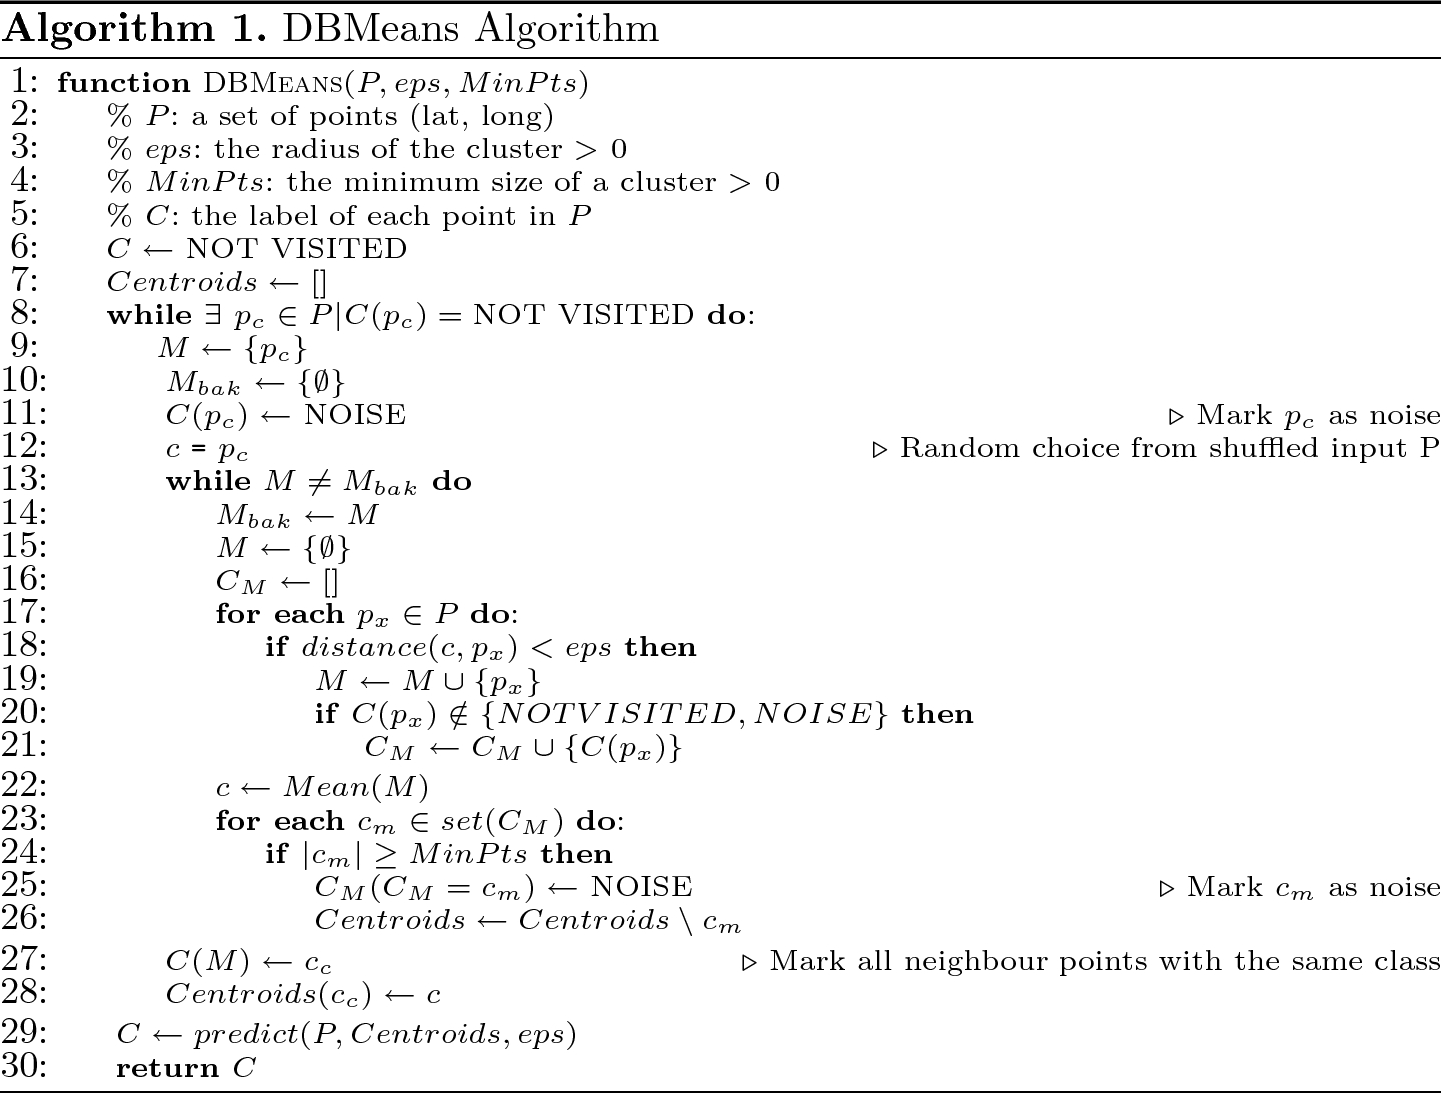
In order to discover user habits, we need to analyze the features that are emerging from the discovery process. One way we can utilize to separate the trips into habits is by the time they happen. To tackle this issue we create two new features, deriving a sine and cosine transform from the start hour.
Transformation of the start hour based on the Sin and Cos. The left image represents the hours in a plain representation (X axis is the trajectory order), the right is a circular where two or more points can fall over the same region no mater the trajectory order
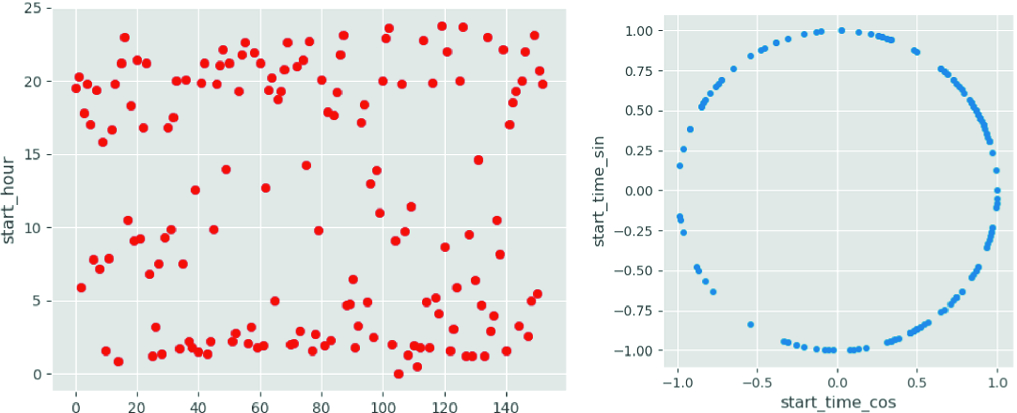
 Destination pair and is possible to verify the segmentation made by the multiple Gaussians in the start hour distribution. Note that there are blue dots on the top and the bottom of the left image representing the same class of trajectories that occur close to 23:00 pm and 02:00 am.
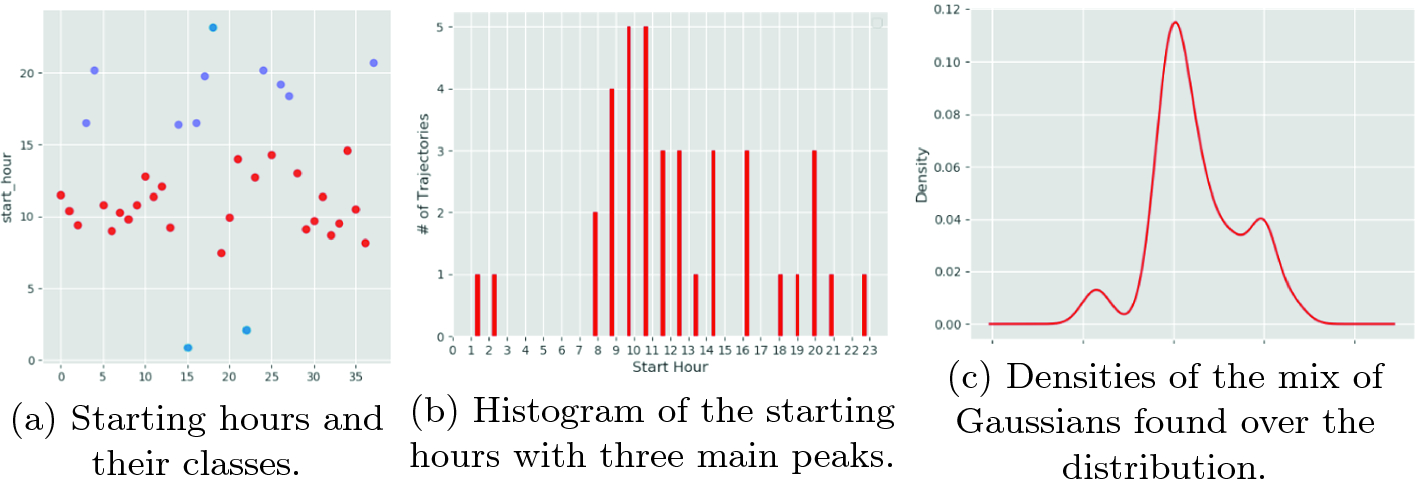
GMM model over the start hours of the trajectories. (Color figure online)
4 Experiments and Results
In this section, several experiments with the two real-world datasets are performed to evaluate our proposed method. The datasets description and their preparation are described in Subsect. 4.1. Subsection 4.2 corresponds to clustering results and Subsect. 4.3 presents the results regarding the habits extraction.
4.1 Datasets
Geolife GPS Dataset. This GPS trajectory dataset was collected in (Microsoft Research Asia) Geolife project by 182 users in a period of over three years (from April 2007 to August 2012). The dataset contains 17,621 trajectories with a total distance of about 1,2 million kilometers and a total duration of 48,000+ hours. These trajectories were recorded by different GPS loggers and GPS-phones, and have a variety of sampling rates. 90% of the trajectories are logged in a dense representation, e.g. every 1 to 5 s or every 5 to 10 meters per point [16–18].
GSM Telecom Dataset. This is a new dataset based on mobile phone (GSM) data. The dataset contains 526,894 instances from a period of 12 months or 350 days starting on September 2017 and finishing in September 2018 consisting of 4,545 different individuals. After cleaning and removing the duplicates, it was reduced to 461,778 instances. The points were recorded in many cities in Brazil with a coarse granularity of one point at every 15 min. No information about the users is derived from these data, as the entire dataset is anonymized. Each point consists of a user sequential identification number, a pair of (latitude, longitude), and a timestamp. All the data was delivered in a single file that is available in the project folder on the web page.1
4.2 Clustering Results

The dense region in the top shows the clear difference among the methods: while our approach (a) returns only two clusters, the Location Clustering (b) returns 9 and DBSCAN (c) returns only one large cluster. The X symbol stands for noise
 , longitude
  which has 38 visits, and latitude =
  , longitude =
  with a counting of 6 times. In Fig. 4 we can see the locations over the map of Uberlândia/Brazil.
Meaningful locations (colored circles) of the user 10837 over the Uberlândia/Brazil map. The x symbol stands for noise (Color figure online)
4.3 Habits Results
 Destination pattern. The Fig. 5 shows the three different habits returned from the Gaussians for the trajectories of the user connecting the two locations. The Fig. 6 illustrates the hourly distribution of the trajectories between the two main groups of meaningful places for the Geolife dataset user ‘004’.
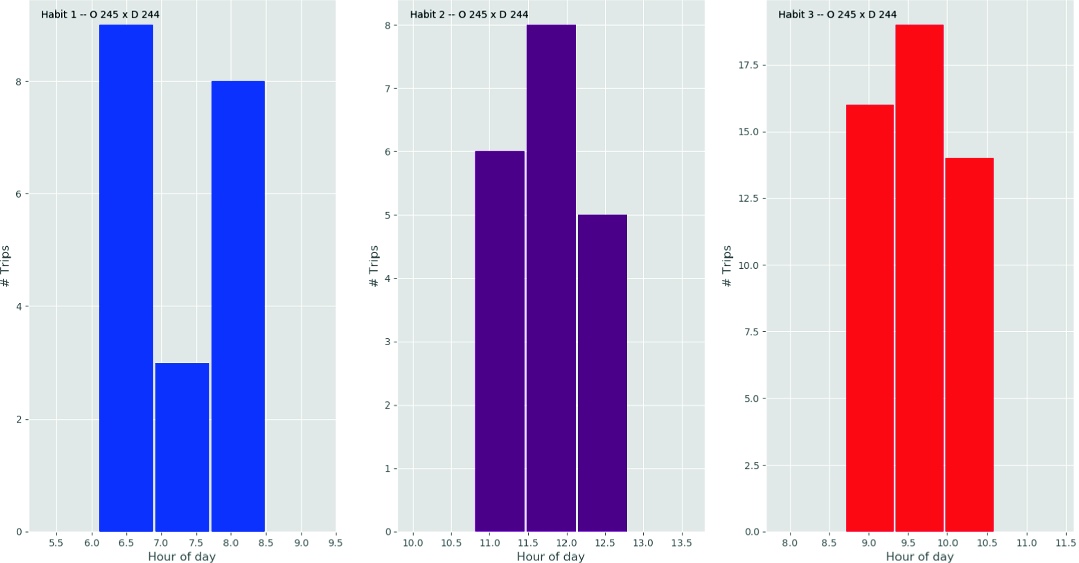
Three main habits returned from the start hours connecting the top two locations of the user ‘004’
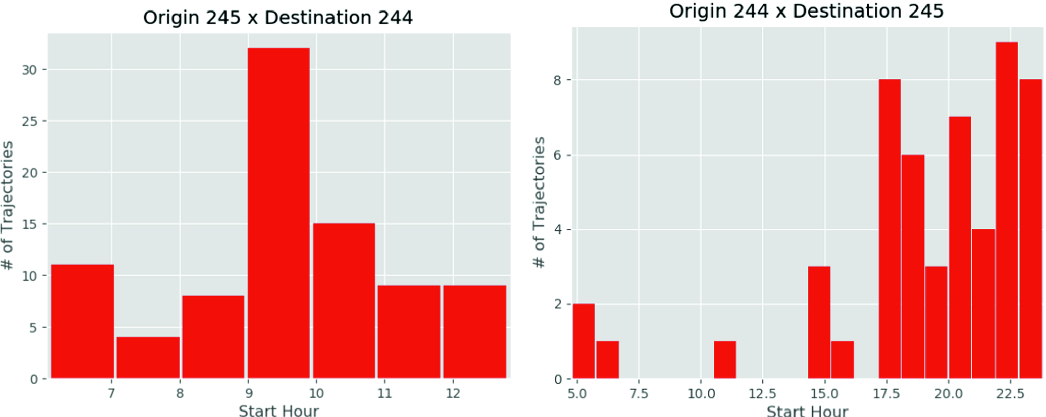
Distribution of starting hours from the top two meaningful locations of the user ‘004’
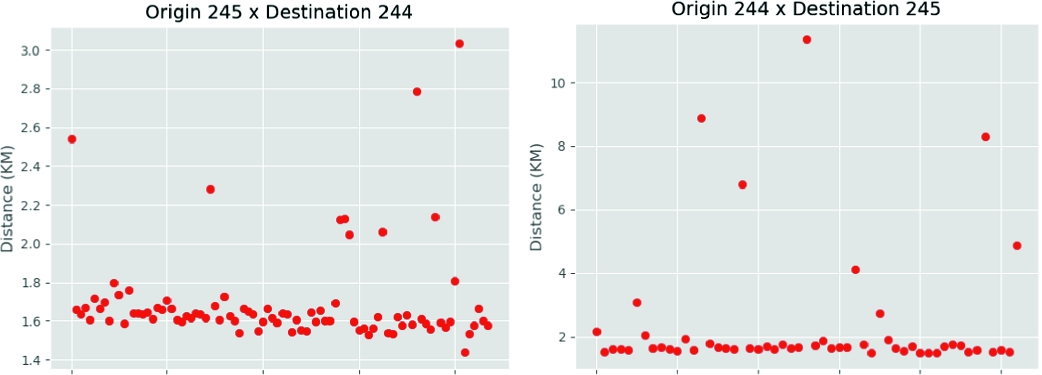
Distribution of trajectory distance from the top two meaningful locations of the user ‘004’
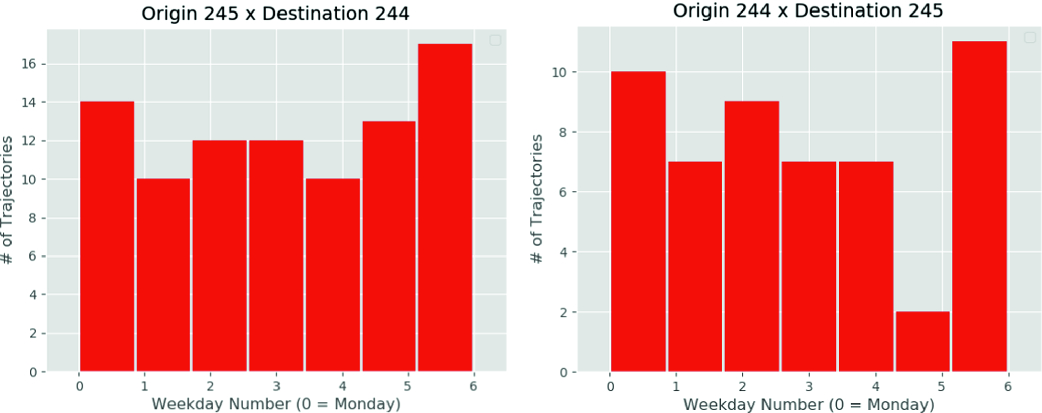
Distribution of the trajectories according to the day of week from the top two meaningful locations of the user ‘004’
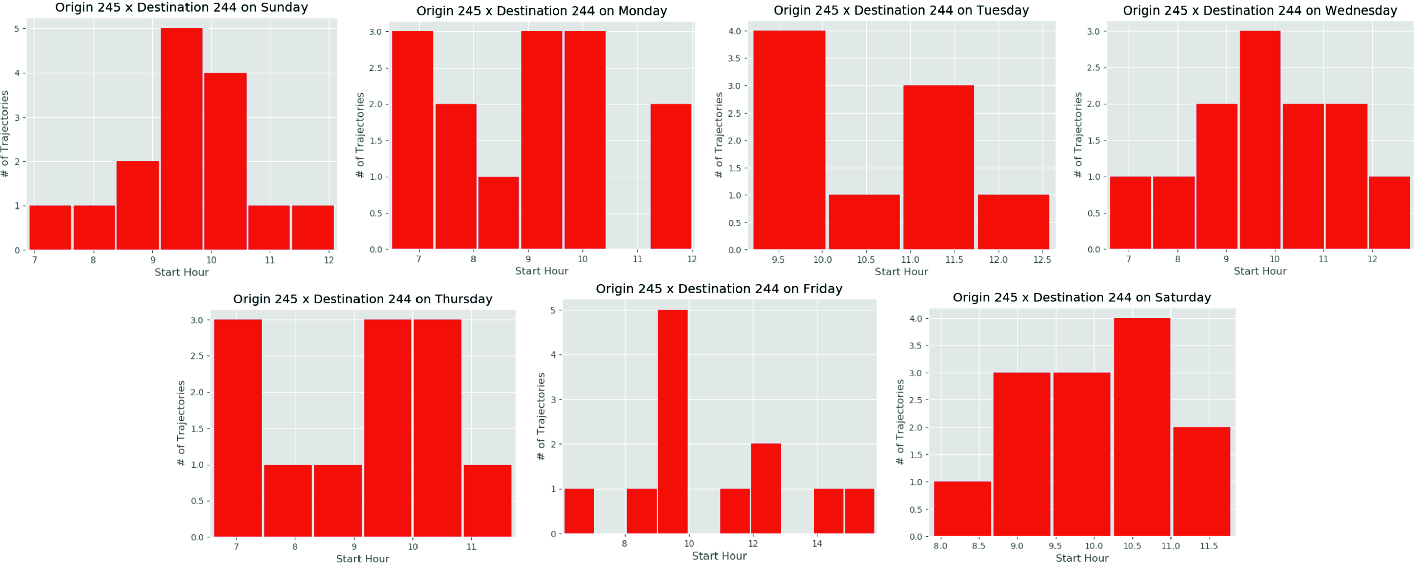
Distribution of the trajectories according to the hour and day of week from the top two meaningful locations of the user ‘004’
Another relevant way to analyze habits is looking for the day of the week a trip was taken. Routines are very common in human patterns and some of them may occur less often than the others. In Figs. 8 and 9 we show the distribution of the trips in a weekly view.
5 Conclusions and Future Work
A historical record of the daily mobility pattern of the users hides an unexpectedly high degree of potential predictability despite the apparent randomness of human nature. Following this idea, we show that most people have a relatively regular schedule of moments when they travel from one location to another.
In this research, we present a new density-based clustering method to filter mobility data finding the most frequent places of a given individual and compare our method with two other proposals and show that this approach provides more informative results for this context. We also explore a new GSM dataset of diverse cities in Brazil showing the usefulness of the proposed clustering method to identify meaningful places over data with different granularity. We also introduce a Gaussian Mixture Model to find individuals’ habits from the clustered data in a dynamic way.
For future work, we intend to propose a method to find the patterns of people visiting and leaving different places at different times in an order (weekly basis, daily basis) similar to sequential pattern mining methods. Also includes some map matching tasks including external information in order to find the semantic meaning of the individuals’ movements. We also intend to apply the method in other datasets to verify its usefulness generalizing in other scenarios. Location prediction is also a field that is considered the results of this paper are strongly related to it.
This work is financed by National Funds through the Portuguese funding agency, FCT - Fundação para a Ciência e a Tecnologia within project: UID/EEA/50014/2019.