1 Background
1.1 The Christchurch Earthquake Sequence
In 2010–2011 New Zealand suffered the costliest natural disaster of its history with a series of earthquakes known as the Canterbury Earthquake sequence (CES). The CES led to 182 fatalities and extensive building damage across the region, with over NZ$50 billion of economic losses accounting for 20% of New Zealand’s GDP [1, 24]. The CES began on 4 September 2010 with the Mw 7.1 Darfield earthquake. The Darfield earthquake was centered approximately 40 km west of Christchurch Central Business District (CBD) [12]. It affected mainly unreinforced masonry buildings, induced liquefaction in wider Christchurch and luckily, no lives were lost. In the next 15 months, the Canterbury region experienced numerous aftershocks with around 60 earthquakes above Mw 5 and hundreds over Mw 4, some of these such as the Mw 4.7 aftershock on 26 December 2010 resulted in further damage. Then on 22 February 2011 12.51 pm local time, a Mw 6.2 shallow aftershock occurred directly under Christchurch CBD at a depth of 5 km [13]. This was the most significant event in the CES. It happened near lunch time when office and street pedestrian occupancies were at their peaks. It caused collapses of unreinforced masonry buildings that were not already removed from earlier aftershocks, irrecoverable damaged to many mid-rise and high-rise buildings, and collapse of two notable concrete buildings that led to 135 of the total 182 human casualties in the event [18]. It also prompted liquefaction in Christchurch CBD and eastern residential areas which exacerbated building damage due to foundation displacement. Following this, there were a number of other aftershocks that led to further building damage. In total there were 11,200 aftershocks in the CES.
The CES highlighted a number of civil and earthquake engineering challenges, importance of liquefaction, short-term heightened seismicity, rock slope stability but also impacted the reconstruction and recovery [10]. An estimate of 70% of the Christchurch CBD was demolished or partly reconstructed. Significant parts of the CBD were cordoned off from public access for over 2 years from February 2011 until June 2013 [19]. The CES, being the fourth most costliest insurance event in history globally at the time, also extensively affected the local and global insurance sector regarding seismic building damage [20].
1.2 Seismic Insurance Following the Canterbury Earthquake Sequence
Many countries located near tectonic plate boundaries are exposed to frequent earthquakes. However, insurance uptake for geophysical events remains low (2% in Italy, 5% in Turkey, 9% to 11% in Japan, 10% in Mexico, 26% in Chile, 38% in US, and 80% in New Zealand [1]). New Zealand is an exception with an insurance penetration of 80% [1, 20]. Over the two years of the CES, major earthquake events and multiple aftershocks led to 77 events for which more than 650,000 insurance claims have been lodged [17]. Apportionment of the losses by sector is as follow: 59% account for the residential sector and 41% for the commercial sector [2]. Most of the claims for residential buildings were lodged for the main events of the 4 September 2010 and 22 February 2011. However, it was difficult to assess the exact impact of each earthquake and aftershocks on buildings. As the time between the event was too short to permit detailed building assessments following each event, especially for such a large number of affected buildings. This also led to significant legal challenges between claimants, insurers and reinsurers about the damage apportionment between events. Reports shows that 61% of the residential insurance claims were settled by the Earthquake Commission (EQC) and 39% by private insurers [2]. This distribution points the significant participation of EQC.
1.3 The Earthquake Commission
The Earthquake Commission (EQC) is a Crown entity which has for its mission to provide natural disaster insurance for residential property. EQC also manages the Natural Disaster Fund (NDF) and promotes research and education on solutions for reducing the impact of natural disasters. EQC involvement is particularly visible with the EQC insurance EQCover [5]. EQCover provides home and land insurance for natural disaster for every home that is covered by private fire insurance. At the time of the CES, EQC provided coverage for the first NZ$100,000 + 15% Goods and Service Tax (GST) of the building damage, NZ$20,000 + GST for contents and land damage up to the value of the damaged land (since 1 July 2019 the cap for residential building cover was increased to NZ$150,000 but do not include the cover for contents anymore). EQC accessed the NDF and its reinsurance cover to settle the claims. Before the CES, the NDF had a value of NZ$6.1 billion (more than US$4 billion) though this has now been significantly depleted to less than NZ$180 million following the CES and a smaller Kaikoura earthquake in 2016 [8, 11].
The CES brought major changes for New Zealand, especially for the insurance industry [16]. EQC increased the annual levy in order to replenish the NDF [4]. Owing to the largely unexpected losses for the private insurers since the CES, there had been a trend of increased scrutiny of the risk profile of any insurance cover. Private insurers are now currently applying risk-based premium pricing for earthquake covers. This had led to increased premiums and at times unavailability of earthquake insurance for some regions in New Zealand.
1.4 EQC’s Catastrophe Loss Models
Loss models are important for the insurance and reinsurance sector for quantifying probable losses to ensure adequate provisions in case of a catastrophe. EQC similarly relies on hazard and loss models for adjusting base cover, investment and reinsurance strategies and general planning for response to natural catastrophe [23].

(a) Overall Minerva system architecture, (b) Schematic diagram of the Earthquake Loss sub system used in Minerva [27]
Without minimizing the great improvement that these tools offered to the New Zealand insurance sector, limitations are still present. Since EQC offers natural disaster insurance for residential building on top of existing private insurance, EQC does not retain a database of its policyholders. It thus uses New Zealand records of real estate property as a base of its calculation [23]. This led to limitations regarding the accuracy of the exact loss prediction per asset. Moreover, the CES highlighted that the existing loss models did not accurately capture liquefaction. Additionally, the models usually took the building stock as undamaged at the time of the earthquake. But in the CES, the time between the events was too short such that the structures could not have been repaired or rebuilt. Cumulative damage occurred in reality but was not taken into account by the loss models [3].
1.5 Earthquake Commission Amendment Bill
On the 18 February 2019, the Earthquake Commission Amendment Bill 2018 (37-2) obtained royal assent [26]. The EQC Amendment Bill introduced changes including an increase in the time limit to lodge a claim following an earthquake event from three months to two years, the removal of the insurance cover for content, but an increase in the cap for the building cover from NZ$100,000 to NZ$150,000. At the same time, the bill brought revisions to the information sharing provision. EQC is now allowed to share information about the residential property claims, which have been lodged with EQC. Homeowners and prospective buyers can now ask EQC to provide them with information on residential property damage due to a natural disater [6]. The bill also enables EQC to share information for public good purposes [26] which is favorable to the here presented project. While access to EQC’s property and claim database was granted since November 2017, difficulties arose due to anonymized building coordinates. Before March 2019, the latitude and longitude of each building in EQC’s property database were rounded to approximately 70 m to protect privacy. This lead to the difficulty to relate each claim with a specific street address thus making impossible to merge EQC’s claim information with additional databases. The Earthquake Commission Amendment Bill 2018 (37-2) loosened the rules. EQC is now able to share the exact building location for each claim. This change in legislation enabled new opportunities for this research. The accurate building location enabled spatial joining and merging with new information on liquefaction, soil conditions, and building characteristics.
2 Developing a Loss Prediction Model Using EQC’s Residential Claim Database
2.1 Exploration of the Database
Following the changes brought by the 2019 Earthquake Commission Amendment bill, EQC provided access to the claim database for research purposes only. The exploration made in this paper uses the March 2019 version of the EQC claim database. Over 95% of the insurance claims for the CES have been settled by that time. However, revision of the event apportionment is still subjected to review meaning that the division of the cost between EQC and the private insurers can still change in future.
The EQC claim database is a wide dataset with 62 variables. It contains the relevant information related to the claims such as the date of the event, the opening and closing date of a claim, a unique property number, and the amount of the claim for the building, content and land. At the time of the CES in 2010–2011, EQC’s liability was capped to the first NZ$100,000 (+GST) of building damage. Costs above this cap are borne by private insurers if building owner previously subscribed to adequate insurance coverage. Private insurance could not disclose information on private claim settlement, leaving the claim database for this study soft-capped at NZ$100,000 for properties with over NZ$100,000 damage.
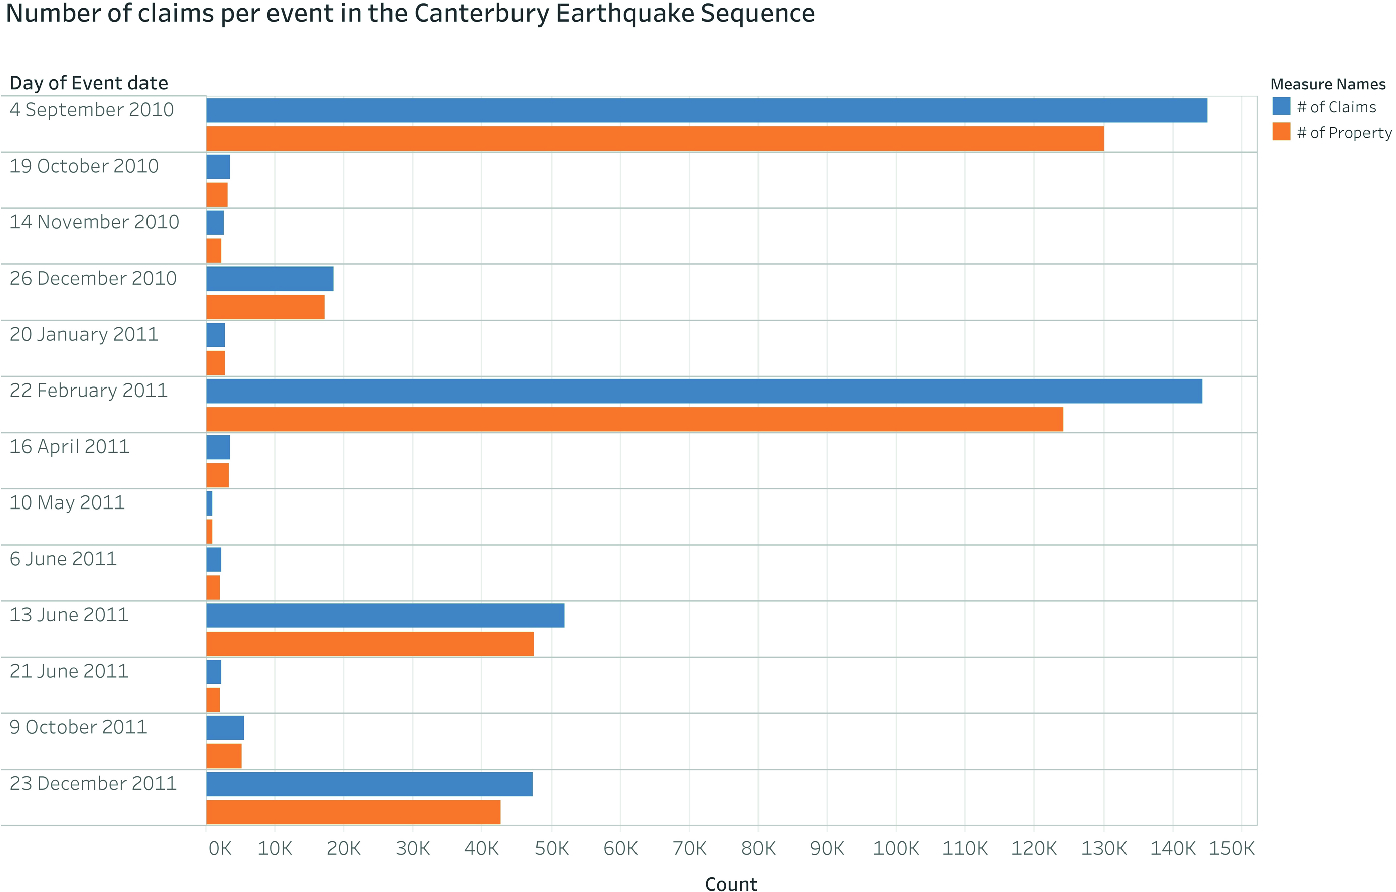
Number of claims per event in the Canterbury Earthquake Sequence
(Source: EQC database for claims on residential buildings)
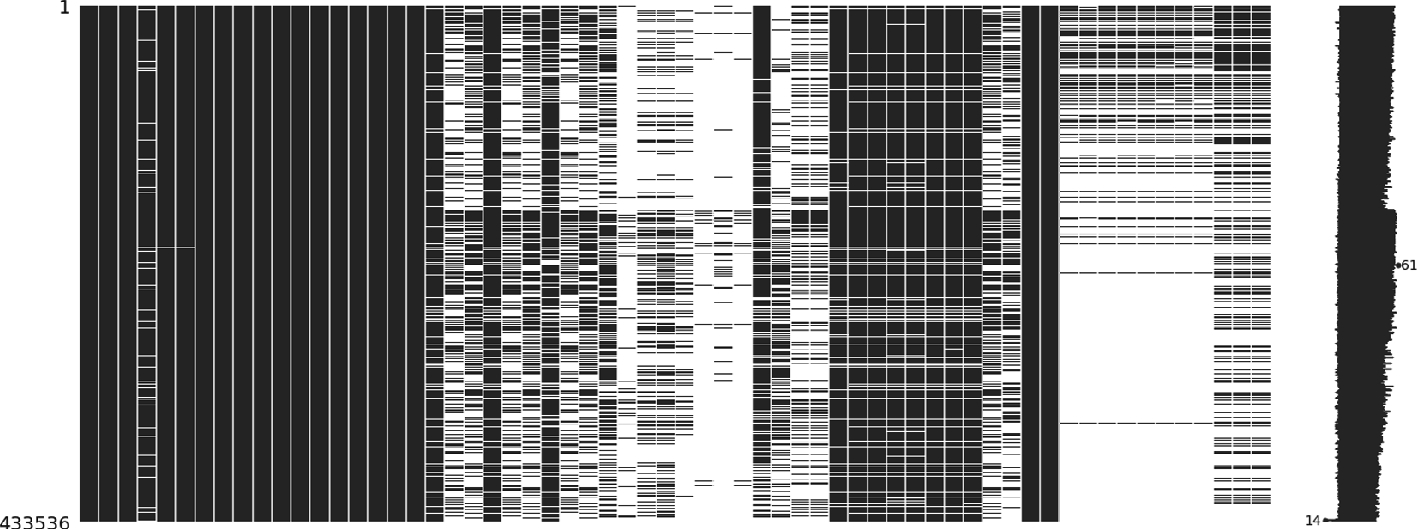
Graphical overview of the data in the EQC claim database for the Canterbury Earthquake sequence. Each column represent a variable and each claim is a row. White areas represent missing values.
2.2 Merging of Multiple Databases
To develop a loss prediction model using machine learning, it is necessary to overcome the limitations of missing data for key variables. This is addressed by combining information available in other sources. Figure 4 shows a schematic overview of the databases that are combined with the EQC database.

Overview of the available databases and steps to the final integrated database
2.3 Challenges and Lessons Learned
During the process of merging the databases together, several challenges were encountered. These challenges occurred primarily due to the non-exact matching of the coordinates between the databases. Figure 6 shows the location of the EQC claims compared to the actual location of the buildings taken from the RiskScape database. From the map it is to see that the points from the two databases are not close to each other. Additionally, for some property, it can be observed that the EQC database entails two points meaning that multiple claims have been lodged throughout the CES.

Location of the GeoNet recording stations in Christchurch and interpolation of the PGA for the 22 February 2011 earthquake

Comparison of the spatial location of the EQC claim data (blue dots) and the building location from RiskScape database (yellow dots) (Color figure online)

Comparison of the spatial location of the EQC claim data (blue dots) and the location of NZ street address (pink dots) (Color figure online)
In its raw version, EQC’s claim database is claim centric. This means one row of data corresponds to one claim, and the total damage to a property can consists of multiple claims or multiple rows of data filed at different dates, particularly due to the nature of multiple events in the CES. The combination of information with additional databases did not change the structure of the original EQC claim database. The final aggregated database retained a claim centric structure. The aim however, is to develop a machine learning model for the loss prediction on a building by building basis. It is thus necessary to have training data that contains only one unique ID per property. This was achieved by pivoting the database to make it property centric.
3 Future Model Development Using Machine Learning
The combined database will be used as an input for the development of a seismic loss prediction model for residential building in New Zealand. The additional variables obtained through data integration enrich EQC’s claim database. Machine learning is applied to process many variables and ‘learn’ from a large number of instances. Both the 4 September 2010 and 22 February 2011 events led to more than 140,000 claims each. This combined database constitutes the input of a machine learning model for seismic loss prediction.
In the development of the machine learning model, several algorithms such as linear regression, decision tree, support vector machine (SVM), and random forest will be applied. Their prediction accuracy will be compared and the algorithm leading to the most accurate prediction will be retained. The machine learning will be able to extract patterns from the integrated database and evaluate the relative importance of each variables. Nevertheless, particular attention will also be paid to human interpretability of the model. Whenever possible, intrinsically interpretable algorithms are preferred. More complex algorithms are always applied in combination with post hoc methods to allow for human interpretation. The aim is to develop a ‘grey-box’ model that would produce intermediate output, which allow modelers to look through and validate the predictions at various key intermediate steps. A ‘grey-box model’ would allow different stakeholders to extract information that matters to them. For instance, a Civil Emergency Manager could be interested in the number of inhabitable dwellings, whilst an insurer might be interested in monetary repair cost only.
A loss model built on machine learning offers the advantage to be retrained easily. Whenever new data becomes available, it will be possible to iterate and improve the model accuracy. The possibility to retrain a model also offers the opportunity to test different parameters and their influences on the final losses.
4 Conclusion
This paper demonstrated the complex process of combining data from multiple sources using GIS. The data integration process focused on having extensive information for each property damaged during the CES. It merged information about the building characteristics, soil type, liquefaction occurrence and seismic demand on top of EQC’s claim database. It resulted in a aggregated database that can later be used to develop a seismic loss prediction model for New Zealand using machine learning. It allows for a future analysis of the relationship between variables that are usually not directly considered in a building loss analysis.
We acknowledge EQC for generously providing the claim data to realize this study. Many thanks to Geoffrey Spurr for his interpretation, assistance and review of the paper. We gratefully acknowledge the New Zealand Society for Earthquake Engineering (NZSEE) for the financial support. Thanks also goes to Dr. Sjoerd Van Ballegooy for his insightful advices.