Since 2015, visitors to the National Museum of American History in Washington, DC, have been able to admire a cloth napkin with a drawing by Arthur Laffer. Although perhaps not the original napkin on which Laffer drew his namesake curve at the restaurant Two Continents in 1974—more likely a keepsake created years later—all the ingredients are there. There’s the economy’s tax rate on one axis and the amount of tax revenue collected on the other. When the tax rate is zero, no revenue is collected, which makes sense. As the tax rate rises, revenues first increase, but as the rate is further hiked, at some point they begin to fall. When the tax rate reaches 100%, revenues are back to zero. The lesson is simple: Too much tax kills tax. The napkin is dedicated to Donald Rumsfeld, who served as secretary of defense from 1975 to 1977 under Gerald Ford, and again from 2001 to 2006 under George W. Bush.
As a diagram, the napkin displayed in the museum is incomprehensible. It has everything upside down: the axes are inverted, and the equations all have the wrong signs. But while Laffer may not have been the mathematical wizard Frank Ramsey was, he had a point. If starting tomorrow all incomes were to be taxed at 100%, people either would expend a lot of effort hiding their earnings or they would stop working. Since a rate of 0% and a rate of 100% would both collect nothing, there must be some rate in between these two extremes, often called the Laffer rate, where tax revenues peak.
It is hard, of course, to know what this rate is: 50%? 60%? 80%? On purely logical grounds anything is possible, depending on how sensitive people are to taxation. But whatever rate corresponds to peak revenue, it seems we should never want to go beyond it. If we did it would mean collecting less revenue than with a lesser tax rate. No society should ever want to be on the “wrong” side of the Laffer curve, where revenues fall as tax rates rise. Right?
In this chapter, we want to explain why democratic governments may reasonably decide to pick tax rates that are above the revenue-maximizing rate for the rich, why destroying part of the tax base can be in the interest of the community. If this notion seems crazy to you, it’s because too much of the discussion about taxes has been based on napkin diagrams that ignore history, politics, and power relationships in a market economy. It’s time to move beyond Laffer.
TOP INCOME TAXATION BEFORE LAFFER
In one sense, the idea that very high tax rates can be good policy even if they raise little revenue should not be surprising, at least to an American reader. This was, after all, the official stance of the US government for many decades. As we saw in Chapter 2, from 1930 to 1980, the top marginal income tax rate averaged 78%; it exceeded 90% from 1951 to 1963. Policymakers understood, well before Laffer’s napkin, that faced with marginal tax rates of 90% even the most profit-driven individuals would be discouraged from raking in more income. From the presidency of Franklin Roosevelt to that of Dwight Eisenhower, it was clear that the top marginal income tax rates did not add revenue. They were of the “wrong” side on the Laffer curve. They destroyed income.
This was not a bug: it was the goal of the policy. The quasi-confiscatory top rates championed by Roosevelt and his successors in office were meant to reduce the income of the super-rich and thereby compress the income distribution. Recall that they applied to extraordinarily high incomes only, the equivalent of more than several million dollars today. Only the ultra-rich were subjected to them. In 1960, for example, the top marginal tax rate of 91% started biting above an income threshold that was nearly a hundred times the average national income per adult, the equivalent of $6.7 million in income today.1 The merely rich—high-earning professionals, medium-size company executives, people with incomes in the hundreds of thousands in today’s dollars—were taxed at marginal rates in a range of 25% to 50%, in line with what’s typical nowadays (for instance, in states like California and New York, when you count state income taxes).
The policy of quasi-confiscatory tax rates for sky-high incomes, according to the available evidence, achieved its objective. From the late 1930s to the early 1970s, income inequality fell. The share of pre-tax national income earned by the top 1% was reduced by a factor of two, from close to 20% on the eve of World War II to barely more than 10% in the early 1970s. In 1960, for example, only 306 families earned more than $6.7 million in taxable income a year, the threshold above which income was taxed at 91%.2 Meanwhile, the economy grew strongly. And as we saw in Chapter 2, the decline in inequality is not a fiscal illusion; it was a real phenomenon. There was, of course, tax avoidance. But it’s not the case that the wealthy sheltered enormous sums off the IRS radar. The fall in the top 1% income share we measure includes all forms of income earned, whether reported to the IRS or not—among them profits retained within companies, investments in tax-exempt bonds, and other tax shelters available at the time. The quasi-confiscatory top rates truly reduced the concentration of pre-tax income.
America was not alone in pursuing this policy. The United Kingdom went further, with top marginal income tax rates as high as 98% from 1941 to 1952 and in the mid-1970s (and always above 89% in between). Just like in the United States, these high rates applied to very few people and did not raise a significant amount of revenue. And just like in the United States, the concentration of income and wealth in the UK fell dramatically in the 1940s and remained at historically low levels until the late 1970s.
THE CASE FOR CONFISCATORY TOP INCOME TAX RATES
On both sides of the Atlantic during these eras, tax policy reflected the view that extreme inequality hurts the community; that the economy works better when rent extraction is discouraged; and that unfettered markets lead to a concentration of wealth that threatens our democratic and meritocratic ideals.
This view is at least as old as the United States itself, and not the appanage of Anglo-Saxon liberals. The idea that excessive wealth concentration corrodes the social contract is shared by illustrious conservatives. James Madison wrote in the late eighteenth century: “The great object [of political parties] should be to combat the evil: 1. By establishing a political equality among all. 2. By withholding unnecessary opportunities from a few, to increase the inequality of property, by an immoderate, and especially an unmerited, accumulation of riches.”3 Conservatives are more likely to argue that extreme wealth is “merited” (with arguments often involving sharp distinctions between good, “job-creating” American billionaires and bad Russian or African “kleptocrats”—arguments that ignore the frequent commonalities between these actors, such as their monopoly power and influence on lawmaking). This important difference notwithstanding, even conservatives often agree that extreme wealth can in and of itself be a bad thing, which is probably one of the reasons why the FDR policy of quasi-confiscatory top income taxation was continued by Republican administrations until Reagan. Excessive wealth concentration, in Madison’s view, was as poisonous for democracy as war. “In war, too, the discretionary power of the Executive is extended; its influence in dealing out offices, honors, and emoluments is multiplied . . . The same malignant aspect in republicanism may be traced in the inequality of fortunes.”4
Wealth is power. An extreme concentration of wealth means an extreme concentration of power. The power to influence government policy. The power to stifle competition. The power to shape ideology. Together, they are the power to tilt the distribution of income to one’s advantage—in the marketplace, in governments, in the media. This is, and has always been, the core reason why extreme wealth owned by some can reduce what remains for the rest of us. Why the income of today’s super-rich can be gained at the expense of the rest of society. That’s what earned John Astor, Andrew Carnegie, John Rockefeller, and other Gilded Age industrialists their epithet of “robber barons.”
What do Apple, Jeff Bezos, and the Walton heirs do today? They protect their wealth. They defend their established positions. They buy new entrants before they become a threat to their business. They fight competitors, regulators, and the IRS. They buy newspapers. That’s what those who’ve accumulated billions, always and everywhere, do. The founders of Apple, Amazon, and Walmart all innovated a great deal and created new products and services. Some have not stopped. But tomorrow’s greatest innovations aren’t likely to come from the heirs of successful founders, nor from companies that for years have topped the Fortune 500 ranking.
This is the theoretical case for going beyond Laffer. Extreme wealth, like carbon emissions, imposes a negative externality on the rest of us. The point of taxing carbon is not to raise revenue but to reduce carbon emissions. The same goes for high tax rates on the very highest incomes: They are not aimed at funding government programs in the long run. They are aimed at reducing the income of the ultra-wealthy. They prevent or impede the various forms of rent extraction associated with extreme and entrenched wealth and with the reality of the market economy in unequal societies.5 What’s the point of negotiating a $20-million salary, of earning millions by creating zero-sum financial products, of spiking the price of patented drugs, when out of any extra dollar earned, 90 cents will go the IRS? When in place, quasi-confiscatory tax rates redistribute economic power, equalize the distribution of pre-tax income, and make the marketplace more competitive.
From a purely logical perspective, this argument—the standard justification for tamping down the inequalities generated by free-market economies—can also work in the other direction. Maybe the externality of extreme wealth and huge incomes is positive. Maybe the ultra-rich bring more to society than what they privately earn. Maybe we all benefit from Bill Gates earning billions today and would all be worse off if these billions were taxed away—for instance because it would mean less funding for the Bill & Melinda Gates Foundation, which according to some observers spends its funds better than the government. This is a variation on the famous trickle-down theory, according to which the fortunes of the rich ultimately trickle down to the rest of society.
To think more deeply about whether the theoretical case for going beyond Laffer has empirical merit today, we need one thing that’s too often missing from this debate: data.
THE BENEFITS OF EXTREME WEALTH: A DEBATE WITHOUT DATA
A scientific perspective on these questions requires a great deal of data. How does the prosperity of the ultra-wealthy—and the public policies that influence it—affect not only the overall growth rate of the economy, but also the dynamics of income for each social group? Do working-class incomes blossom when the rich are taxed less? To start with, we need to study the growth of income across the various groups of the population.
The national accounts, unfortunately, only provide information about the growth of total national income. They offer no data on how income grows in each social group. It’s a major lacuna of government statistics. A few years ago, we embarked on a journey to remedy this gap. Our goal? Track who has really benefited from economic growth over the last decades—for instance how growth has been distributed to the working class, the middle class, the affluent, and the super-rich. Headline growth numbers matter for this assessment, but they are too coarse: what matters is how income is growing for teachers and bankers; for retirees and working-age adults—for every profession and every condition.
We created “distributional national accounts,” a database that systematically allocates national income among all adults who live in the United States each year. It is impossible to know how much each person earns exactly—there is no administrative file anywhere that records this information in a comprehensive way—so the observations in our database do not correspond to any real person. They are synthetic observations, constructed by statistically combining tax returns data, surveys of household income and wealth, Social Security statistics, and many other sources of official data. Altogether, the synthetic, fictitious Americans in our database are fully representative of the US population. Their income adds up to total national income in the economy, and their income has grown on average 1.4% a year since 1980, matching the macroeconomic statistics.
Our computations are in no way definitive. Our hope is that this work will be taken over and improved by government statisticians, and eventually that public agencies will publish their own official distributional national accounts. The national accounts we use today were created in much the same way in the middle of the twentieth century. In the meantime, we believe the merit of our work is its consistency (growth across the income ladder adds up to macroeconomic growth), transparency (our code and sources are publicly available), and universality (similar statistical methods are applied in other countries).6
1946—1980: HIGH AND EQUITABLE GROWTH
What really happened in the era of quasi-confiscatory top marginal income tax rates?
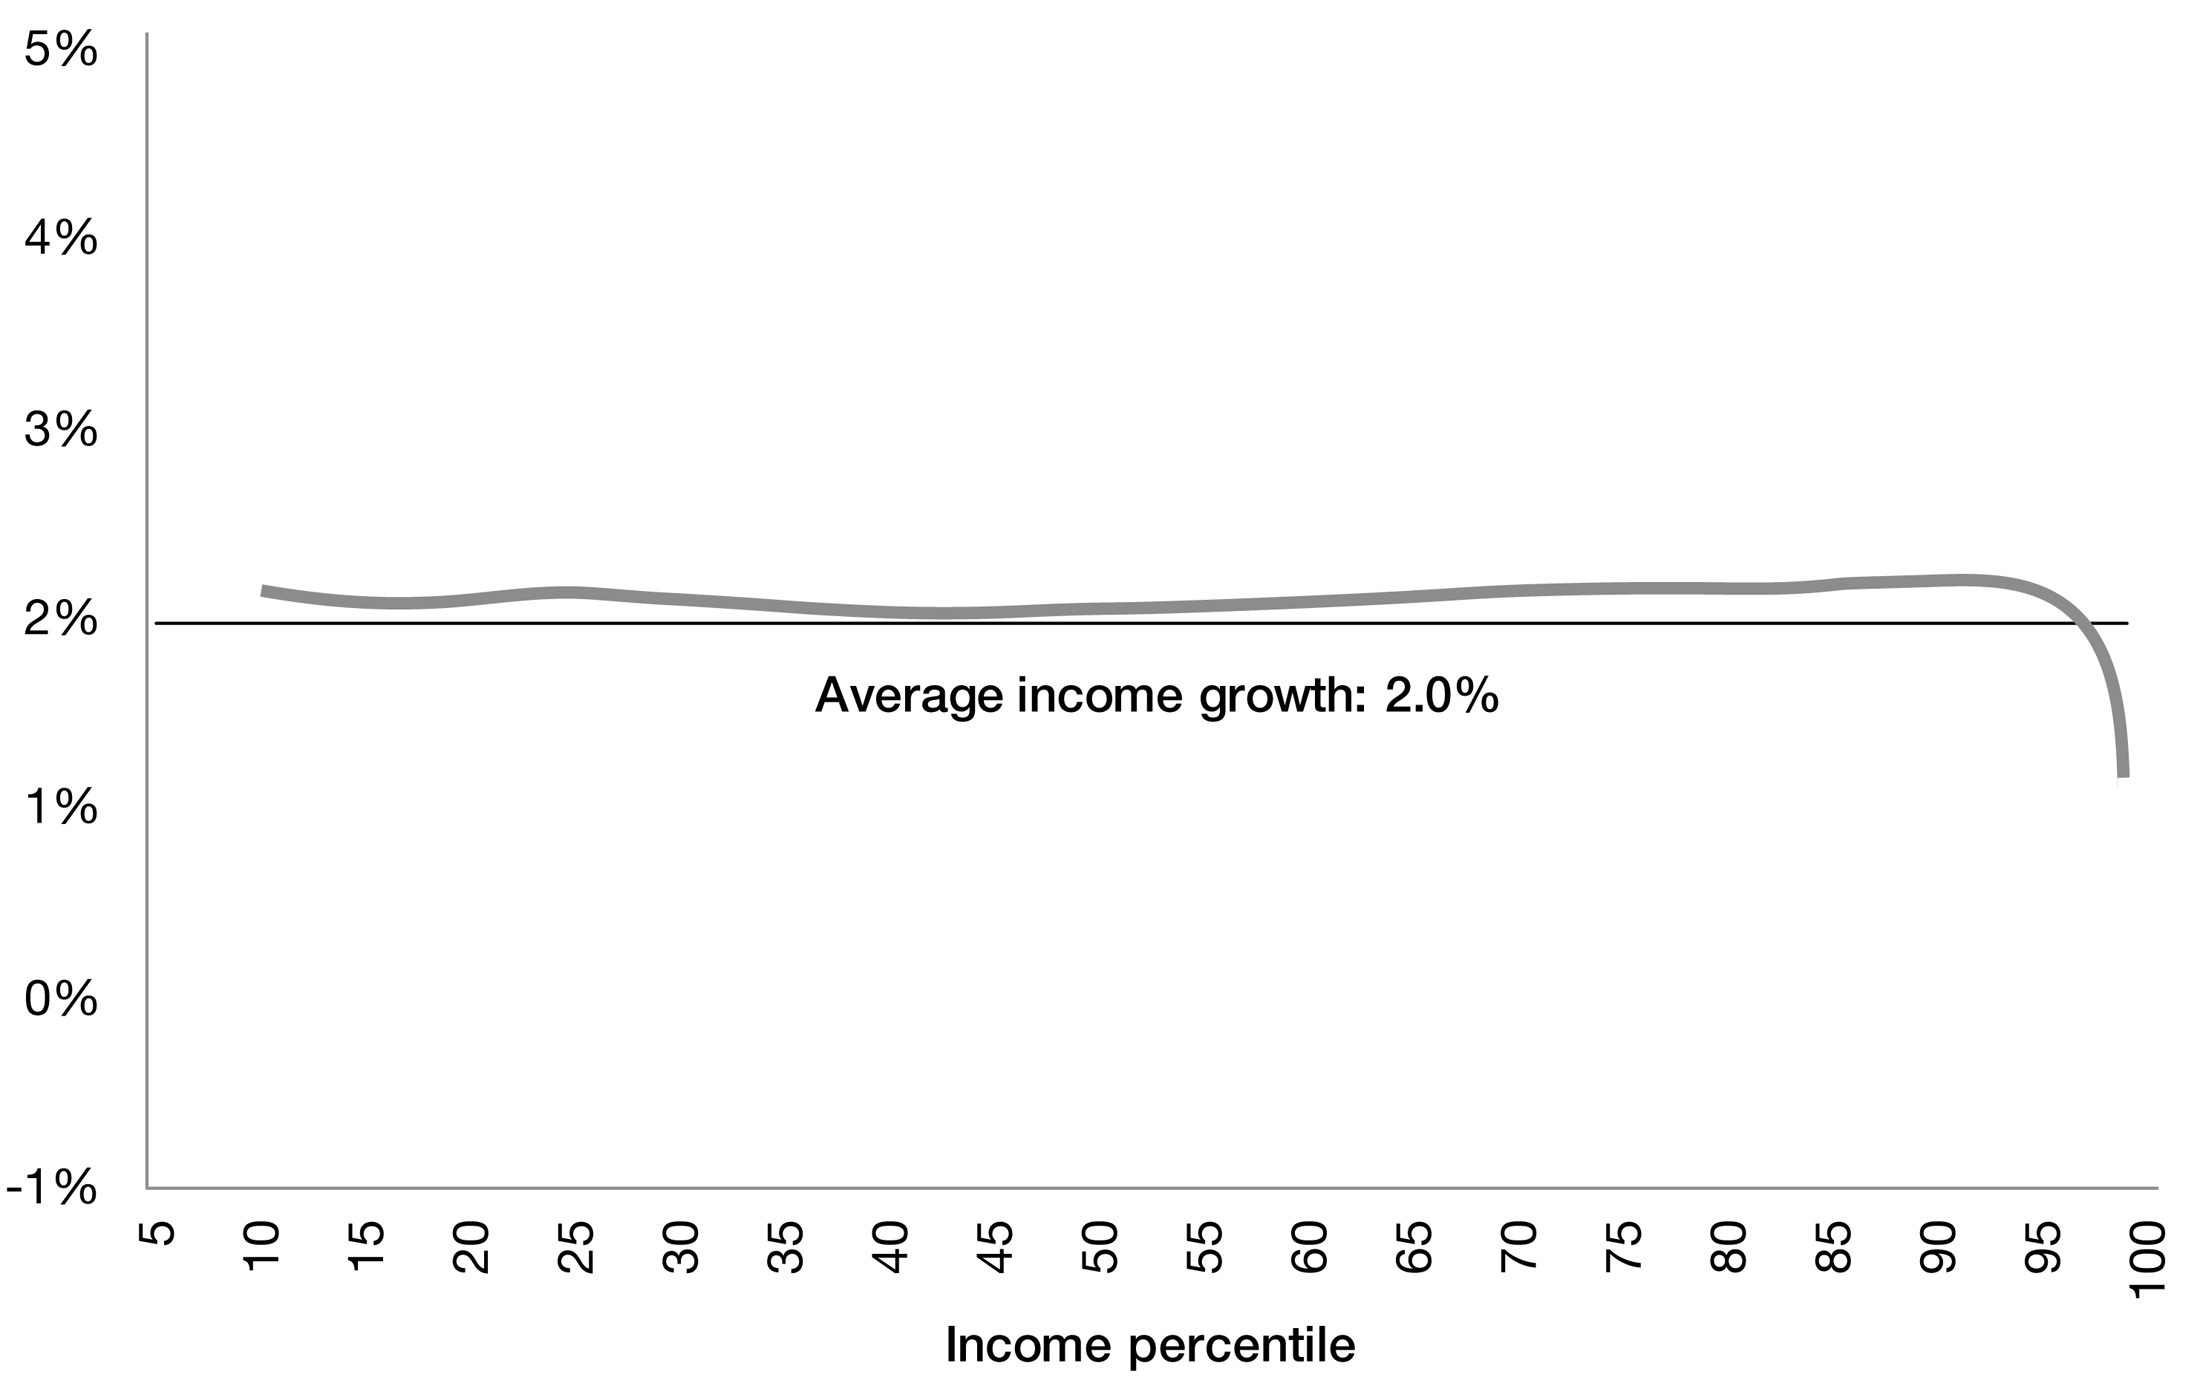
To visualize who benefited from growth at that time, we divide the population into a hundred equal-sized groups (100 percentiles) and compute the growth rate of average income in each of these groups over time. Given that the top percentile earns a large fraction of national income, we switch to finer subgroups at the top: dividing the top 1% into ten groups, and in turn dividing the top 0.1% into ten subgroups. With these groups in place we can compute growth rates from minimum-wage workers up to billionaires.
What do we see? In the decades after World War II, growth was strong and widely shared. From 1946 to 1980, average per adult national income rose 2.0% a year, one of the highest growth rates recorded over a generation in a country at the world’s technological frontier. Nearly every group saw its income grow at the macroeconomic rate of 2.0% a year (see Figure 8.1). The only exception involves the 1% highest income earners, who grew more slowly than the wider economy. But apart from that one dot, the similarity in the growth experience of the various social groups is stunning. One easily understands why economists chose, during this period, to model the economy on a single “representative agent.” Almost every social group was behaving like the economy as a whole.
1980—2018: THE WORKING CLASS SHUT OFF FROM ECONOMIC GROWTH
The picture for the period from 1980 to 2018 looks completely different.
First, average growth slowed down. The first characteristic of the Reagan and post-Reagan US economy is poor growth performance. Since the financial crisis of 2008–2009 growth has picked up slightly (especially compared to what has happened in Europe), but if we look at a longer period—one that averages booms and busts, recessions and the recoveries that follow—things do not look good. Since 1980, national income per adult has grown only 1.4% on average per year. And since the turn of the twenty-first century, it’s grown by even less than that: 0.8% a year.
8.1 FROM A RISING TIDE THAT LIFTS ALL BOATS TO ONE THAT LIFTS ALL YACHTS
Annual growth of pre-tax income by income group, 1946–1980
Annual growth of pre-tax income by income group, 1980–2018
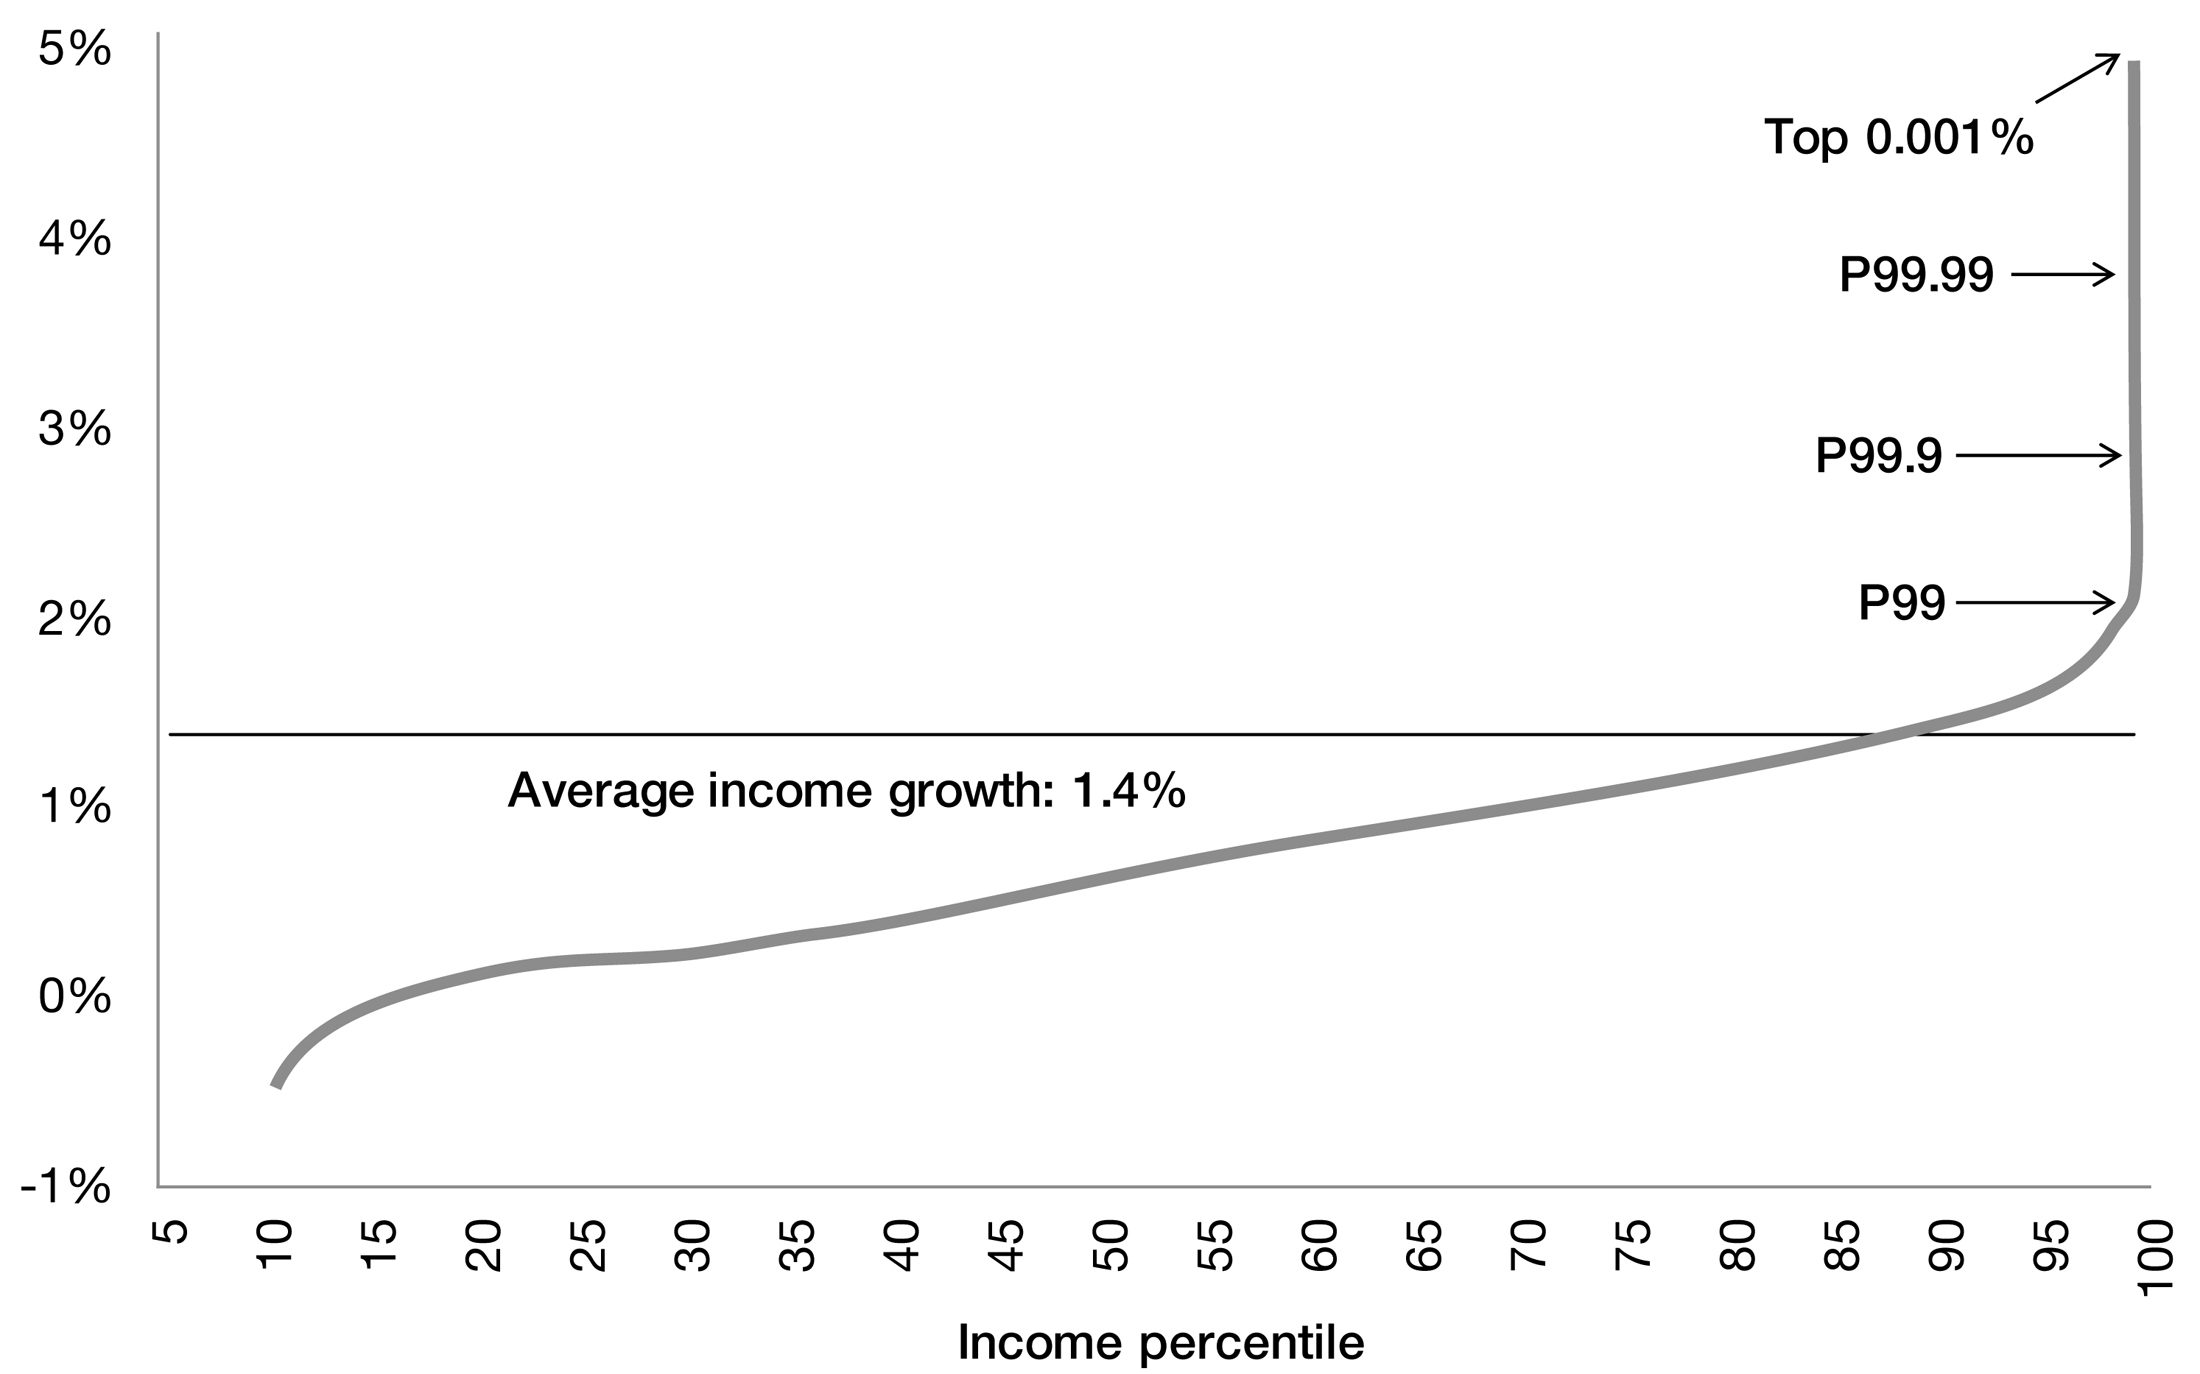
Notes to Figure 8.1: The figure depicts the annual real pre-tax income growth per adult for each percentile of the income distribution in the 1946–1980 period (upper panel) and 1980–2018 period (lower panel). From 1946 to 1980, growth was evenly distributed with all income groups growing at the macroeconomic average 2% annual rate (except the top 1%, which grew slower). From 1980 to 2018, growth has been unevenly distributed with very low growth for bottom income groups, mediocre growth for the middle class, and very high growth at the very top. Complete details at taxjusticenow.org.
Second, most social groups did not experience anything close to the headline rate of growth of 1.4%. For almost 90% of the population, growth has been below—often much below—that figure. Only the top 10% highest income earners have experienced growth at or above 1.4%. If you pick a group at random, its income growth will most likely have no relation to how well the economy performed. There has been a massive disconnect between the economy’s growth (1.4%) and people’s growth (the average growth of each person’s income is 0.65%). The fiction of a “representative agent” is dead.
Meanwhile, America’s affluent have prospered. Look at the spike on Figure 8.1. It shows that the rich—adults within the top 1%, with more than $500,000 in income today—have received big raises. And for a tiny minority, growth has skyrocketed. For the highest 0.1% of earners, incomes have grown 320% since 1980; for the top 0.01%, incomes have grown by as much as 430%. And for the tip-top 0.001%—the 2,300 richest Americans—incomes have grown by more than 600%.
Over those same forty years, the working class—the half of the population with the lowest incomes—has received almost no raise. The average pre-tax income of the bottom 50%, which amounts to $18,500 in 2018, has barely increased: adjusted for inflation, it was around $17,500 in the late 1970s. This corresponds to an annual growth rate of 0.1% over four decades. It’s not only that the share of income going to the top has risen since 1980. It’s that their absolute income has skyrocketed, while that of half of the population flatlined. There is no evidence that the income of the rich has “trickled down” to the working class. The working class has been shut off from economic growth.
This evidence, we are aware, does not prove that trickle-down policies have hurt the working class. It doesn’t prove that the fortunes earned by the ultra-rich have been gained at the expense of the rest of the population. From a purely logical perspective, it is possible that the working class would have fared even worse if tax policy had not favored the wealthy. That instead of growing 0.1% a year on average over the last four decades, the group’s real income would have fallen. It doesn’t seem very plausible, but it cannot a priori be ruled out. Statistics of income growth by percentile are extremely useful, but considered alone they cannot provide definitive answers on the merits and demerits of various public policies. We can’t, alas, time-travel back to 1980 and run an experiment where tax rates would remain at their 1980 level to see what would have happened.
But a comparison with income growth in the post–World War II decades does not vindicate the trickle-down theory, to say the least.
WORKING-CLASS INCOME GROWTH: A TALE OF TWO COUNTRIES
Comparing US results with countries that have implemented other policies since 1980 does not vindicate trickle-down theory either.
Let’s look at France, a country that is broadly representative of continental Europe. Average national income per adult is higher in the United States than in France: today, about 30% higher. This is not because Americans are more productive on average, but because they work more: they start working earlier in life (in part to pay for higher college costs), they retire later (in part to make up for smaller Social Security benefits), and in between they get fewer holidays and shorter parental leaves. In terms of productivity, the United States and France look the same. Gross domestic product divided by the number of hours worked—the most meaningful way to gauge productivity—is comparable, at around $75 today, and it has been following the same trend for some time.7
Despite Americans working longer hours, if we restrict our analysis to the bottom 50% of the population the average income per adult is 11% higher in France. On strictly monetary terms (disregarding its better health outcomes and more extensive leisure time) the working class—half of the population—is better off in France. The French welfare state is not responsible for this feat: we’re talking here about income before government taxes and transfers. Once you account for public funding devoted to childcare, health, and education, the working class fares even better in France—not a huge surprise. What’s interesting is that for most of the population, the market delivers higher incomes in France than it does in the United States.
This was not always the case. While the income of the working class has stagnated in America over the last four decades, in France it has grown. At 0.8% a year on average that growth has not been stellar, and since the Great Recession of 2008–2009 it has stopped altogether. But 0.8% a year over a generation, even if it’s not much, is better than 0.1%. It’s been enough for the French working class to surpass its American counterpart: While average income for the bottom half of the population is $2,000 lower in the United States than in France today, it was $2,000 higher in 1980.
Some argue that the stagnation of the American working class was inevitable. They cite a confluence of economic forces—technological progress, increased international trade—that have made workers durably less productive and what they produce less in demand. Comparing the United States and France makes the problem with this world view clear. Both the French and the American economies have been subject to the same waves of technological progress—the use of computers is no more prevalent on one shore of the Atlantic than on the other. Both trade with emerging economies. Many workers, in both countries, have been displaced by machines in the automobile sector and other industries. Yet in France, working-class income has grown—not a lot to be sure, but it has increased 30% since 1980—while it has flatlined in America. There lies a key lesson: technological change and pressures from globalization cannot be the main culprits for the woes of America’s working class.
8.2 THE PLIGHT OF THE AMERICAN WORKING CLASS
(Average pre-tax income of the bottom 50%, United States versus France, 2018 US dollars)
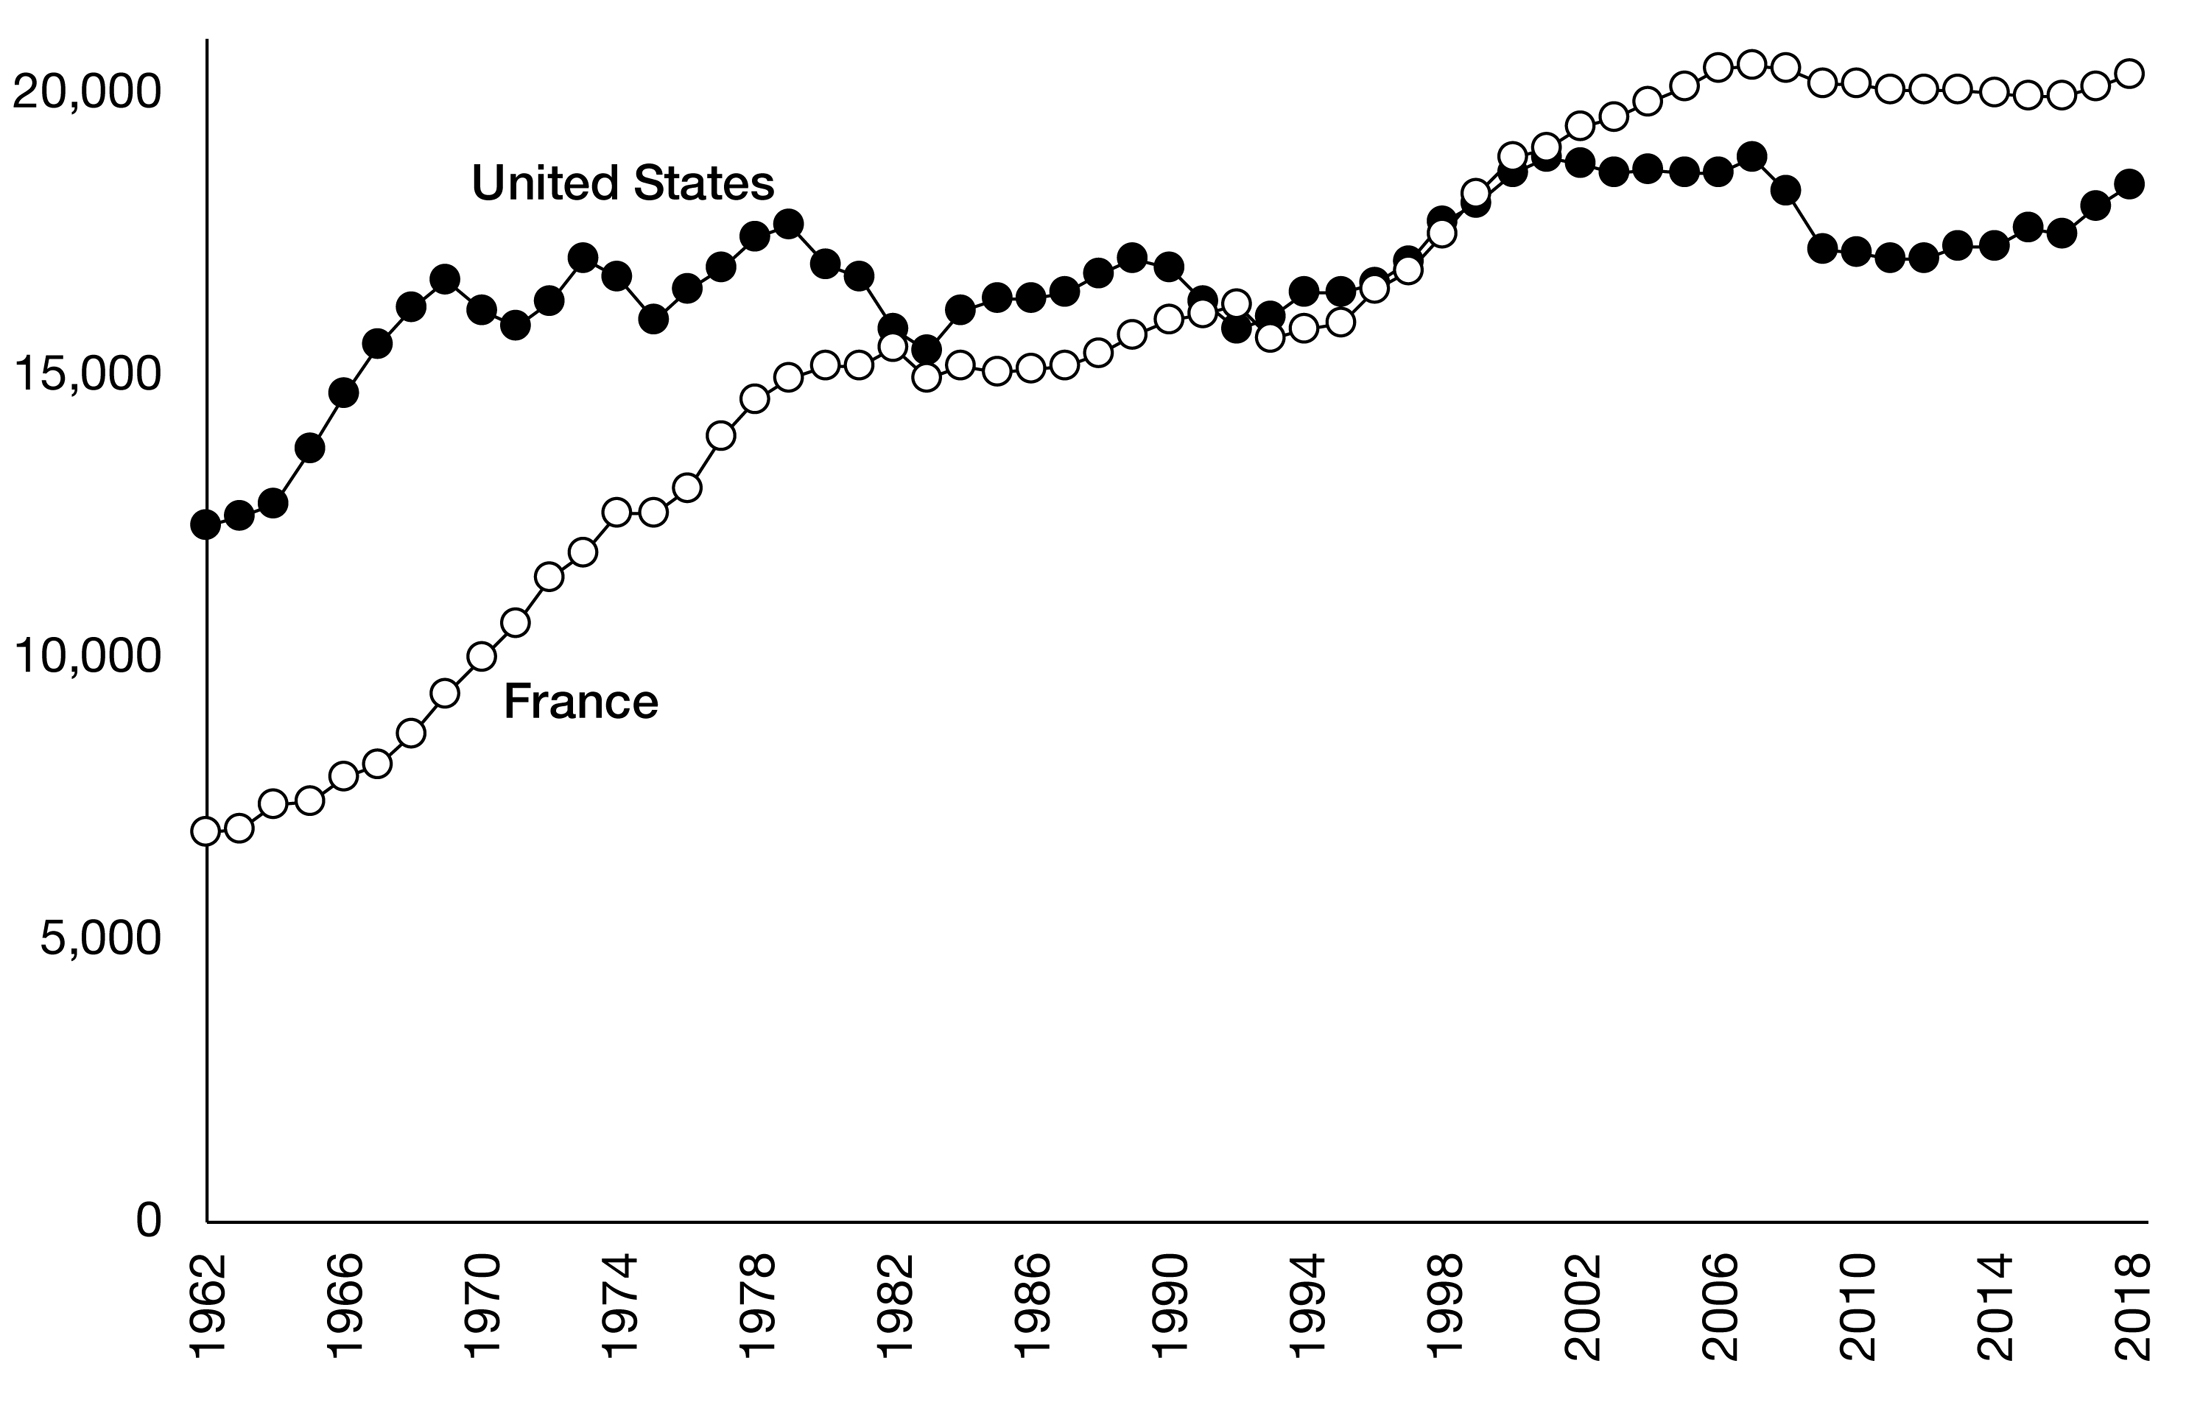
Notes: The figure shows the average income per adult for the bottom 50% of income earners in the United States and in France since 1962, before government taxes and transfers. The series are expressed in 2018 US dollars, using purchasing power parity exchange rates to convert euros into US dollars. In France, bottom 50% incomes have grown faster and are now higher than in the United States. Complete details at taxjusticenow.org.
The notion that the working class has suddenly become less productive in America does not bear scrutiny. The international evidence suggests that government policies have redistributed income away from the working class and toward the top. Successive administrations since the 1980s have made deliberate choices in this regard, including letting the federal minimum wage erode, cutting taxes on the wealthy, restricting the power of unions, and increasing the costs of access to public universities.8 France and most other rich countries have experienced some of the same policy changes themselves, but the turn to market fundamentalism has been more drastic in America.
IS GROWTH UNDERESTIMATED?
The stagnation of working-class income over more than a generation is perhaps the most fundamental development in the US economy, one with profound political and economic implications. It is so striking that to some observers, it must be wrong. We must be underestimating the true progress in living conditions. This is an objection that we must discuss before we can draw policy lessons. It comes in three flavors.
The first is that official statistics underestimate growth rates because they overestimate the true inflation rate. When measuring growth, statisticians try hard to tease out what fraction of the increase in national income comes from a real increase in production and what merely owes to the general rise in prices. This is not a perfect science. If we produced the exact same goods and services every year, it would be a straightforward task. But the nature of economic growth means that over time product quality tends to increase. When the price of a good rises, is it because its quality has improved or because of a general increase in prices? Sometimes quality changes are directly observable and statisticians can easily account for improvements—for instance, TV screens are larger than they were twenty years ago. But sometimes quality improvements are less easy to quantify—as in the case of less invasive surgery or more user-friendly computer software. Another difficulty is that businesses, among them Google and Facebook, sometimes provide services for which they don’t charge their customers. We don’t pay for the geolocation service provided by Google maps and as a result that service doesn’t get counted into national income.
These knottier questions have led some observers to suggest that national account statistics (and therefore our distributional national accounts) underestimate growth. More or less everyone who’s been involved at a high level in economic policymaking over the last decades, or an influential figure in the new economy, says it. Martin Feldstein, chair of President Reagan’s Council of Economic Advisers: “the official data understate the changes of real output and productivity.”9 Bill Gates: “GDP understates growth even in rich countries.”10 The line of argument is a favorite of Silicon Valley–linked economists: “There is a lack of appreciation for what’s happening in Silicon Valley, because we don’t have a good way to measure it,” according to Google’s chief economist Hal Varian.11 All of these comments suggest there’s a hidden growth miracle acting on the economy, if only we can find a way to measure it.
As a matter of principle, these objections are legitimate. However, recent academic work suggests that once we account for these hurdles, the picture painted by the official numbers does not improve much. If anything, the growth slowdown between the 1946–1980 period and the post-1980 period may be even stronger than we think.12 The reason is simple: the concerns outlined by Bill Gates and others aren’t new; they are inherent to the process of economic growth itself. The same issues arose before the 1980s—and mattered perhaps even more back then. Yes, there have been improvements in the quality of our smartphones—just like the quality of cars and household appliances increased in the decades after World War II. Yes, some of the new services produced by Silicon Valley are free—but so was radio and television programming. Overall, US national income per adult might have grown 1.5% a year on average since 1980 instead of 1.4% as in the official data. But by that same token, growth from 1946 to 1980 was also probably stronger than what we believe—2.2% instead of 2.0%, perhaps. Correcting the full time series of official data would make the growth slowdown even starker. And it would barely affect the income growth of the working class (0.2% a year, perhaps, instead of 0.1%).
The official statistics, instead of being too dark, may in fact be too rosy. Why? Because if quality improvements are sometimes hard to quantify, so too are quality deteriorations. Air travel is a classic example of a service whose quality has declined since the 1980s. More seriously the growth statistics omit the dramatic deterioration of the climate and the decline in biodiversity. On balance these mismeasured degradations are likely to matter more than the mismeasured increases in output. Google Maps is wonderful, but perhaps not as important as the future of the planet.
The second argument that growth statistics misrepresent the true economic progress of the working class centers on mobility. The individuals who make up the bottom 50% change from one year to the next. Some ascend the income ladder and leave the group as others enter. Immigrants also come into the United States. If, instead of comparing average income in each group over time, you follow a single person over the years, some commentators believe the working class can be shown to have flourished. This argument expresses the popular belief in America as “the land of opportunity.”
Alas, it’s a fallacy. There is income mobility: People’s incomes typically rise over their lifetime. Wages increase with job experience, workers get promoted, and so on. But what the statistics show is simple: working-class Americans do not earn more, on average, than their parents did at the same age.13 At every stage of their life cycle, they’re no better off than the previous generation. To understand why it’s fallacious to claim that the working class has flourished when you follow people over time, consider the following thought experiment. Imagine we lived in a world with zero national income growth, a world where old cohorts are replaced year after year by younger generations who start with relatively little income. In such a world, everybody’s income would grow over their lifetime, despite the stability of national income. Looking at this zero-growth economy, would it make sense to extol the virtues of progress? No. That working-class peoples’ incomes rise over their life cycle does not indicate that the working class is prospering in any meaningful sense.
And what about immigration? Is it the case that many working-class people in America have arrived from foreign countries where their wage was even lower? Some new Americans do meet these criteria, but overall their statistical effect is too small to matter much. From 2010 to 2016, the annual inflow of permanent immigrants in the United States averaged 0.33% of the population—two to three times less than in nations like Canada, Germany, the Scandinavian countries, and the United Kingdom.14 The United States had been a low-immigration country since well before the arrival of the Trump administration.
THE LIMITS OF REDISTRIBUTION
The last argument that growth statistics misrepresent the true growth of the working class involves government redistribution. Our estimate that average working-class income has grown only 0.1% a year since 1980 captures income before taxes and government transfers. As we’ve seen, taxes have increased. But government transfers have increased even more. As a result, on a post-tax and transfer basis, average working-class income has grown a bit more.
The effect is not large. After taxes and transfers, growth for the bottom 50% remains scant, about 0.6% a year since 1980. And before praising the equalizing effects of government transfers too quickly, let’s pause. What are these transfers that have increased? The answer is simple: Medicare and Medicaid, chiefly. It’s not that the government has been protecting the most vulnerable among us through cash transfers. Or alleviating the growing costs of raising kids by subsidizing parents. Instead, it’s been paying for a large share of the soaring health bill of the country. The “beneficiaries” of this largess cannot choose to spend it as they see fit. The money is not flowing to their bank account. It’s flowing to the bank accounts of health care providers, some of whom are comfortably in the top 1%. Are we sure the services provided in exchange are worth every penny?
In the end, the most striking indictment of market fundamentalism emerges from what has happened to life expectancy in the United States. Life expectancy is easier to measure than income; in many ways it is also more informative than the more materialistic notions of well-being discussed so far. Most people care about living a long, healthy life more than anything else. On average, for every five dollars they earn every year, Americans pay one dollar to doctors, hospitals, pharmaceuticals, and insurance companies. They have never spent as much on health care as they do today, and they spend much more on health care than residents of any other country. And yet, Americans’ life expectancy is falling. It fell for the third straight year in 2017. In 1980, life expectancy in America exceeded that of other OECD nations by 1.5 years. Today it is almost two years less than in other wealthy countries.15
This deterioration took place gradually; its timing precisely mirrors the gradual worsening of relative living conditions for the working class. The affluent live longer, the poor die younger. In recent history, there is only one comparable example of life expectancy falling during peacetime—Russia during the chaotic transition away from communism in the first half of the 1990s.
This stunning inversion of life expectancy outcomes suggests there are good reasons to believe our income growth statistics do not exaggerate the woes of the American working class, but in fact underestimate them.
CURBING WEALTH CONCENTRATION: A RADICAL WEALTH TAX
This is, then, the empirical case for going beyond Laffer. Whether we compare the last four decades to the postwar period, or today’s America to other wealthy nations, it seems that the upsurge of the super-rich has not benefited the rest of the population—but has been chiefly at the expense of the working class.
In retrospect, this should not be a terrible surprise. Supply-side policies boost, well, the supply. But the supply of what, exactly? Do these policies encourage teachers, inventors, and scientists to work more? Perhaps. It doesn’t sound very plausible, but as a matter of logic it’s not impossible that at least some of them are motivated by the lure of immense profits and work harder when taxes are low. Whatever their sensitivity to after-tax returns, however, it’s clear they are not the people most responsive to monetary gains. The sellers of zero-sum financial products, the creators of deadly pills, the promoters of tax dodges and the lawyers who certify them, the price gougers, the patent trolls, the makers of fake university diplomas: they will rise to the occasion and supply more of their labor when taxes fall. These solely profit-driven individuals will innovate more boldly—faster and faster, making it harder and harder for regulators to catch up, or for people to learn about their fraud before falling for a new one. If low top tax rates encourage innovation, they must galvanize rent extraction.
Among the many policies that can curb the power of established wealth and contain rent-seeking, the quasi-confiscatory taxation of very high incomes historically has proved effective. But it faces a major limitation: as we’ve seen, it’s become too easy for the very rich to own a lot of wealth while reporting little taxable income. Reinstating a 90% top marginal income tax rate would not make a meaningful difference to the tax bills of many of America’s billionaires.
Overcoming this limitation requires taxing top wealth itself at high rates. A moderate wealth tax at a marginal tax rates of 2% above $50 million and 3% above $1 billion, such as the one discussed in the previous chapter, would generate a lot of revenue—about 1% of GDP each year, according to our estimates. It would be on the “good” side of the Laffer curve.
Consider now a radical wealth tax with a marginal tax rate of 10% above $1 billion. A person with $1 billion in wealth would pay the same $19 million as under a moderate wealth tax.* A radical wealth tax would not make it harder to become a billionaire; it would make it harder to remain a multibillionaire. A person with $2 billion would pay almost 5% a year, a decabillionaire like George Soros 9%, and a centibillionaire like Jeff Bezos 10%. Just as Roosevelt’s 90% top marginal income tax sharply reduced the number of families earning more than $10 million of today’s dollars, a radical wealth tax would lead to a reduction in the number of multibillionaires. More than collecting revenue, it would de-concentrate wealth.
There would still be multibillionaires, no doubt. If a wealth tax of this higher sort had been in place over the last decades, Mark Zuckerberg would still be worth $21 billion in 2018—instead of the $61 billion recorded by Forbes. Why? Because Zuckerberg’s wealth has grown at a rate of 40% a year since 2008 when he first became a billionaire. A 10% annual wealth tax would not have stopped his stratospheric ascent. But a more mature billionaire such as Bill Gates would be worth $4 billion “only”—instead of $97 billion in 2018—because he has been a billionaire for over three decades now, giving the radical tax more time to grind his wealth down. If a radical wealth tax had been in place since 1982, most of the 400 richest Americans would still be billionaires in 2018, but they would be only one third as wealthy as they currently are. Their share of America’s wealth would be similar to what it was back in 1982, before the huge increase in wealth inequality took place.
8.3 A WEALTH TAX TO LIMIT THE RISE OF INEQUALITY . . . OR DE-CONCENTRATE WEALTH?
(Share of wealth owned by the Forbes 400: actual versus with wealth taxation since 1982)
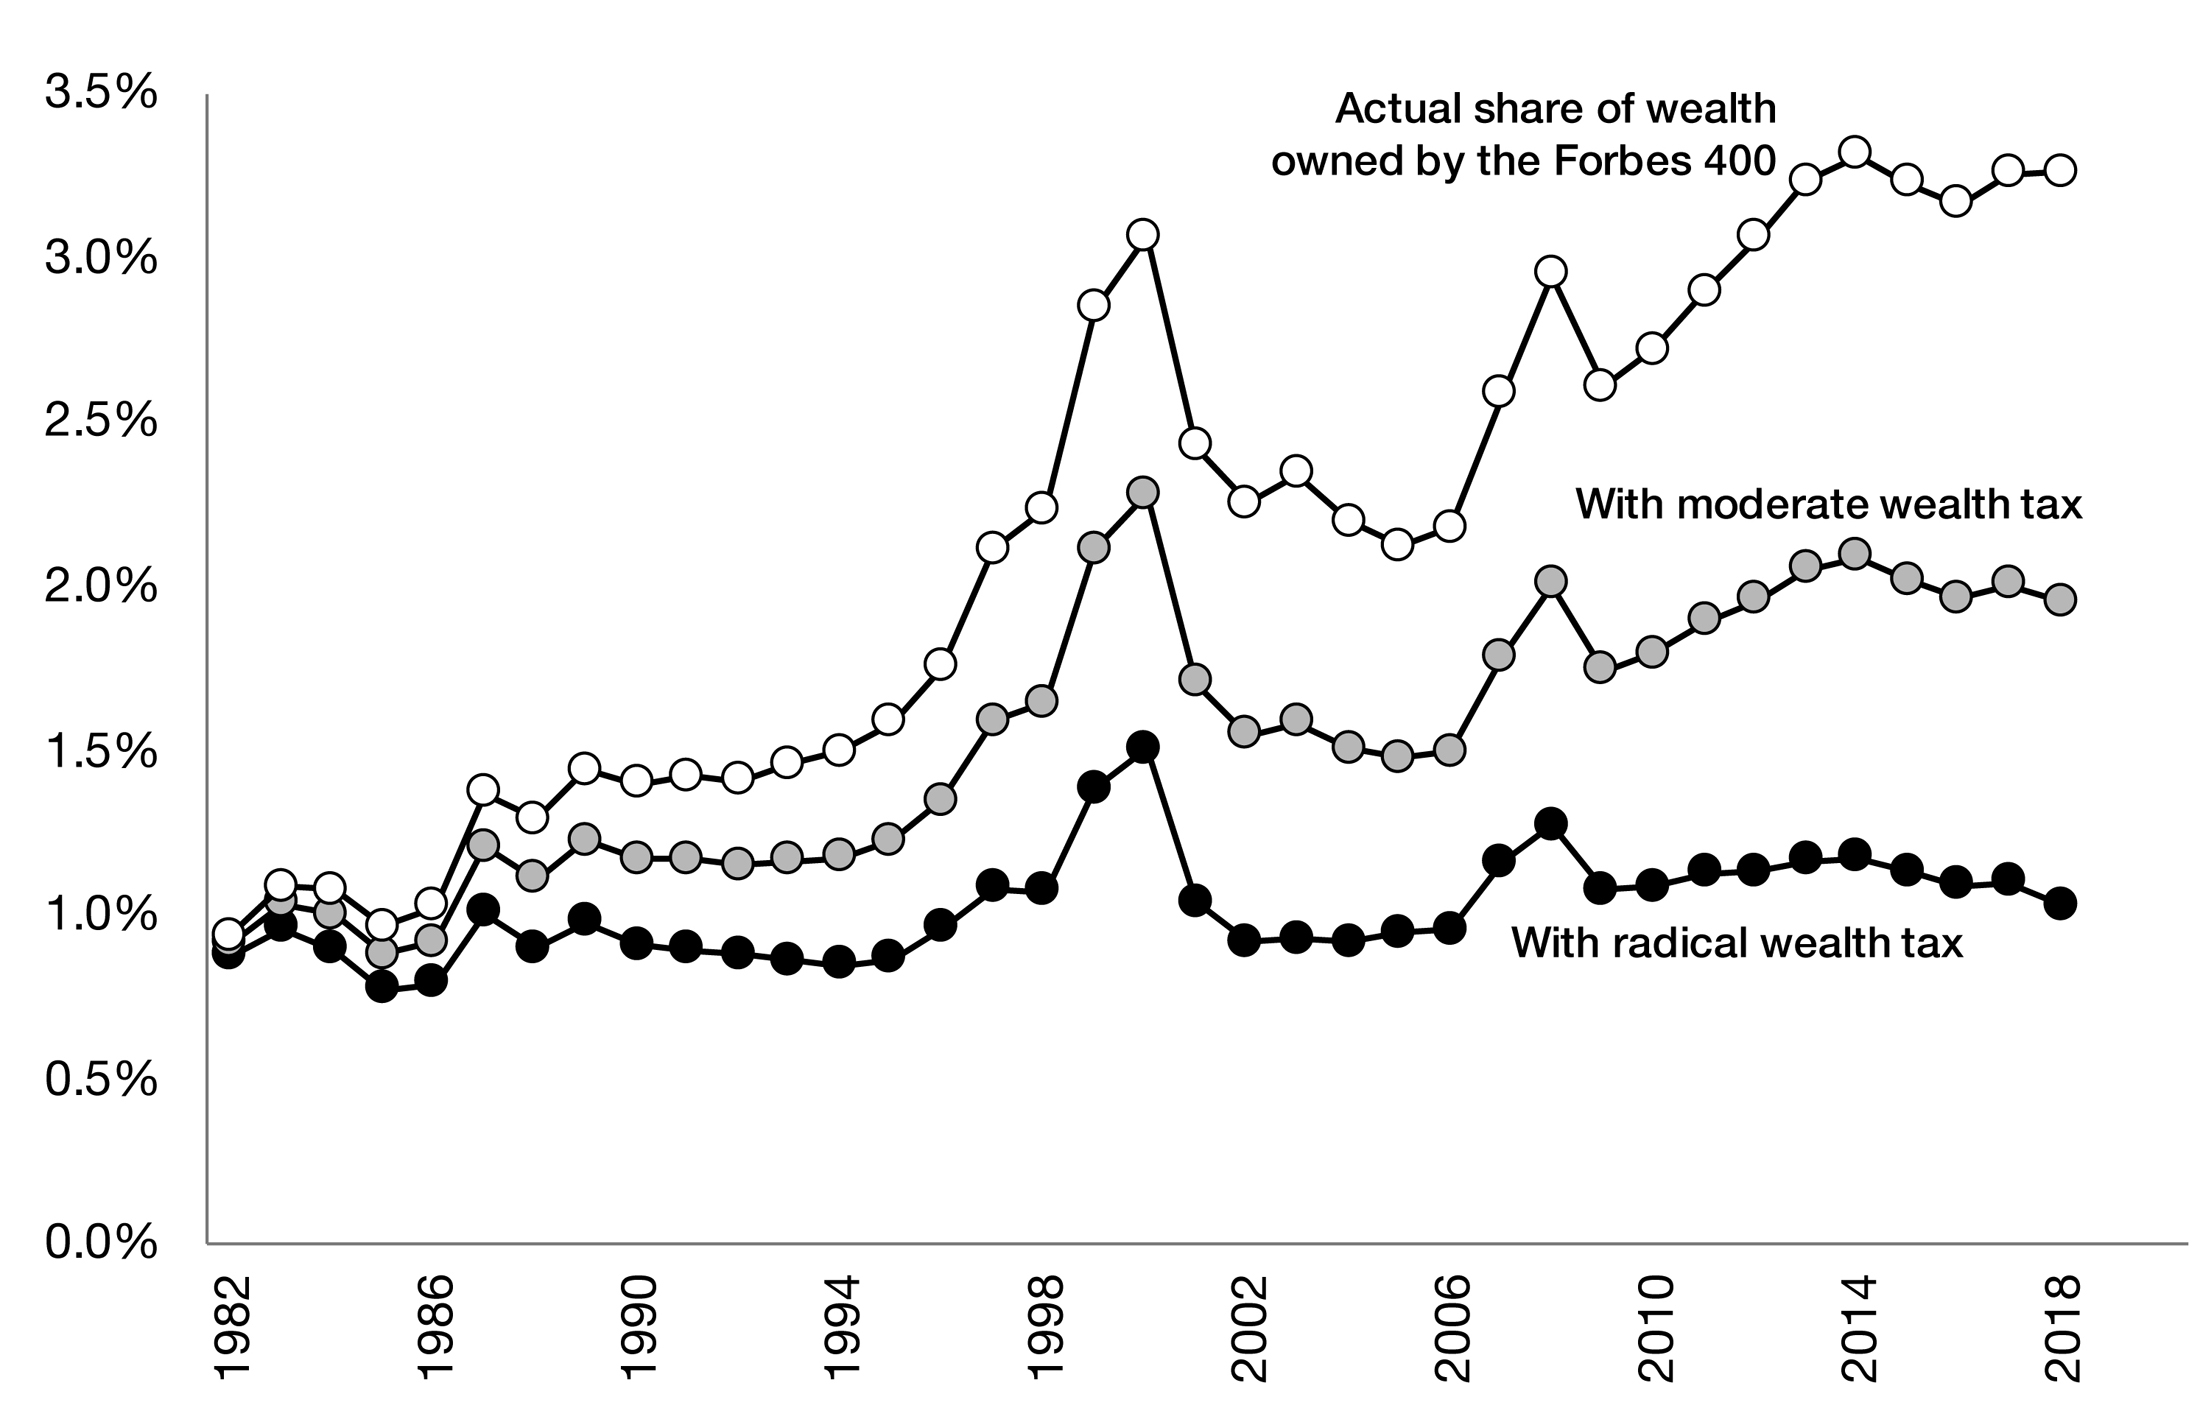
Notes: The figure depicts the share of total wealth owned by the top 400 richest Americans since 1982 from Forbes magazine. It also depicts what their wealth share would have been if a moderate or radical wealth tax had been in place since 1982. The moderate wealth tax has a 3% marginal tax rate above $1 billion while the radical wealth tax has a 10% marginal tax rate above $1 billion. The wealth share of the top 400 has increased from less than 1% in 1982 to almost 3.5% in 2018. With a moderate wealth tax in place since 1982, their wealth share would have been around 2% in 2018. With a radical wealth tax, it would have been about 1% in 2018, as in the early 1980s. Complete details at taxjusticenow.org.
A radical wealth tax would have raised $250 billion in revenue from the 400 richest Americans alone in 2018, more than 1% of GDP. But if such a tax had been in place since 1982, it would have only raised $66 billion from these 400 wealthiest families in 2018, while a moderate wealth tax, despite its much lower rate, would have yielded almost as much—about $50 billion. In the long run, a radical wealth tax erodes top fortunes so much that it reduces the taxes paid by the ultra-rich: it goes beyond Laffer.16
Is a radical wealth tax worth it? Would society benefit from curbing huge fortunes with a 10% annual wealth tax above $1 billion, even if it means lower tax collection at the top end? Over the years, our own thinking about this question has evolved as the stagnation of working-class income and the boom in extreme wealth became clearer in the data. Perhaps yours will too.