Chapter Three
The Fundamentals of Mannahatta
Along the seacoast the land is generally sandy or gravelly, not very high, but tolerably fertile, so that for the most part it is covered over with beautiful trees. The country is rolling in many places, with some high mountains, and very fine flats and maize lands, together with large meadows, salt and fresh, all making very fine hay land. It is overgrown with all kinds of trees, standing without order, as in other wildernesses, except that the maize lands, plains and meadows have few or no trees, and these with little pains might be made into good arable land.…
— Adrian van der Donck,
The Representation of New Netherland 1650
On Wall Street, insiders often speak of the “fundamentals” of the market. Interest rates, the liquidity of capital, inflation, productivity, and consumer confidence are the bedrock of the economy. If the fundamentals are right, so it is said, we need not worry about the day-to-day ups and downs of the stock market or the success or failure of any one firm, for “the market is sound.”
A similar argument holds for nature, although the fundamentals are of an altogether different kind. The fundamentals of nature are land and water, rock and wind, and their infinite combinations: hills and vales, ponds and brooks, ebb and flood tides, thunderstorms, snow showers and icy rivers, sunny days and gentle nights. They do not conveniently reduce to a balance sheet or a stock index, but they do integrate into a whole greater than its parts. Like economic fundamentals, if these basics of nature are functioning free from market manipulations, life will thrive.
Scientists, like most people, reveal their predispositions in the words they use. Ecologists call these fundamental characteristics of the landscape the abiota—literally “not-life,” an unmelodious term at best. Geologists for their part refer to all the green stuff that ecologists study, the plants and animals and even the soils, as the overburden—the things that get in the way of seeing what is really interesting, the rocks beneath. But to see Mannahatta as it was, we need to look past these biases, to see the landscape as a whole, from the hidden bedrock to the tallest trees tossed in the wind and washed in the rain. We need to take the long view, and invest, as nature has done, in the fundamentals.
Thus, before we could delineate the life of Manhattan Island, we had to rough out the not-life—to know the geology and the topography (plus its underwater equivalent, the bathymetry), to reconstruct the climate and remap watercourses and their watersheds, and from these in combination, to derive the soils, the wind exposure, the tides, and the places where fires, floods, and other catastrophes might occur and where they might not, all to the scale of a city block. In each of these endeavors, the British Headquarters Map, with its full-island view of the hills, streams, and shoreline, was our essential guide. To this we added other maps and accounts, from Dutch times to the modern era, and used a bit of computer wizardry too, to realize the fundamentals of Mannahatta.

This landscape painting by Victor Gifford Audubon shows the beach at Manhattanville, looking north along Washington Heights to Jeffrey’s Hook, where the George Washington Bridge now crosses the Hudson River. The fishermen are bringing in American shad and striped bass. The man seated on the rock is the artist’s father, John James Audubon, the famous wildlife painter, who lived on Washington Heights.

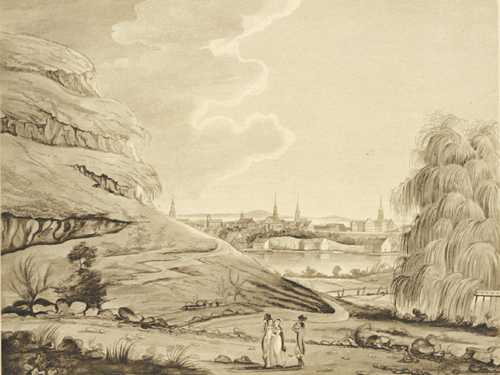
This strange landscape, painted from life by Thomas Howdell, shows Greenwich Village looking south toward the city proper, in 1768. Notice the exaggerated topography, a representation of the now long-removed Sand Hills. The palm tree is ecologically inaccurate and was probably added later by an engraver in England.
The Many Lives of Manhattan
Manhattan Island is the result of titanic forces played out in slow motion. Whereas Wall Street tracks the market minute by minute, we, in order to understand the monumental forces that have shaped the fundamental geology of Manhattan, have to recalibrate our sense of time, to slow down to “rock time.” What we experience as centuries amounts to just seconds on the cosmic clock of stone. Once we adjust our imaginations to rock time, then we can begin to understand the many lives of Manhattan. I won’t dwell in the distant geologic past, but let’s take a scamper through the millennia.
Ten thousand years ago, Manhattan was a hill beside a great fjord, the Hudson River canyon. Before that, Manhattan was a doormat to ice—at least twice in the last two hundred thousand years glaciers have bloodied Manhattan’s nose and scraped off her skin. Manhattan has also been part of the seabed, and lain for hundreds of millennia in the crust of the earth, deformed by extreme heat and pressure. Manhattan has also been part of a mountain range, probably many mountain ranges, which over millions of years eroded away into rubble. Manhattan has had pimply volcanoes, spent a dissolute youth in the tropics, known Europe and Africa on intimate terms, and crashed like a hot rod (geologically speaking) into North America. Earthquakes, floods, drownings, and rebirths: Manhattan has known them all. Some of the rocks on the island today are over a billion years old.
The result of this history is laid down in the rock on which Manhattan is built. Most of Manhattan Island is underlain with schist, a rock derived from sediments in the seabed, then metamorphosed by heat and pressure. Strong, sturdy, and reliable, inky schist supports the pilings of most of Manhattan’s skyscrapers. Closely related is Fordham gneiss, a slightly more twisted and consequently more lovely rock, noted for its curvy bands of lighter and darker minerals—originally sediments laid down over the seafloor. Gneiss is part of what makes Roosevelt Island so nice. Small areas of granitic pegmatite and granodiorite and the basic dikes found in northern Manhattan are all testament to volcanic activity, the result of molten rock cooled underground. Inwood marble is nearly pure white, and rarely seen above the surface because it is softer than other types and erodes so easily. Shaped from it are the humbler parts of the Manhattan landscape: the Harlem Plains, the lowlands around Sherman Creek, and the Lower East Side salt marshes—all formed where marble was the foundation.
Most of the city’s bedrock lives unseen in the city’s sub-basement, though outcrops were once exposed all over the island and can still be found scattered around town, especially in Central Park and other parklands. We can’t see the bulk of the rock, however, because of the untidy habits of ancient rivers and, in more recent times, glaciers. The same glaciers that scraped the subsurface clean and gouged out the marble left in their wake dregs of scrambled, unconsolidated rubble, flotsam and jetsam gathered from all over New England and upstate New York and discarded when the ice melted away. Rocks, sands, and silts deposited by the flowing ice are called glacial till; they fall out in a huge, disorganized mess. Outwash deposits are what came out of the meltwaters of the retreating glaciers; huge ice blue rivers laid down horizontal beds of better sorted sediments. The last of the glaciers melted away into a lake 150 miles long and once extending from the Battery to Albany—glacial Lake Hudson, before it finally burst and blew out the Verrazano Narrows. The result of all this deposition is that the bedrock is more than 100 feet below the surface under most of Lower Manhattan; in some places it is more than 250 feet below. The foundation had been laid for the “overburden” to follow.
How High Were the Hills?
The Lenape called it the “Island of Many Hills,” and the British Headquarters Map shows that, indeed, Manhattan was once a hilly place. But how high were those hills? The problem with the topography as drawn on the British Headquarters Map is that we have no idea how tall they were. Were they anthills or mountain ranges? The map was created before contour maps had been invented; instead, hills are depicted with shading, indicating vaguely their steepness and height. To turn the map’s shaded relief into a computerized “digital elevation model” suitable for computer techniques, we needed to know exactly how high the hills were. Computers do not tolerate imprecision.
This problem stumped us for some time. In fact, it threatened to derail the project—and then I had a couple of lucky breaks. The first came while taking a geology walk in Central Park with the amiable Sidney Horenstein of the American Museum of Natural History, during the summer of 2004. Horenstein is a longtime observer of Manhattan’s geology and other natural parts, and on this particular occasion, he was talking to a group of us on Umpire Rock, in southern Central Park, exhorting us to observe the glacial scratches on the outcrop, proof positive that where we stood had once been under ice. As I listened, I reasoned that if Umpire Rock had scratches made by glaciers fourteen thousand years ago, and if the same rock still had glacial scratches now, it must have had scratches in between, including in 1782, the year the British Headquarters Map was made. So, if I measured the elevation and position of this rock, I could compare it to the map and thereby begin the process of creating the digital elevation model.
This engraving shows the northern side of Bayard’s Mount, the highest elevation in Lower Manhattan, and a view of the Collect Pond and the city beyond, in 1798.

Eliza Greatorex drew this sketch of Arch Brook (also known as Saw Kill) on the eastern side of Manhattan in 1869, approximately where Seventy-fifth Street meets the FDR Highway today.
Thus began my career as a stander-on-rocks. Along with a number of students, I have spent many a fine afternoon standing on Manhattan’s large, glacially scratched outcrops, wherever we could find them, measuring their elevation with a barometric altimeter and their position with a GPS device. Central Park, Morningside Park, High Bridge Park, Marcus Garvey Park, and Inwood Park have all known us. Later we expanded our surveys to include eighteenth-century cemeteries, reasoning that, like the outcrops, ancient cemeteries have seen no drastic change in their elevations since first being constructed, and that they could thus provide us with useful elevation values for the southern part of town.
The second break came from Manhattan in Maps. A well-known source of early topographic information about the city is the set of Randel Farm Maps in the Manhattan Topographical Bureau. These maps were created by John Randel, Jr., a contentious and conscientious surveyor, whose work led to the adoption of the rectilinear streets that we know today as the New York street grid, a plan that would “provide space for a greater population than is collected on this side of China,” according to its makers. Randel began his work in 1808 for the state-appointed commissioners, Simeon De Witt, John Rutherford, and Governeur Morris, preparing a proper survey of the island that would allow the commissioners to plan the future expansion of the city. In 1811, they published their “comprehensive and permanent” Commissioner’s Plan, which defined the grid, and then contracted Randel to actually make it happen, placing markers to indicate where the streets would eventually go. Randel and his crews fanned out across the island of farms, woodlots, and small villages, relentlessly mapping avenues a hundred feet wide, interlaced with 155 streets sixty feet across. In places they found the woods “impassable without the aid of an ax”; they were chased by dogs, sometimes arrested, and once attacked by a furious woman throwing vegetables. As Randel described it, “I superintended the surveys with a view to ascertain the most eligible grounds for the intended streets and avenues, with reference to sites least obstructed by rocks, precipices, steep grades and other obstacles.”
The Collect Pond was the most important natural feature of Lower Manhattan. Probably a kettle pond formed when a retreating glacier left a large piece of ice in the soil, the Collect, or Fresh Water, was fed by underground springs, and supplied streams that drained into both the Hudson and East rivers.
Today this same area is the center of city government. Canal Street, which runs through Chinatown, was built over a canal dug to drain the Collect.

John Randel, Jr., produced a series of ninety-two “Farm Maps” showing property lines and owners in the early 1820s; natural features like streams, ponds, hills, and rocks; and the future street grid of Manhattan. Farm Map number 25 shows the area just north of today’s Times Square.
When they came to a rock outcrop that stood in the way of a future street, they placed a steel bolt to mark it for destruction; 98 outcrops were so marked. They also placed 1,549 marble markers at the northeast corners of street-and-avenue intersections, to indicate where the future streets should run over the hills and valleys. When they were finished, Randel drew the Farm Maps on 92 numbered folio sheets, showing simple outlines of the rocks, streams, and coastline, as well as the property lines in force at that time (the “farms”) and the future streets of Manhattan. He also noted the elevations at selected corners. One map, of Midtown, depicts a stream, a property marked as belonging to “J. Astor,” and the future path of Seventh Avenue. If assembled together, the Farm Maps create a single map eleven feet wide and fifty feet long.
One day when reading Manhattan in Maps, I noticed an aside about Randel’s field notes being found in the collections of the New-York Historical Society. I planned a trip to Seventy-seventh Street and Central Park West, and applied to enter the grand library under the glass atrium. With great enthusiasm, I received forty-two red leather-bound field notebooks, delicate with age, enclosing hundreds of pages of neat columns of numbers. The notebooks immediately presented difficulties. Randel had developed his own surveying methods using his own specially designed equipment; moreover, he had managed several teams of surveyors over a decadelong period (from 1811 to 1821), many of whom were somewhat less systematic than Randel himself in following the survey methods. (One notebook, for example, includes documentation of an assistant surveyor being fired on the spot.) Some notebooks presented long calculations to multiple decimal places; some surveys were obviously resurveys over the same streets. For a long time neither my colleagues nor I could figure out why Randel had also measured temperatures when measuring the angles. We later learned he measured temperature so he could adjust for small differences in the length of the survey equipment as it expanded in the sun. But the biggest problem was that all of the measurements were only relative—that is, they provided only the angle from one survey location to the next, but were not, as far as we could tell, clearly referenced back to a common datum, or starting point.
Delightfully, Tim Bean, a Columbia University student working with me on his senior thesis, unscrambled Randel’s trigonometry enough to translate the oddly transcribed angles into vertical measurements, and through the efforts of Bean and others over the course of years, we eventually transcribed the lot. The result was over five thousand elevation measurements that we were able to both locate on the street grid and relate to known elevations on the Farm Maps. Apparently the notebook collection at the New-York Historical Society is incomplete, because the resulting survey lines are incomplete; nevertheless, many of the observations are placed within fifty feet of the next, providing a previously unknown level of topographic detail about the early nineteenth-century landscape.
After years of work, we finally had all the information we needed to produce the digital elevation model of Mannahatta. We took the GPS/altimeter survey data we’d gathered from the city’s rocks and cemeteries, elevations from Randel’s Farm Map and the associated notebook data, additional surveys from northern Manhattan, and a collection of anecdotal observations from written accounts, and, using the GIS, laid them down across the georeferenced British Headquarters Map. We contoured the entire island, hill by hill, valley by valley, drawing lines at ten-foot intervals, adjudicating on the fly between the various data sources. We also drew on landscape ecology, noting that the heights of salt marshes indicate the limits of the tides, that marshes and other wetlands are generally flat, and that, of course, streams must run downhill.
Now we knew not only that Mannahatta was a hilly place—573 hills in total—but also how high the hills were. The maximum height on Manhattan is and was in Bennett Park, in Washington Heights, where Fort Washington had once been located, at 268 feet. In Lower Manhattan, where the Dutch first settled, the hills were low, hardly more than thirty feet tall, but high enough to exercise the burghers’ legs and to provide a venue for streams. Verlettenberg, the hill near the bronze bull at Bowling Green that had caught my attention on the British Headquarters Map, was, as it turned out, twenty feet high. It had once provided children with enough of a slope that merchants in the 1640s had to pass an ordinance against reckless sledding. City Hall Park sits atop a small rise, and behind City Hall, an amphitheater of hills cradled the Collect Pond: the Kalck Hoek to the west was named for the plentiful oyster shells that once decorated its slopes; Bayard’s Mount to the north was the highest hill in Lower Manhattan, at nearly 110 feet; and the gentle slopes that still rise to the east, led to Corlear’s Hook, a prominent nose of land jutting out into the East River. Extending from TriBeCa along the edge of Greenwich Village and up to today’s Astor Place was a string of hills known to the Dutch as the Zandtberge (the Sand Hills); the Sand Hills originally separated the rolling forests of the Village from the wetlands and stream courses of the southern end of the island. Farther north was Murray Hill, a large two-tiered structure, from which springs flowed north, south, east, and west. Dutch Hill was just north of Murray Hill, and a hill called the Dove sat north of that, in the East Fifties.
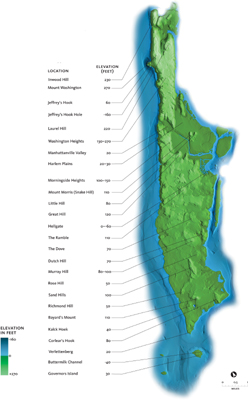
TOPOGRAPHY AND BATHYMETRY
This map illustrates the topography and bathymetry of Mannahatta, as represented by a digital elevation model, in the Geographic Information System. Assembling this map required five years of research to fix historical elevations to exact locations. Elevations of selected features are listed to the nearest 10 feet relative to mean sea level. See Appendix A for more details.

These two lithographed views by George Hayward show the evolving topography of Manhattan in the 1850s. This view in June 1858, looking south from the Arsenal Building at Sixty-third Street and Fifth Avenue, shows how the streets have been built up to a common grade.
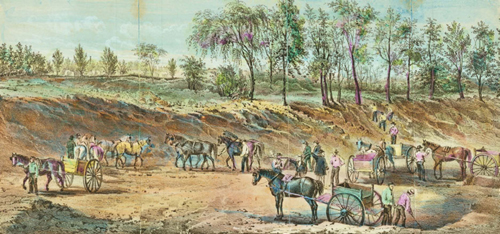
The equipment available for altering the landscape of Manhattan in the past was mainly pick, shovel, and mule, as shown in this scene from the construction of Central Park, circa 1859.
FILL AND EXCAVATION, 1609–2009
This map of fill and excavation on Manhattan was created by subtracting the historical topography, circa 1609, from the modern. Patterns of fill are shown in gray and excavation in red. Only elevation changes of more or less than 10 feet were detectable; some changes may also be due to slight misalignments between the two digital elevation models.

Central Park was built over a rocky, broken land, with numerous hills, some of which still exist today, including the Ramble, Vista Rock, and the Great Hill, in the northern part of the park. Standing at Central Park West and about 103rd Street, one can see where the Great Hill once extended into the Upper West Side and where the hill was reduced—as indicated by the remains of drill holes where the explosive charges had been placed. Interestingly, prior to the great competition for the design of Central Park in 1857, Egbert Viele, the city engineer, had put forward a plan that called for retaining much of the natural topography of the place. In defense of his plan, he wrote:
The hills, the valleys and the streams are nature’s penciling on the surface of the earth, rivaling, in their pictured grace, the most beautiful conceptions of the finite mind; to alter them, would be desecration; to erase them, folly! Upon a proper understanding of these features, and a proper appreciation of their beauty, depends the unity of the design.
Risking desecration and folly, the judges instead chose the plan of Viele’s subordinate, Frederick Law Olmsted, and Olmsted’s partner, Calvert Vaux, which prized an open, “natural” look along English pastoral lines over the craggy nature that actually existed on the site. This is not to say Central Park was entirely remade by the nineteenth-century landscapers; rather, what changes they made, they made with pick and shovel, mule and TNT. They could take a hill away or dam a stream, but they couldn’t lift up a hill and move it thirty yards to the right. The sizable hills found in Central Park today indicate areas sourced in the original topography. The opposite is also true: The areas featuring the least topography today, around the Great Lawn or the Reservoir, for example, indicate the places of greatest topographic reduction.
But the highest heights of Mannahatta were reserved for the northern part of the island, as reflected in the names: Morningside Heights, Washington Heights, Harlem Heights, Laurel Hill, and Inwood Hill. Small promontories, in the greater scheme of things, but New York, after all, is a coastal place, and coasts tend to be low-lying. The highest elevation on the entire Atlantic Coastal Plain, from Florida to Cape Cod, is on Staten Island (Todt Hill, at 409 feet). That Mannahatta can’t compare in height to the Rocky Mountains does not diminish its wonder, especially given that these are hills descending into the deep blue sea.
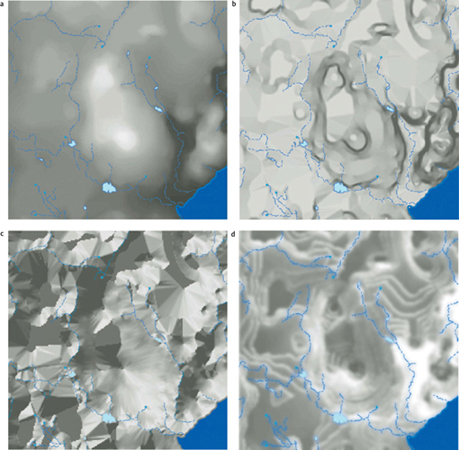
Digital elevation models, like the topography they represent, are fundamental to understanding the landscape. They can be analyzed to show (a) elevation, (b) slope, (c) aspect, or which direction the slope faces, and (d) wind exposure, in this case lighter areas are protected from northerly winter winds.
How Deep Were the Waters?
Rocks and hills are fundamental to a landscape, but they are nothing without water to enliven them. When it came to islands, the land that rises above the water, Mannahatta was far from the only island on the scene. Staten, Governors, Liberty, Ellis, Roosevelt, Ward, and Randall islands, and the western edge of Long Island form the archipelago on which New York City is built. (The Bronx is the only part of the city on the mainland, hence all the bridges, and all the traffic on the bridges during morning rush hour.) This archipelago is located in an estuary—that is, the place where freshwater meets saltwater; in this case, the massive freshwater Hudson River meets the tides of New York Harbor surrounding the island. The estuary has a three-dimensional seascape all its own, a set of hills and valleys and places where the currents prefer to run, an underwater landscape that defines the natural fundamentals beneath the surface.
Above water, the surface of the land is described by its topography, but below, that same surface is known as bathymetry and is measured in depths below average sea level. Fortunately, bathymetry is of intense interest to mariners, especially when its focus is the shallow waters that can catch a sailor unaware on the low tide; these shallow surfaces, where the water is thin enough for light to reach bottom, are also important ecologically. Sailors have left us charts of the bathymetry stretching back to the mid-eighteenth century, with intensive surveys beginning with the U.S. Coastal Surveys in the early nineteenth century. As with the British Headquarters Map and Randel’s observations, we used this historical information to chart the bathymetry in the computer.
The deepest portion of Manhattan’s waters is just off the highest part of the island, where a 145-foot hole exists in the Hudson River beneath the George Washington Bridge, just south of a point of land known as Jeffrey’s Hook (home to the Little Red Lighthouse). During the Revolution, American patriots tried to hold back British warships by placing wooden obstacles in the water near the Hook; unfortunately, the spot they chose was at the narrowest—and deepest—part of the Hudson off Manhattan. Their defensive chevaux-de-frise sank more than a hundred feet below the bottom of the ships.
Lower Manhattan is blessed with deep waters just offshore; that depth, and the protected location, made the mouth of the East River a perfect harbor. New York Harbor was once over forty feet deep in the channel between Manhattan and Governors Island, according to our historical calculations, and nearly twenty feet deep just off Pearl Street, the former island’s edge. Depths have changed subsequently because of landfill and dredging and altered currents caused by reconfiguration of the bounding land, conditions which are continually negotiated by the Hudson River’s cleansing current, the action of the tides and the Army Corps of Engineers.
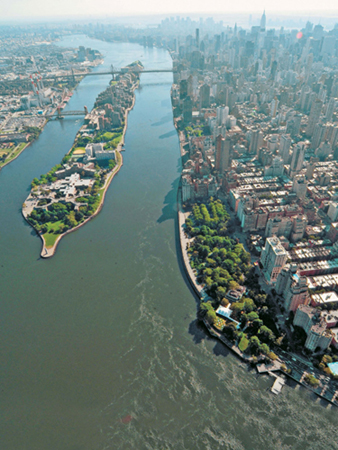
Also of interest to chart makers are the places where the water doesn’t plunge so deep: sandbars, small islands, and drowned rocks. Up the East River from the harbor was trouble, especially just north of Roosevelt Island, where the pinching lands, fast tides, and obstructing rocks made “Hellgate” very hazardous indeed. The rocks themselves accrued names over time: Bald-headed Billy, Hen and Chickens, the Pot and the Frying Pan, Bread and Cheese, and the Hog’s Back. Once, there was even a tidal mill sitting atop Mill Rock, just offshore of Ninety-sixth Street, which captured power from the churning water. (Other local tidal mills were found scattered through the wetlands of Red Hook in Brooklyn and Hackensack Meadows, nearby in New Jersey.)
The nineteenth-century technology that flattened the land of Manhattan also extended its good work into the sea. On October 10, 1885, the nine-acre Flood Rock met its maker in the largest human-caused explosion until the twentieth century’s nuclear blasts. Over three hundred thousand pounds of explosives were used, resulting in tremors felt nearly fifty miles away, in Princeton, New Jersey. The New York Times wrote the next day that the event was yet “another triumph of human skill over the resistance of nature.”
Complicating matters significantly is the fact that the rivers surrounding Manhattan are not exactly rivers as such; the East and Hudson rivers are more like extensions of the sea, rising and falling with the tides. By the same token, they are not exactly the sea either, surrounded as they are by the land that threatens to sunder them from the great oceanic expanse. Waters coming up the East River from the harbor meet waters coming through Long Island Sound, which have traveled separately three hundred miles around Long Island. Though arising from the same source, having traveled such distinct roads, they are out of sync by the time they meet again.
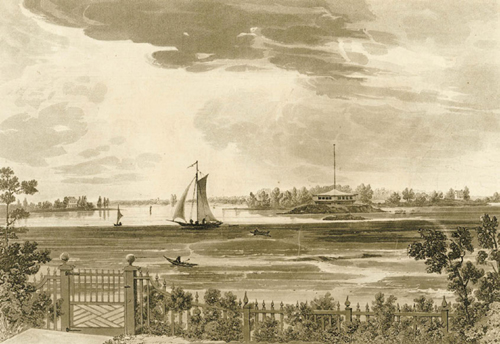
Hellgate, shown in this nineteenth-century view from a garden where Gracie Mansion is today, was famous for its fierce currents, submerged rocks, and tidal fall. Differences in tidal level once created temporary waterfalls and whirlpools in the East River.

This idyllic scene from an 1852 Currier & Ives lithograph shows the Harlem River with the Macombs Dam Bridge connecting Harlem to the Bronx. Note in the distance the High Bridge, part of the Croton Aqueduct, carrying freshwater onto Manhattan, and the wooded shores of both Manhattan (left) and the Bronx (right).
As a consequence, there are some very odd tides around Manhattan. The northern connection between the Harlem and Hudson rivers once experienced four tides per day (two high and two low)—one possible source of the name Spuyten Duyvil, Dutch for “Spitting Devil.” Some early colonist may have reasoned that only the devil would sponsor four tides a day. In the East River, on certain tides, a tidal fall used to form where high-tide waters met low-tide waters, creating a standing waterfall over six feet high; whirlpools created by violent tides have also been reported off Manhattan. Prominent tidal rips—pockets of standing waves created by fast-moving currents abruptly changing direction—are still commonly seen in the East River. These rips mix bottom sediment into the water column, creating cover for species to hide, a nutrient-rich stew for plankton, and habitats for fish in the sea.
On the Hudson River side, the tidal dynamics are themselves complicated and enriched by the seasonal influx of freshwater. The Hudson River’s watershed covers 13,000 square miles in New York, New Jersey, Connecticut, Massachusetts, and Vermont; some of its water has already flowed 460 miles before it reaches the Battery. In the spring the river discharges over 400,000 gallons of water per second to the sea, enough to create an ocean current of its own that extends along the Jersey Shore for 150 miles. Along the way, the freshwaters of the upland mix with the old, salty waters coming up the tidal river from the sea. The location of the “salt front” varies with the time of year, but it is generally north of Manhattan; Manhattan is always bathed in undrinkable brine. The majestic Hudson River transports not only water but also sediment into the estuary—between 400,000 and 1.4 million metric tons of it per year; in turn, the sea brings back between 139,000 and 734,000 metric tons of sediment into the harbor annually. By comparison, when the World Trade Center was constructed, engineers removed 1.5 million metric tons of sediment—approximately the same amount as the Hudson River carries in one year.
These sediments are mainly soil (in the form of mud) and sand. Sands are what previously formed and maintained the beaches on Manhattan’s western shore. The British Headquarters Map shows sandy beaches extending from the Battery to Thirty-fourth Street and then forming pockets up the Hudson River side. The East River side had barrier beaches, junior cousins to those on Long Island’s South Shore, which protected tidal wetlands on the Lower East Side and continued in pockets up to Harlem. Sandy beaches encircled 20 percent of Mannahatta’s fifty-six-mile perimeter; the rest was broken into tide pools, teeming with life, and rocky strands.
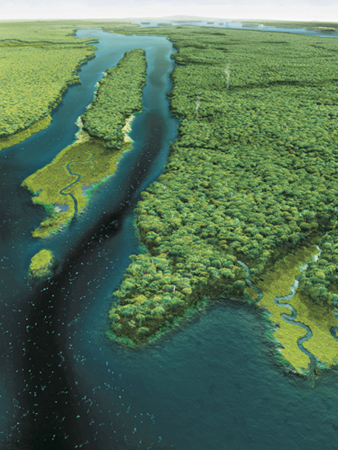
The geomorphology of the eastern shore of Mannahatta was shaped by a combination of geological forces, the actions of the glaciers, and rising sea level. Historically these factors contributed to turbulent waters.
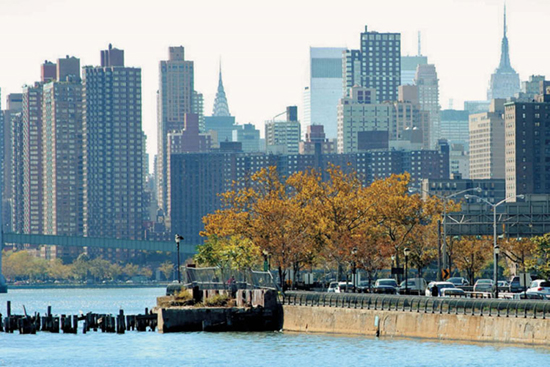
The Upper East Side landscape is shaped today by townhouses and business. The mayor’s official residence sits in a park above the FDR Drive on the East River.
Rich in Dirt
Soil is dramatically underappreciated in our civilization—to our detriment. Witness the connotations of words like dirt, muck, and mire; yet, without soil, an agricultural economy would be impossible, and without an agricultural economy, cities like New York would be impossible. Wendell Berry, the farmer-essayist, describes soil as “miraculous”; he writes: “A healthy soil is made by the life dying into it and by the life living within it, and to its double ability to drain and retain water we are complexly indebted, for it not only gives us good crops but erosion control as well as both flood control and a constant water supply.” Think of that—a natural material that both absorbs the water it is not wanted and releases it when it is. No wonder the New York poet, Walt Whitman, wrote, a century before, that soil “gives such divine materials to men.”
Mannahatta, as seems fitting given its diversity and abundance, was rich in dirt. The New York City Soil Reconnaissance Survey has identified eighty-seven different kinds of soil within the modern city, at a mapping scale of 1:62,500. Many of these modern urban soils have been modified by human activity, as is conveyed by their names: “Laguardia-Ebbets-Pavement & buildings, wet substratum complex”; “Bigapple-Fortress complex”; “Freshkills, geotextile liner substratum-Kleinekill sandy loams, 3 to 25 percent slopes.” Soil descriptions of the modern city commonly include references to “coarse, anthropogenic materials”—that is to say, garbage.
Soils of the past, however, were made of different things. Soils are formed at the transition between ecology and geology, the boundary between ecosystems and earth. They are part rock, part decomposed leaves and roots, and part air spaces alive with millions of soil organisms—from bacteria and fungi to insects, worms, and moles—eating through the leavings of the lucky creatures in the sun, transforming our refuse into the foundation of plant and animal life. Soil scientists like to call soils “the living skin of the Earth.” Plants like them so much that most bury over half their bodies in them (i.e., their roots), and in doing so, many have formed powerful cooperatives, called symbioses, with the fungi in the soil.
Hans Jenny, the famous American soil scientist, said that any soil could be completely described through reference to just five “soil-forming” factors: time, climate, topography, vegetation, and parent material (the rock beneath). We used these same principles to map Mannahatta’s soils. Time over the breadth of the island is constant—approximately eighteen thousand years since the last glaciation. Climate, though changing through that time, has not changed from one part of the island to another, so it too can be considered a constant spatial factor. Topography we have from the digital elevation model. Vegetation we interpreted from ecosystems on the British Headquarters Map and historical accounts. Parent material, the name soil scientists give to the rocks from which the soil arises, we have from the surficial geology maps of what the glaciers, rivers, and oceans have left behind.
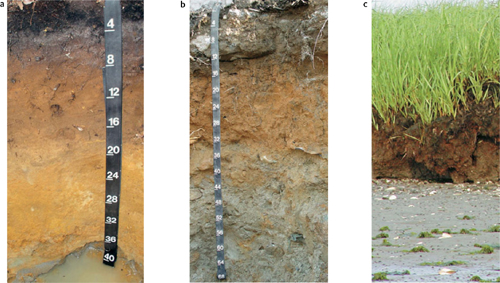
Soil profiles show how soils vary with depth, depending on vegetation type, topography, climate, geological source, and time. These three soils were typical of Mannahatta’s soils. The names are based on Natural Resources Conservation Service (NRCS) standard classifications: (a) Deerfield, (b) Charlton-Sutton, and (c) Pawcatuck.

This 1864 bird’s-eye view of the newly created park in the center of Manhattan shows the transforming fundamentals of the landscape: new lakes and reservoirs, rerouted and buried streams, and altered hills and valleys. At the time, Central Park appeared more developed than the surrounding landscapes on the East and West sides, with their scattered buildings and emerging road networks, the latter serving carriages and horse-drawn streetcars.
Combining these factors, we estimated that Mannahatta once had seventeen different soil types. We mapped those soil types according to standard classifications provided by the Natural Resources Conservation Service (NRCS), so we could take advantage of their extensive soil-properties database. Soils are described by their texture (referring to the particle size), organic material, acidity, moisture, fertility, and depth. They are composed of clays, silts, and sands, and intermixed with rocks sized as pebbles, cobbles, and boulders. Soils are essential to the habitats of plants and a variety of animals and we all depend on them, at least indirectly.
As it turns out, Mannahatta’s soils were not particularly deep, having had only eighteen thousand years to form—it takes about forty years to form one centimeter of soil in our climate. Erosion, the churn of animals through the soil surface, the action of the glaciers, and the occasional fire seemed to have limited the soil depth as well. Many of the original Dutch farmers were disappointed with what they found on Manhattan; one wrote that the island was somewhat less fertile than other spots and gave more trouble on account of “the multitude of roots of shrubs and trees.” Another felt that “most of the land was in need of manure; it was partly worn out by weeds.” Their fundamental trouble, though, seemed to be having an inadequate number of horses and pigs from the old country to turn the leaves of the wild-growing plants into the manure requisite for European crops at the rate they desired. For their part, the multitudinous native forests seemed quite content.
The Brooks Above and Below
One thing the Dutch burghers were pleased with was the water. Mannahatta was copiously well-watered, with over twenty ponds, sixty-six miles of streams, and, it has been estimated, three hundred springs (we were able to locate only eighty-nine of these). These freshwater sources were essential to the colonization of the island; after all, Manhattan is an island in a saltwater estuary, and most forms of life require freshwater. Mannahatta was blessed with so many ponds, streams, and springs because of a fortunate confluence of factors: a generously aquatic climate, an extensive green mantle that clothed it and slowed the floods, and a glacial history that left thick beds of sand and silt in its subsurface—a reservoir to hold the rain in aquifers for another day.
ORIGINAL SOILS
Soils are crucial to all plants and all organisms that depend on plants. Mannahatta’s soils reflect the geological history of the island. This reconstructed soil map is based on analysis of geology, topography, and vegetation type and shows seventeen different soil series or types on Mannahatta in 1609. The names match soils mapped by the National Resource Conservation Service (except for rock outcrops and beach) and link to modern databases of soil properties.

Streams are the conduits for water flowing aboveground; springs form where the underground water flow breaks the surface. Both are fed by rainwater and snowmelt. The rain falls, running down the leaves, stems, and trunks of trees and plants (known respectively as leaf flow, stem flow, and trunk flow; trees can hold up to nearly a quarter inch of rainfall, which is why they are a convenient place to hide when it begins to rain, but not later). As the rain penetrates the soil, the soil pores fill with water, holding a certain amount and letting more escape into the rocky subsurface; when the pores fill, the water runs off overland, following gravity into the lower places. These lower places connect according to the topography—small streams joining small streams to join larger ones, which eventually take the flow en masse through alternating patterns of pools, riffles, and runs, sometimes ponds and lakes, and finally to the sea. As we have seen with the Hudson River, the combined effect of thousands of small streams can be a deluge of water carrying large amounts of sediment; those metric tons of sediment begin as millions of individual small erosion events (the soil’s gift to the rain) in the headwaters of the smallest streams. Streams marked on the British Headquarters Map or described in other historical accounts generally flowed year-round, supplied between storms with the aqueous reservoirs held underground. Other streams ran only ephemerally, after a rainstorm, for example, in some cases leaving small pools and ponds in the forest that dried over the summer. These so-called vernal pools were (and still are) habitats for frogs and salamanders, which enjoy a fish-free wet respite.
Mannahatta’s streams have left their mark on the organization of the city streets, especially in Lower Manhattan. Broad Street, as is often written about, owes its breadth to the Dutch canal that once occupied the space, but before that, in its place was a small stream that wound through low marshy ground, fed by another branch that flowed along the line of Beaver Street (named for the beavers who called it home). Maiden Lane follows the former path of a small spring-fed stream that drained between two hills to the East River. Canal Street reminds us of the canal dug along the line of the outlet stream to drain the Collect Pond and salt meadows that ran to the Hudson River shore. A bridge over the stream at Broadway and Canal Street was the original “Kissing Bridge” of Manhattan. Minetta Street in Greenwich Village was first a winding path alongside a stream called Minetta Water; Minetta Lane was named for the footbridge that crossed the stream.
Uptown streams drained through Times Square, along Sixth Avenue, and around either side of Murray Hill. In the high grounds of Bloomingdale (on the Upper West Side) and Central Park, numerous streams made a start on their mainly southeastward journey, reflecting the trend of the glacier that crossed the island in the same direction. The largest watershed belonged to the Saw Kill, which began within four blocks of the Hudson River, on the West Side, but eventually gave its water to the sea at East Seventy-fourth Street. The largest stream by volume was the partially fresh, partially tidal Harlem Creek. It too started nearly on the West Side, in the rough-and-tumble topography of the Narrow Way (also formerly known as Manhattanville, now known as West Harlem or the 125th Street canyon, where the No. 1 train emerges from the rocks of Morningside Heights, crosses a bridge, then enters a tunnel into Washington Heights). Once emerging from the hills, Harlem Creek shot straight as an arrow across the plain (just as 125th Street trundles across Harlem) to a deep tidal inlet near today’s Harlem Meer, in Central Park. Numerous small streams drained off either side of Morningside and Washington Heights, in short, steep runs—some marked by waterfalls—before reaching home in the Hudson and Harlem rivers. Farther north in the Inwood section, Sherman Creek and its attendant marshes captured the water flowing down Inwood Hill, Laurel Hill, and Mount Washington before delivering it to the Harlem River and sinuous Spuyten Duyvil Creek, both themselves extensions to the sea beyond.
Natural reservoirs of water aboveground, lakes and ponds are the places where water collects to a regular depth. Although Manhattan did not have lakes as such, it did have several ponds, most important of which was the Collect Pond, in Lower Manhattan. The Collect Pond—also known as the Collect Water, the Fresh Water, or the Kalck—was the main freshwater source for New York City for its first two hundred years, from the first Dutch days until after the American Revolution; prior to that, a Lenape site existed on the pond’s southwestern edge. The Collect seems to have been a kettle pond, formed when a large block of ice broke off and was abandoned by the retreating glacier; the block of ice creates a space in the subsequent glacial outwash before eventually melting away, leaving a large gap in the sediment perfect to form a pond. Seventy feet deep and fed by underground springs sufficiently abundant to keep the water “fresh,” even though the pond surface was only about ten feet above sea level, the Collect Pond’s embellishments included rumors of a Loch Ness–type sea monster that reputedly seized a Hessian soldier during the Revolution. Fishing was such a passion for early New Yorkers that in 1734 the City Council was forced to enact fishing regulations; from then on, only rods and reels, and not nets, were allowed when fishing in the Collect. Other ponds on the island included the Little Collect, beside the big Collect; Sun-fish Pond and Rose Hill Duck-Pond, south and north of Murray Hill, respectively; and the Stuyvesant Skating Pond, in the East Village.
The waters that flowed into these ponds often came from springs. The greatest commentator on the “active” and “bubbling, wholesome springs on Manhattan Island” was James Reuel Smith, who, after a successful career as a merchant on Front Street, found a second career peddling his bicycle around Manhattan Island and the newly formed borough of the Bronx to measure, photograph, and document the condition of springs and wells as he found them between 1898 and 1901. Apparently he took to his chosen task with relish, as revealed in the following passage from the introduction to his book on the subject:
Greatly satisfying indeed is the draught from a spring where none is said to exist, and which has been come upon after patiently and inductively following a trail marked only by a moistened stone here, a willow farther on, and then a piece of watercress. … Springs are attractive not only to the thirsty traveler, but also to the artist, the photographer, and the lover of pretty nooks and rustic scenery. In general the Spring seems to delight in picturesque surroundings, and its moisture freshens and encourages neighboring vegetation, and offers attractions that allure the denizens of the pasture whose presence redeems the solitude from loneliness without disturbing the restful stillness that soothes the admiring wayfarer. A city spring frequently possesses all the beautiful surroundings of a rural one, and besides exciting that pathetic interest aroused by something pleasurable which will shortly cease to exist, it is, for the meditative, a link which connects the thoughts with the past.
STREAMS, PONDS, AND SPRINGS
Mannahatta’s waterways consisted of sixty-six miles of streams, over three hundred springs, and twenty-one ponds and salt pannes, of which a selection are shown here. See Appendix A for more details.

Though now less common than in Smith’s day, springs can still be found in parklands around the city. Tanner’s Spring, for example, still bubbles in Central Park near West Eighty-second Street, and Cold Spring provides a bathing pool to birds in Inwood Hill Park. Others no doubt surge under buildings and among the subway tunnels—though it can be difficult to differentiate a spring fed by the rain from a spring fed by a leaky water main.
The Changing Climate
Land and water are two of the great currencies on earth; the third great currency is the air. The interaction of these currencies is what creates the climate, and climate is what connects them (and, as we have recently learned, us) in a virtuous circle. The weather describes the daily goings-on of the atmosphere as reported every night on the evening news: the high and low temperature of a day, whether it snowed or rained and how much, whither the wind blew and how lustily. The climate describes the pattern behind the day-to-day transactions of the weather: the long-term trends in the weather of a given place, when the temperature will rise and fall that give meaning to the seasons and set the basic parameters for life.
Consider this: How much it snows or rains determines what is available for plants and animals to drink and if springs and streams flood or evaporate. Whether the temperature was above or below the freezing point determines whether the water in all things will be liquid or solid. Liquid water flows into cracks and down slopes; solid water (ice) expands with a force that can crush rock or the cells of frozen organisms. The strength and direction of the winds determines which birds will come, which trees will stand, the number of clouds, and the height of the waves crashing on the beach. If land is the stage and water the enlivening force, then climate is what describes what play is on and who can act.
The air is always in motion, driven by the planet’s rotation on its axis and the amount of sunlight (and therefore heat) that different parts of the planet receive depending on latitude and season. Variability in movements of the air is what creates the weather. In New York the day-to-day weather is highly changeable, depending on the interactions of air masses arriving mainly from the west, the north, and the south. The jet stream drives westerly air across the country, so that the same storm can bring rain to Sacramento, Kansas City, and then New York. Arctic air masses cooled at the North Pole descend when the jet stream shifts south, opening the door for Canadian cooling and lower humidity; by the same token, when the jet stream shifts north, warm, humid air from the southeast comes north, bringing tropical days and sultry nights.
Over winter, when Arctic pressure dominates and the sun declines toward the southern horizon, the frozen land drives the cycle of migration or adaptation. Living things that can, leave; those that can’t, adapt; and those organisms for which neither path is an option, freeze and die—including the organisms that cause disease to others. A harsh cold snap, like a long winter’s sleep, restores the health of the land.
Disturbances in the weather, also known as storms, can arrive on any of these tracks; when two disturbances arrive simultaneously, Manhattan receives what is prosaically called “a major weather event.” These take many forms. Thunderstorms commonly crash over the summer, when charged air from the South meets a cool disturbance from the North. Famous nor’easters actually originate in southern climes, with low-pressure systems formed off the coasts of the Carolinas that are whipped up by Arctic winds and energy to lash the mid-Atlantic and New England states. Once in motion these storms track up the Atlantic seaboard, delivering heavy snows and ice, typically in winter and early spring, but sometimes in fall. Caribbean hurricanes can also reach New York and are important to the long-term disturbance dynamics of forests in the region. Hurricanes begin as tropical storms off the west coast of Africa and track across the Atlantic Ocean north of the equator before tilting north. Some track through the Caribbean toward Central America, some through the Gulf of Mexico to Texas and the Gulf States, and some track to the North. Generally by the time these storms reach New York they have lost some of their youthful power and arrive merely as tropical storms—with winds of thirty-nine to seventy-three miles per hour and sustained rains. Fortunately, recessed as Manhattan is in its harbor, and protected by western Long Island on one side and coastal New Jersey on the other, the probability of the island taking a direct hit is relatively remote, though not zero.
Given the variability of the weather in New York from one day to the next, the consistency of the climate from month to month is remarkable. Though it is hard to predict which days will see rain, on average from 1859 to the present, New York has received about four inches of precipitation per month, slightly more in summer and winter, and slightly less in spring and fall. Such equanimity of moisture is a godsend to plants and the animals that depend on them, and to the fish that need regularly flowing streams to live in. Like an investment that yields a consistent return month after month, New York’s climate has long paid dividends to the local environment.
Manhattan is still an island, shaped by the land and the sea, as much as its edges have been hardened with concrete and asphalt. Climate change ensures that further changes to the Manhattan landscape are still to come.

This photograph from the hurricane of 1938 shows the storm surge at Battery Park, on the southern tip of Manhattan.
Which leads one to wonder what happens when the fundamentals shift. The climate, as we know, has changed on a worldwide basis as a result of human activity; in New York alone, the twentieth century saw a 2°F increase in average temperature. New York is a city built on a series of ocean-wrapped islands, and the sea is coming closer, rising around us by an average of 0.1 inches per decade over the last century. Predictions vary, but all models indicate a continuing rise in temperature over the next century; the only question is how much. The current range is estimated at +2.2°F to +10.2°F by the 2080s in the New York City region, with precipitation changes between -15 percent and +30 percent. With that will come rising sea levels and increased threats from higher storm surges—the sea may yet be coming to our doorstep, reconfiguring once again the shape of the island. The fundamentals of rock and sediment, tide and water, soil and wind are not done with Manhattan yet.
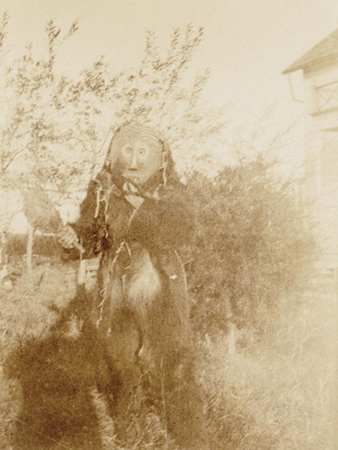
This photograph from Kansas, circa 1900, shows a Lenape dancer dressed as the Mesingholikan, an incarnation of the spirit who negotiated between people and the spirits of animals they killed.