3
Batteries
“The storage battery is, in my opinion, a catchpenny, a sensation, a mechanism for swindling the public by stock companies. The storage battery is one of those peculiar things which appeals to the imagination, and no more perfect thing could be desired by stock swindlers than that very self‐same thing…. Just as soon as a man gets working on the secondary battery it brings out his latent capacity for lying…. Scientifically, storage is all right, but, commercially, as absolute a failure as one can imagine,” Thomas Edison, 1883.
“Don’t you know that anyone who has ever done anything significant in physics has already done it by the time he was your age?” Remark by professor to World War II veteran John Goodenough, aged 24 in 1946. John was to invent the first Li‐ion battery at the age of 57 in 1980 [1].
“Cost, safety, energy density, rates of charge and discharge, and cycle life are critical for battery‐driven cars to be more widely adopted. We believe that our discovery solves many of the problems that are inherent in today’s batteries.” John Goodenough speaking in 2017 on his latest breakthrough – a solid‐state battery [2].
In this chapter, the reader is introduced to the electrochemical batteries used for the electric powertrain. Initially, the chapter provides a battery overview and concentrates on the widely used automotive batteries of lead‐acid, nickel‐metal hydride, and lithium‐ion. The basic definitions and material considerations are presented. The critical issue of battery lifetime and related factors are then discussed. Introductory electrochemistry is presented.
3.1 Introduction to Batteries
3.1.1 Batteries Types and Battery Packs
An electric battery stores and converts electrochemical energy to electrical energy. The battery symbol is shown in Figure 3.1(a).
Figure 3.1 (a) Battery symbol; batteries in (b) series, (c) parallel, and (d) series‐parallel.
The batteries used for automotive powertrain applications are secondary batteries. A secondary battery is a battery that can be repeatedly charged and discharged. Examples of secondary batteries are lead‐acid (with symbol PbA), nickel‐metal hydride (NiMH), and lithium‐ion (Li‐ion).
Smartphones typically use a lithium‐ion polymer (LiPo) battery. The LiPo battery operates similarly to a standard Li‐ion battery. The LiPo battery has a gel‐like electrolyte which makes the cell more malleable and easier to shape. The standard Li‐ion cell electrolytes are liquid with a polypropylene separator.
The other principal type of battery is a primary battery. The primary battery cannot be recharged after discharge. Examples of primary batteries are the alkaline‐manganese batteries we commonly use in our TV remote controls and other common appliances.
A battery cell is the basic battery unit. A battery pack comprises multiple cells. Multiple cells may be required to increase the energy storage, the pack voltage, or the battery pack power. Many electrical devices require higher voltages than the basic cell voltage for operation. For example, the speed of a dc electric motor, powered directly by a battery, is approximately proportional to the battery voltage. Many electronic devices require battery voltages in excess of certain minimum values for the electronics to work. For example, modern electronic phones have a processor optimized for operation at 1.5 V, which is easily powered by a Li‐ion cell using a power converter to step down the voltage.
The battery cells can be arranged in series or in parallel. Cells are arranged in series, as shown in Figure 3.1(b), in order to generate a higher voltage, and higher power, as the battery pack voltage is simply the sum of the individual cell voltages. A typical TV remote control has two 1.5 V alkaline batteries in series for an overall voltage of 3 V. A commonly encountered problem for consumers is when the two 1.5 V alkaline primary cells are replaced with two rechargeable NiMH cells. The cell voltage of NiMH is only 1.2 V, and the reduced cell voltage from 1.5 V to 1.2 V can cause operating problems for devices if the device is designed for operation using a cell voltage of 1.5 V. The 12 V lead‐acid battery on a standard vehicle comprises six 2 V lead‐acid cells in series.
Cells can also be arranged in parallel, as shown in Figure 3.1(c), in order to generate a higher output current and power. The stored energy, lifetime, and voltage of a battery are dependent on the current or power pulled from the battery. Adding more cells in parallel increases the energy, lifetime, and voltage for a given power.
Automotive EV batteries are typically arranged in series‐parallel, as shown in Figure 3.1(d), in order to obtain higher voltage, current, power, energy, and lifetime. The 2012 Tesla Model S with an 85 kWh battery pack has 16 modules in series. Each module has six strings of submodules in series with each sub‐module having 74 cells in parallel. Thus, the battery pack has a total number of 7104 cells, effectively a matrix of cells with 96 in series and 74 in parallel. Many of the automotive battery packs have 96 Li‐ion cells in series, and the battery pack voltage is close to 400 V as the no‐load voltage on each Li‐ion cell is just over 4 V. The voltage level of 400 V is a common level for many power converters, and many related technologies have been developed to efficiently and safely convert power at this voltage level.
3.1.1.1 Recent EVs and Battery Chemistries
There are many different types of battery chemistries. Batteries can also be optimized for a particular application as the usage can dictate the material selection. A battery electric vehicle (BEV) battery is optimized for a wide operating range, while a hybrid electric vehicle (HEV) battery is optimized for a narrow operating range in order to maximize the number of discharge cycles.
The General Motors (GM) EV1 electric car came to market in 1996 with a lead‐acid battery pack. The lead in the lead‐acid battery makes it a very heavy battery, thus limiting the on‐vehicle energy storage. The chemistry has a relatively short lifetime, further reducing the energy storage as the capacity degrades. While lead‐acid was the only available chemistry at that time for the vehicle, NiMH technology was developing rapidly, and the second‐generation GM EV1, launched in 1999, featured a NiMH battery pack. NiMH has a greater energy capacity and longer lifetime than PbA. NiMH was the chemistry of choice for Toyota for the 1997 Toyota Prius.
In the meantime, Li‐ion was being developed as the chemistry of choice for cellular phones and laptops due to its large capacity and lifetime. Li‐ion chemistry has been the basis for the EV renaissance which began with the launch of the Tesla Roadster in 2008. Lithium is the lightest metal, and the Li‐ion battery has many advantages over the other technologies, such as a higher energy density, a higher cell voltage, and a longer life.
There are a number of variations of Li‐ion chemistry that have been developed by various manufacturers. Earlier Li‐ion chemistries featured cobalt and manganese as the main metals. The mix and choice of materials can significantly influence the energy density, lifetime, safety, and cost. The cathode, to be defined in the next section, is a mix of lithium, various metals, and oxygen, and is termed lithium metal oxide. It is common to use the chemical formula to describe a battery. For example, LiCoO2 is the chemical formula for lithium cobalt oxide.
The Panasonic battery used in the Tesla Model S has a high nickel content. In a typical nickel‐cobalt‐aluminum (NCA) battery, nickel can make up 85% of the cathode with aluminum and cobalt making up 10% and 5%, respectively. The high nickel content results in a battery with a very high energy density and a long life.
The LG Chem battery used in the 2011 Chevy Volt features an NMC cathode. NMC stands for nickel, manganese, and cobalt with the formula LiNiMnCoO2. The metals are mixed at approximately 1/3 each. Although the NMC chemistry has a lower energy density than NCA, NMC has a lower cost and a longer life. The energy density improved from 87 Wh/kg in the 2011 Chevy Volt to 101 Wh/kg in the 2016 Chevy Volt.
The AESC batteries in the 2011 Nissan Leaf feature a blend of manganese and nickel. In chemical terms, the cathode is a mix of LiMn2O4 and LiNiO2.
It is useful to review the published parameters on selected vehicles from the 1996 GM EV1 on, and the developments in battery technology will become apparent. The key parameters are presented in Table 3.1. The 1996 GM EV1 had a vehicle weight of 1400 kg, of which over 500 kg was the battery pack. The rated energy and power of the battery pack were about 17 kWh and 100 kW, respectively. The specific energy, defined as energy per kilogram (Wh/kg), was relatively low at 34 Wh/kg, while the specific power, defined as watts per kilogram (W/kg), was 200 W/kg. A common metric to compare batteries is to calculate the power to energy ratio, P/E, by dividing the specific power by the specific energy. The P/E ratio tends to be low for EVs and higher for HEVs. This consideration of optimizing batteries for EV versus HEV operation can affect the ultimate battery chemistry as a particular battery can be optimized for energy or power. The 1996 GM EV1 lead‐acid battery had a P/E of 6, a relatively high number for an EV pack compared to the next generation of EVs.
Table 3.1 Representative battery cell and pack parameters for various vehicles.
| Vehicle | Vehicle weight (kg) |
Battery weight (kg) |
Battery manufacturer |
Chemistry | Rated energy (kWh) |
Specific energy (Wh/kg) |
Cell/pack nominal Voltage (V) |
Rated power (kW) |
Specific Power (W/kg) |
P/E |
| 1996 GM EV1 | 1400 | 500 | Delphi | PbA | 17 | 34 | 2/312 | 100 | 200 | 6 |
| 1999 GM EV1 | 1290 | 480 | Ovonics | NiMH | 29 | 60 | 1.2/343 | 100 | 208 | 3 |
| 1997 Toyota Prius | 1240 | 53 | Panasonic | NiMH | 1.8 | 34 | 1.2/274 | 20 | 377 | 11 |
| 2008 Tesla Roadster | 1300 | 450 | Panasonic | Li‐ion | 53 | 118 | 185 | 411 | 3 | |
| 2011 Nissan Leaf | 1520 | 294 | AESC | Li‐ion | 24 | 82 | 3.75/360 | 80 | 272 | 3 |
| 2011 ChevyVolt | 1720 | 196 | LG Chem | Li‐ion | 17 | 87 | 3.75/360 | 110 | 560 | 6 |
| 2012 Tesla Model S | 2100 | 540 | Panasonic | Li‐ion | 85 | 157 | 270 | 500 | 3 | |
| 2017 Chevy Bolt | 1624 | 440 | LG Chem | Li‐ion | 60 | 136 | 3.75/360 | 150 | 341 | 3 |
The introduction of NiMH technology to the GM EV1 in 1999 almost doubled the energy of the battery pack while reducing the weight slightly. Applying similar NiMH technology to the 1997 Toyota Prius HEV resulted in a battery with half the specific energy of the 1999 GM EV1 NiMH battery but with a far higher specific power as the battery is optimized for long‐life hybrid applications. In regular operation, the 1997 Toyota Prius uses only 20% of the available energy capacity in order to maximize its lifetime. The 1997 Toyota Prius P/E ratio is close to 11 versus 3 for the 1999 GM EV1 NiMH.
The Tesla Roadster introduced the high‐specific‐energy Li‐ion technology and achieved a specific energy three to four times greater that of the 1996 GM EV1 lead‐acid battery and twice that of the 1999 GM EV1 NiMH battery, while having a high specific power and a long lifetime.
The 2012 Tesla Model S increased the specific energy and power to higher values with a pack size close to five times greater than the 1996 GM EV1 but with a similar weight.
The 2011 Chevy Volt features a HEV battery with a P/E of 9 and has over double the specific energy of the 1996 GM EV1. The 2011 Nissan Leaf features a P/E close to 3 and a specific energy similar to the Chevy Volt.
The 2017 Chevy Bolt BEV features a higher‐power‐density lower‐cost battery pack than the 2011 Chevy Volt. The pack is shown in Figure 3.2. This GM vehicle illustrates the progress of battery technology as the 2017 Chevy Bolt has approximately four times the energy density of the 1996 GM EV1 at a fraction of the original cost.
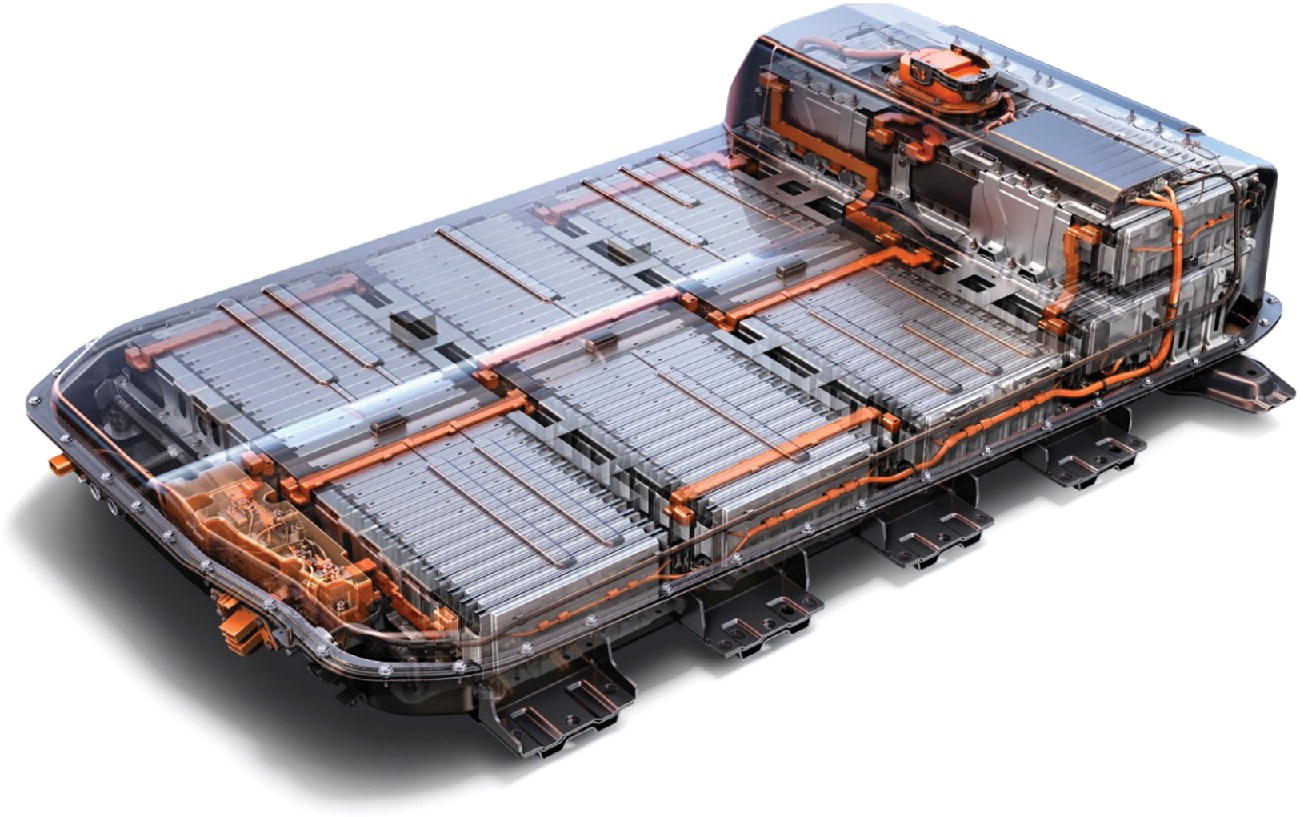
Figure 3.2 Battery pack of Chevy Bolt.
(Courtesy of General Motors.)
3.1.2 Basic Battery Operation
The discovery of the electrochemical battery is credited to Alessandro Volta, an Italian who lived from 1745 to 1827. The measure and unit of electric potential are voltage and the volt, respectively, and are named in his honor. Volta discovered that an electrical potential is generated when two dissimilar metals, known as electrodes, are submerged in an electrolyte. The voltage is dependent on many factors, including the type and size of the electrodes and the electrolyte, pressure, and temperature. The basic structure of a cell is as shown in Figure 3.3(a). The cathode is typically made from a metal oxide, while the anode is made from a conductive metal or graphite carbon. The electrodes are connected to conductive current collectors which connect the electrodes to the battery terminals. A separator is required in order to eliminate the possibility of shorting between the electrodes and to facilitate the flow of ions.
Figure 3.3 Simplified battery cell.
The positive voltage of the cell is at the cathode, and the negative voltage is at the anode. During charging of the cell, the electrical charger is connected between the terminals, and the current I flows from the charger into the cathode and out of the anode. During charging, electrons, with the symbol e−, flow externally in the opposite direction to the current from the cathode to the anode. The positive ions travel through the electrolyte from the cathode to the anode.
During discharge, when an external electrical load is connected to the battery cell, the current flows from the cathode through the load and back into the anode. The electron flow is external to the cell and in the opposite direction to the current. The ions travel internally through the electrolyte from the anode to the cathode.
3.1.3 Basic Electrochemistry
Electrochemistry is the study of the relationships between electricity and chemical reactions. Oxidation and reduction are the basic chemical reactions in an electric battery.
Oxidation is the loss of electrons in a chemical reaction. This is a common phenomenon in nature, especially when a material combines with oxygen, for example, the rusting of iron.
Reduction is the gain of electrons in a chemical reaction.
An oxidation‐reduction reaction, commonly termed a redox reaction, occurs when different materials lose and gain electrons in a shared reaction. The reducing agent, or reductant, loses electrons and is oxidized, while the oxidizing agent, or oxidant, gains electrons and is reduced. The energy released in a redox reaction can be used to generate or store electricity by enabling the flow of electrons externally. This is the basis of operation of an electrochemical battery cell or voltaic cell. A simple electrochemical cell comprises two electrodes and an electrolyte.
A voltaic cell is composed of two half‐cells. One half‐cell is the site of the oxidation reaction and the other half‐cell is the site of the reduction reaction.
The anode is the solid metal connection or electrode within the battery at which oxidation occurs during discharge. The anode is at the negative terminal of the battery. By definition, an anode is an electrode through which current flows into a device (during discharge in the case of the battery).
The cathode is the solid metal connection or electrode within the battery at which reduction occurs during discharge. The cathode is the positive electrode of the battery.
An electrolyte is a substance which contains ions and allows the flow of ionic charge. A cation is an ion with a positive charge, and an anion is an ion with a negative charge.
An electric battery comprises one or more of these electrochemical cells and produces dc current by the conversion of chemical energy into electrical energy.
A primary battery is a battery with one or more cells in which an irreversible chemical reaction produces electricity.
A secondary battery is a battery with one or more cells in which a reversible chemical reaction produces electricity.
3.1.3.1 Lead‐Acid Battery
The electrochemical elements of the lead‐acid battery are an anode plate made of lead (symbol Pb, from the Latin word plumbum for lead), a cathode plate covered with lead dioxide (PbO2), and an electrolyte consisting of water and sulfuric acid (H2SO4). A voltage of approximately 2 V is initially generated by the redox reactions. As the electricity is generated, a process known as sulfation causes lead sulfate (PbSO4) to coat the plates. As the battery is discharged, the voltage drops due to the sulfation. Lead sulfate is a soft material and is converted back into lead and sulfuric acid on recharge. However, if left uncharged, lead sulfate crystals can form and damage the battery irreversibly. This is a common source of lead‐acid battery failure. The battery can lose capacity due to sulfation and the battery should periodically undergo charge equalization, a process to ensure that the charge in each cell is brought to similar levels.
The half‐cell and cell reactions for lead‐acid, NiMH, and Li‐ion batteries are shown in Table 3.2. During charging of the lead‐acid cell, the lead sulfate and water at the cathode are converted to lead dioxide and sulfuric acid, releasing electrons and ions to flow to the anode. A half‐cell voltage of 1.69 V is generated at the cathode. The electrons and ions combine with the lead sulfate at the anode to create lead and sulfuric acid and a half‐cell voltage of −0.36 V.
Table 3.2 Cell parameters for various batteries.
| Chemistry | Electrode | Reaction | Equation | Voltage (V) |
| Lead‐acid charge |
Cathode | Oxidation |  |
1.69 |
| Anode | Reduction |  |
−0.36 | |
| Cell |  |
2.05 | ||
| Lead‐acid discharge |
Cathode | Reduction |  |
1.69 |
| Anode | Oxidation |  |
−0.36 | |
| Cell |  |
2.05 | ||
| NiMH charge |
Cathode | Oxidation |  |
0.45 |
| Anode | Reduction |  |
−0.83 | |
| Cell |  |
1.28 | ||
| NiMH discharge |
Cathode | Reduction |  |
0.45 |
| Anode | Oxidation |  |
−0.83 | |
| Cell |  |
1.28 | ||
| Li‐ion charge |
Cathode | Oxidation |  |
1 |
| Anode | Reduction |  |
−3 | |
| Cell |  |
4 | ||
| Li‐ion discharge |
Cathode | Reduction |  |
1 |
| Anode | Oxidation |  |
−3 | |
| Cell |  |
4 |
The reactions are reversed during discharge, and the nominal cell voltage during charge and discharge is 1.69 V minus −0.36 V, which equals 2.05 V.
Note that the voltages presented for the anode or cathode are with respect to a standard hydrogen electrode, which is the basis used to determine the voltage from a half‐cell.
Lead‐acid batteries remain the choice for starter batteries for conventional vehicles due to the low internal resistance, high cranking current, low costs and recyclability.
3.1.3.2 Nickel‐Metal Hydride
The NiMH cell is similar to the once widely used nickel‐cadmium (NiCad) cell. However, cadmium is toxic and a carcinogen, in addition to being expensive. The metal hydride enables the use of hydrogen and the replacement of the cadmium in the anode of the NiCad cell. A metal hydride is a compound in which hydrogen is bonded to the metal. The actual mix of metals tends to be proprietary but is a mix of common metals such as nickel and cobalt and smaller quantities of other materials. The nominal cell voltage for the NiMH cell is about 1.2 V, similar to NiCad.
While NiMH has many advantages over NiCad and the other chemistries, it has a very high self‐discharge compared to the other chemistries. NiMH and NiCad batteries can suffer from “memory” effects. The memory effect is the loss of capacity due to multiple partial charges. Similar to lead‐acid, these battery cells must be equalized periodically in order to ensure that each cell in a battery pack is equally charged.
3.1.3.3 Lithium‐Ion
The Li‐ion cell has a cathode formed from lithium metal oxide (LiMO2) and an anode formed from carbon in the form of graphite carbon. The Li‐ion cell operates differently from the lead‐acid cell in that during charging the lithium itself is released as a positive ion from the lithium metal oxide, and travels from the cathode through the electrolyte to the anode, where it combines with the carbon electrode to form lithiated carbon. The electrolyte is a high‐conductivity lithium salt which facilitates the movement of the Li cation.
The cathode reaction generates a half‐cell voltage of approximately 1 V, while the anode half‐cell reaction generates −3 V for an overall cell voltage of approximately 4 V.
Lithium metal can deposit on the anode at low temperatures. This buildup of lithium is known as a dendrite. The dendrite can result in a short circuit to the cathode by penetrating the separator.
The Li‐ion cell does not have a memory effect, but it loses its capacity with time and cycling. The active lithium within the battery decreases with time. Higher cell voltages can accelerate the loss of capacity. The cycling of the battery results in mechanical fracturing of the electrodes and a reduction in the battery lifetime. These effects increase significantly with temperature.
Lithium‐titanate (LiT) batteries feature titanium rather than graphite in the anode of the cell. This significantly improves the lifetime of the battery by eliminating the cracking of the graphite. The reduced battery internal resistance improves the power capability of the LiT battery, especially at low temperatures, making the battery an attractive option for HEVs. The disadvantages of LiT compared to Li‐ion are cost, low voltage, and low specific energy.
Newer Li‐ion batteries are using advanced materials for the anode. Silicon‐based alloys are being used to replace the carbon in order to achieve a higher energy density.
3.1.4 Units of Battery Energy Storage
A battery stores energy. An object is said to possess energy if it can do work. The unit of energy and work is the joule with the symbol J. The unit is named after an English physicist James Joule (1818–1889). In his professional career, he was a beer brewer, a useful career path when considering the complexities of electrochemistry.
Power is defined as the work done per second. The unit of power is the watt (symbol W). In equation form:

In units:

However, a joule is a relatively small unit of energy, and it is more common to reference other energy storage units such as watt‐hours. One watt‐hour (Wh) is defined as follows:

The watt‐hour is commonly used as a measure of energy for automotive applications. It can also be more useful to express energy in kilowatt‐hours (kWh):

A common quantity of measure related to battery energy storage is capacity, with the unit of ampere‐hour (Ah). The unit of current I is the ampere (symbol A). The unit is named after André‐Marie Ampère (1775–1836), a French physicist and mathematician who lived through the French Revolution and the Napoleonic era and contributed to electromagnetism. The standard SI unit for charge Q is the coulomb (symbol C), named after another Frenchman, Charles‐Augustin de Coulomb (1736–1806), who performed great work in the field of electrostatics and developed Coulomb’s law relating the forces between electric charges. In equation form:

In units,

Again, the coulomb is a small unit, and the ampere‐hour is more commonly referenced:

The capacity in ampere‐hours can be related to the energy in watt‐hours by multiplying the capacity by the battery voltage V:

In units,

3.1.5 Capacity Rate
In describing batteries, it is common to use the C rate. The C in this case stands for capacity rate and not the unit of coulombs. A C rate is a measure of how quickly the battery is charged or discharged relative to its maximum capacity.
For example, a 1C rate discharges the battery pack at a fixed given current in one hour, while a 10C rate discharges the battery pack at ten times the 1C current. A C/3 rate discharges the battery pack at one third of the 1C current.
3.1.5.1 Example of the 2011 Nissan Leaf Battery Pack
The 2011 Nissan Leaf has a nominal battery capacity of 24 kWh and a nominal battery voltage of 360 V [3]. The battery pack has 192 battery cells in all. The cells are arranged into 48 series modules with 4 cells per module, as shown in Figure 3.4. The cells were manufactured by AESC Corp., a collaboration between Nissan and NEC Corp.
Figure 3.4 Cell, module, and battery pack for 2011 Nissan Leaf [3].
The cell, module, and pack parameters are shown in Table 3.3. A single cell weighs 0.787 kg and has a length and breadth of 29 cm and 21.6 cm, respectively, and an approximate thickness of 0.61 cm. The cell has an energy density of 317 Wh/L and a specific energy of 157 Wh/kg. As the cells are integrated into the modules, these values drop to 206 Wh/L and 128 Wh/kg, respectively, due to the additional packaging, interconnects, cabling, and circuitry required in the module. As the pack is made up of the 48 modules in addition to the cabling, interconnects, and circuitry, a strong chassis is required to package and protect the cells. The overall pack weight increased to 294 kg with a specific energy of approximately 82 Wh/kg.
Table 3.3 Approximate cell, module, and pack parameters for the 2011 Nissan Leaf [3,4].
| Number of cells |
Voltage (V) | Capacity (Ah) | Energy (Wh) | Volume (L) | Weight (kg) | Energy density (Wh/L) |
Specific energy (Wh/kg) |
|
| Cell | 1 | 3.75 | 32.5 | 121.9 | 0.384 | 0.787 | 317 | 157 |
| Module | 4 | 7.5 | 65 | 487.5 | 2.365 | 3.8 | 206 | 128 |
| Pack | 192 | 360 | 65 | 23,400–24,000 | NA | 294 | NA | 82 |
The rated capacity of the cell is 32.5 Ah at a C/3 rate for 3 h when discharged. The C rate for this battery is quoted at C/3, which means that the rated capacity of 32.5 Ah or 121.875 Wh per cell, or 65 Ah or 23.4 kWh per pack, is available when the cell or battery is discharged at the C/3 rate of 10.8 A per cell, or 21.6 A per pack for 3 h. The C/3 rate is quoted for the battery capacity as this level is closer to the typical discharge current of the Nissan Leaf battery pack under normal driving conditions. The 1C rate is commonly used for other applications.
We now introduce two battery terms that are closely related.
The state of charge (SOC) is the portion of the total battery capacity that is available for discharge. It is often expressed as a percentage, and can be seen as a measure of how much energy remains in the battery.
The depth of discharge (DOD) is the portion of electrical energy stored in a battery that has been discharged. It is often expressed as a percentage.
For example, if the pack capacity is 24 kWh and 6 kWh has been discharged, the DOD is 6/24 or 25%. The remaining energy in the pack is then 18 kWh, and the SOC is 18/24 or 75%.
3.1.6 Battery Parameters and Comparisons
There are many parameters related to battery technology; at this point, we concern ourselves with the critical parameters that are of importance when selecting a battery for the automotive application. While focusing on the main batteries, we should also note that the battery chemistries can be optimized for particular automotive applications. Batteries used for HEVs typically feature smaller energy storage with a relatively narrow range of energy usage compared to the batteries for a BEV, which typically have a large storage and a very wide operating range.
3.1.6.1 Cell Voltage
The cell voltage is a function of the chemical reaction within the battery and can vary significantly with the SOC, age, temperature, and charge or discharge rate. The nominal cell voltages for the batteries of interest are shown in the third column of Table 3.4. The rated voltage of a battery cell is the average voltage over a full discharge cycle. For instance, the Li‐ion cell has a rated voltage of 3.75 V, while the cell voltage can actually vary from about 4.2 V when fully charged to 2.5 V when fully discharged. NiMH has a rated cell voltage of 1.2 V. As automotive batteries are typically packaged in series‐parallel strings, the higher the cell voltage, the fewer battery cells are required, making Li‐ion more attractive for packaging in battery packs. Lead‐acid has a nominal cell voltage of 2 V.
Table 3.4 Representative parameters for various batteries.
| Chemistry | Symbol | Cell voltage (V) |
Specific energy (Wh/kg) |
Cycle life |
Specific power (W/kg) |
Self‐discharge (% per month) |
| Lead‐acid | PbA | 2 | 35 | ≈500 | 250–500 | 5 |
| Nickel‐metal hydride | NiMH | 1.2 | 30–100 | >1000 | 200–600 | >10 |
| Lithium‐ion | Li‐ion | 3.8 | 80–160 | >1000 | 250–600 | <2 |
| Lithium‐titanate | LiT | 2.5 | 50–100 | >20000 | NA | NA |
| Alkaline | ZnMnO2 | 1.5 | 110 | NA | <0.3 |
Operation at high voltages can result in very significantly reduced battery lifetime. Similarly, operation at lower voltages can result in cell failure. Representative plots of the cell voltage as a function of capacity are presented in Figure 3.5 for various discharge rates, and are known as discharge curves. For the cell shown in Figure 3.5, the capacity of the cell is about 33.3 Ah for a C/3 discharge. Four levels are shown: C/3 or 11.1 A, 1C or 33.3 A, 1.8C or 60 A, and 2.7C or 90 A.

Figure 3.5 Representative discharges curves for a 33.3 Ah Li‐ion cell.
We can see one of the important characteristics of a battery. As the rate of discharge is increased, the cell terminal voltage, that is, the voltage at the output terminals of the cell, drops because the internal resistance results in voltage drops within the cell due to the flow of current from the cell. These losses result in increased internal heating within the cell and reduced available energy. For the cell shown in Figure 3.5, the capacity is about 33.3 Ah for a C/3 discharge. Interestingly, there is little change in capacity with increasing C. However, we shall see later that the available energy can drop significantly with increased C – the drop in useful energy from the battery can be deduced from the reduced average terminal voltage shown for each curve.
3.1.6.2 Specific Energy
The specific energy of a battery is a measure of the stored energy of a battery per unit weight. Li‐Ion has the highest energy density of the batteries, as shown in column 4 of Table 3.4. The specific energy of the Li‐ion battery is approximately 3 to 5 times that of the lead‐acid battery.
3.1.6.3 Cycle Life
Cycle Life is a measure of the number of times a battery can be charged and discharged before it reaches its end of life. Electrochemical batteries degrade with time and usage. Factors such as temperature and cell voltage also play a critical role. Again, Li‐ion has the highest cycle life and NiMH is similar. Lead‐acid batteries have a significantly lower lifetime while the primary alkaline cell cannot be recharged. The nominal values quoted in Table 3.4 are representative for 100% deep discharges. Lithium‐titanate (LiT) is a variation on a Li battery that eliminates the significant aging problem of Li‐ion. Although LiT has a lower cell voltage and specific energy, the very significant increase in cycle life makes the battery an attractive option for HEVs.
3.1.6.4 Specific Power
Specific power is a measure of the discharge power available from a battery pack per unit weight. Lead‐acid traditionally has had a high specific power and is used as the starter battery for conventional cars. The newer batteries, such as Li‐ion and NiMH, have comparable specific powers.
3.1.6.5 Self‐Discharge
Electrochemical cells consume energy even when not being charged or discharged. This energy usage is a parasitic use of stored energy and is termed self‐discharge. Nominal self‐discharge rates are shown for the various chemistries in the table. Self‐discharge rates are relatively high for nickel‐based batteries compared to their competitors. There can be a very high initial self‐discharge of a battery in the first 24 hours after being fully charged, but this rate tapers off. The self‐discharge rates can increase significantly with temperature. Note that while the self‐discharge of Li‐ion is less than 2%, the overall self‐discharge of a battery pack may be closer to 5% as up to an additional 3% may be required by the electronic system and circuits managing the battery pack.
3.2 Lifetime and Sizing Considerations
Unlike many electrical and electronic products, an electrochemical battery can have a relatively short lifetime depending on its chemistry. Automotive products are typically designed for a 10‐ to 12‐year lifetime. The typical semiconductor device, such as a microprocessor or switch, exhibits minor degradation with time. Electrochemical devices, such as batteries, fuel cells, and electrolytic capacitors, can degrade relatively fast as they age, especially with increased usage. Thus, a significant challenge for battery manufacturers has been to develop batteries which match the automotive product lifetime. The market has shifted from relatively short‐life lead‐acid batteries to longer‐life NiMH and Li‐ion batteries.
First, let us review some useful terms:
- Time and charge/discharge cycles: One of the characteristics of electrochemical cells is that the ability to store charge degrades with time. Repeated deep charge/discharge cycles can even more significantly result in a reduced lifetime.
- Lifetime: The lifetime of a battery can be described using time (years) or repeated cycles. Automotive batteries may have an additional requirement expressed as range in miles or kilometers.
- Beginning of life (BOL): The beginning‐of‐life parameters are typically the values for the capacity and the internal resistance of the battery when it is initially manufactured.
- End of life (EOL) The end‐of‐life parameters are the values of critical components once they degrade with time or usage. A typical end‐of‐life criterion is for the battery energy storage capacity to drop to 80% of the BOL value or for the internal resistance to increase by 50%.
The factors affecting the life of a battery are many and complex. The following are some of the related factors:
- Voltage: Too high a cell voltage can result in breakdown of the electrolyte, increased effects of impurities, and an accelerated loss of lithium from the electrodes, all of which increase resistance, reduce storage capacity, and consequently reduce cycles and lifetime. Thus, while lowering the cell voltage increases the battery lifetime, there is the trade‐off in that the lower voltage also reduces energy storage within the cell. A representative plot of the number of battery charge\discharge cycles and battery capacity versus the float voltage is presented in Figure 3.6. The float voltage is the voltage at which the cell is maintained once the battery has been fully charged in order to compensate for the self‐discharge of the cell. While charging the battery to a higher voltage increases stored energy in the battery, the higher voltages can accelerate battery aging and the number of charge\discharge cycles to the end of the life can drop very significantly. Some Li‐ion cells are operated at maximum values in the range of 3.6 to 3.8 V in order to optimize energy storage and cycle life. BEV and HEV Li‐ion batteries typically go to approximately 4.2 V maximum under normal conditions but can go slightly higher to approximately 4.3 V on a pulsed basis.
- High temperatures: In general, in chemistry and electronics, operating at high temperatures results in effects that can significantly reduce the lifetime and reliability of a component. The classic work published by the Swedish scientist Svante Arrhenius in 1889 relating lifetime to temperature applies very much to today’s electrochemical storage devices. Note that Arrhenius was one of the first scientists to investigate the effects of increased carbon emissions on the global climate. The usual rule of thumb based on the Arrhenius equation is that the lifetime of a device halves for every 10°C rise in temperature. Thus, battery lifetime can be significantly reduced in very high‐temperature climates. Many parts of the world have climates that are hostile to battery technology. For example, a temperature of greater than 40°C is common in Phoenix, Arizona, United States, in the summer. The temperature seen by the battery can be significantly higher as the car is sitting under a hot sun absorbing solar energy in addition to sitting on a hot asphalt or tarmacadam surface. The necessary use of air‐conditioning in Phoenix results in deeper discharges of the battery. Thus, the increased temperatures and deeper discharges can accelerate capacity fade and increase the internal resistance.
- Low temperatures: Operation at very low temperatures can also be a problem for some battery technologies. The electrolyte can become more viscous and have decreased conductivity. Freezing of Li‐ion cells at temperatures less than −10°C (14°F) reduces the amount of power and stored energy available from a battery. For this reason, manufacturers offer battery heaters for colder climates in order to ensure adequate performance. Ideally, the battery is heated while plugged in to the grid in charging mode so that the battery energy is saved for driving.
- Time: One of the biggest challenges for EV manufacturers has been to develop a battery with a calendar life greater than the lifetime of the vehicle. A battery life of 8 to 12 years is necessary. As discussed already, factors such as voltage, temperature, and cycles significantly affect the lifetime. As the battery ages, there is a reduction with time in the lithium available as an active material. A lower SOC results in a lower cell voltage, which slows the degradation of the electrolyte and the loss of active lithium.
- Battery life testing can be very complex and time consuming. Typical testing involves a series of partial and full charges and discharges on multiple identical battery packs to determine the number of cycles from BOL to EOL. A representative set of curves of charge/discharge versus DOD is plotted in Figure 3.7. The plots are based on the number of charge/discharge cycles until the capacity drops to the EOL capacity, typically specified as 80%.
Figure 3.6 Representative charge\discharge cycles and capacity versus cell float voltage for Li‐ion battery.
Figure 3.7 Charge\discharge cycles versus depth of discharge (DOD).
The solid line in Figure 3.7 has been generated using a basic assumption – that the total energy converted by a battery is related to the DOD. For the solid line curve (L = 1), we assume that the energy throughput of the battery is constant. Thus, if the battery can sustain 1000 cycles at 100% DOD, then it will sustain 2000 cycles for a 50% DOD and 10,000 cycles for a 10% DOD. In equation form:
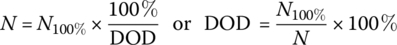
where N100% is the number of cycles for a 100% DOD, and N is the number of cycles for a given DOD.
The assumption of a constant energy throughput is a reasonable starting assumption when sizing a battery for a BEV.
However, battery lifetimes can be significantly higher than the numbers just outlined for HEV batteries, which are designed for shallower discharges and a very high cycle life. Representative lifecycle numbers for HEV batteries can range from 3000 cycles for a DOD of 75% (from a 95% SOC to a 20% SOC), to 9000 cycles for a DOD of 50% (from 95% SOC to 45% SOC). Smaller charges and discharges can result in the hundreds of thousands of cycles necessary for a HEV.
Thus, a cycle lifetime index L is introduced here as a novel concept, and is used in this section as a parameter to quantify battery life.
Equation (3.10) is modified to include index L as follows:
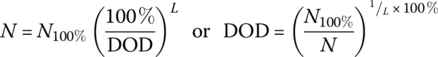
An enhanced‐lifetime curve is shown in Figure 3.7 for L = 3. The lifetime of the battery can be enhanced by modifying the chemical composition of the cell, improving the battery cooling, reducing the battery float voltage, and reducing the DOD. Such a battery could be used in a plug‐in hybrid‐electric vehicle (PHEV) or hybrid‐electric vehicle (HEV).
3.2.1 Examples of Battery Sizing
3.2.1.1 Example: BEV Battery Sizing
Determine the beginning‐of‐life kilowatt‐hour storage required in a BEV battery pack based on the following requirements: eight years of operation, an average of 48 km of driving per day sday over the 365 days of the year, daily charging, and an average battery output energy per kilometer Ekm = 180 Wh/km. Assume L = 1 and N100% = 1000.
Assume two parallel battery strings with 96 Li‐ion cells per string, with a total number of cells Ncell = 192, and a nominal voltage of 3.75 V per cell.
Determine the ampere‐hours per cell.
What are the vehicle ranges at BOL and EOL?
Solution:
First, let us determine the average daily energy usage and the number of charge\discharge cycles.
The total number of cycles N is
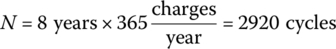
The average daily battery output energy Eday is
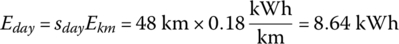
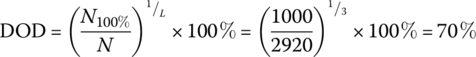
The required DOD can be simply determined as follows:
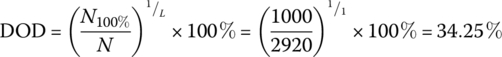
The BOL storage is

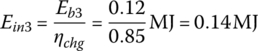
The EOL storage is

This simple example shows that a battery pack with an initial energy storage of 25.23 kWh is required in order to supply the required average daily energy over 8 years.
The pack has a total of 192 battery cells with two strings of 96 cells in series. The battery pack voltage Vbp is
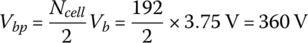
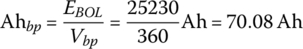
The battery pack ampere‐hours Ahbp is given by
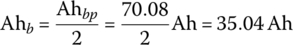
The cell ampere‐hours Ahb is simply derived by dividing the pack Ah by the number of strings:
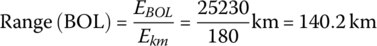
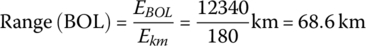
The vehicle range at BOL is
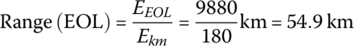
The vehicle range at EOL is

3.2.1.2 Example: PHEV Battery Sizing
In this example, we repeat the above exercise for an enhanced‐lifetime battery for use in a PHEV with a cycle lifetime index L = 3. A single string of batteries is assumed.
Solution:
As before, the total number of cycles N is 2920 cycles, and the average daily energy consumption Eday is 8.64 kWh.
The required DOD can be simply determined as follows:
Thus, in order to have an 80% SOC after 2920 cycles, the BOL storage is

The EOL storage is

This simple example shows that a battery pack with initial energy storage of 12.34 kWh is required in order to supply the required average daily energy over 8 years.
The vehicle range at BOL for the PHEV is
The vehicle range at EOL is
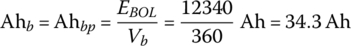
The cell and battery pack ampere‐hours are equal for a single string and are given by
These two examples illustrate some of the challenges of sizing a battery pack. The lower‐lifetime BEV battery pack has to be oversized for daily driving in order to meet the lifetime. The enhanced‐lifetime PHEV battery pack can be much smaller but has less overall energy and reduced range at BOL and EOL. As the DOD is reduced, the pack cycle life can increase very significantly into hundreds of thousands of cycles. The typical HEV battery pack uses only a relatively small range of DOD, resulting in very long lifetimes over hundreds of thousands of cycles.
3.2.2 Battery Pack Discharge Curves and Aging
EVs and their batteries have been tested by the US Department of Energy using Idaho National Laboratory and the Center for Evaluation of Clean Energy Technology, an Intertek Company [4]. The test vehicles have been driven in the desert climate of Phoenix, Arizona. At various intervals, the battery packs are disconnected and discharged at a constant rate in order to characterize the performance of the battery pack with miles driven. Test results for the 2013 Ford Focus BEV battery pack, manufactured by LG Chem, are as shown in Figure 3.8. In these tests, the vehicle battery pack is discharged at a constant rate of 8 kW. There is a significant drop in voltage from approximately 360 V to 260 V as the battery pack is discharged. The battery has been tested at various driving intervals. The baseline capacity of the battery was measured to be 74.44 Ah after 589 km on the odometer. The testing was repeated after 6,729 km, 19,429 km, and 38,621 km, with the overall testing taking 36 months. The battery capacity decreased to 71.42 Ah after 6,729 km, to 67.53 Ah after 19,429 km, and to 57.89 Ah at 38,621 km. The pack Ah degraded to 77.8% of the Ah at BOL.
Figure 3.8 2013 Ford Focus BEV voltage versus capacity discharged during the static discharge test at a C/3 rate.
(Data courtesy of Idaho National Laboratory and the Center for Evaluation of Clean Energy Technology, an Intertek Company).
The 2013 Chevy Volt PHEV features a similar LG Chem battery chemistry as the Ford Focus BEV. This pack was tested at the slightly higher 10 kW discharge rate. The results for the Chevy Volt are as shown in Figure 3.9. The battery capacity dropped from the baseline of 46.46 Ah at 7,227 km to 38 Ah at 257,541 km. Over the 44 months of testing the pack, the Ah degraded to 81.8% of the Ah at BOL. The pack storage had degraded about 10% by 195,387 km, and several percentage points more between 195,387 km and 257,541 km.
Figure 3.9 2013 Chevy Volt PHEV voltage versus capacity discharged during the static discharge test at a 10 kW rate.
(Data courtesy of Idaho National Laboratory and the Center for Evaluation of Clean Energy Technology, an Intertek Company).
The degradation in battery capacity with kilometers driven is lower in the PHEV compared to the BEV as the battery pack DOD in the PHEV is controlled within a narrower range using the gasoline engine. The test results confirm this observation. The PHEV experienced an 18.4% degradation by 257,541 km and 44 months, whereas the BEV experienced a 22.2% degradation by 38,621 km and 36 months. The driving conditions were relatively harsh. The Chevy Volt was driven in EV mode only for about 20% of the overall distance, but the battery pack played an active role in energy management while in HEV mode. The air‐conditioning was running for over 90% of the distance.
3.3 Battery Charging, Protection, and Management Systems
3.3.1 Battery Charging
All batteries have a similar charging profile. Generally, when discharged, the battery can accept a significant charge current. At a certain voltage or SOC, the current is reduced in order to ensure the correct charging voltage to the battery. As we have seen earlier in the chapter, the maximum cell voltage for the Li‐ion battery is an important factor in the lifetime of the battery. A typical charging profile for a Li‐ion battery is as shown in Figure 3.10. Initially, the battery is charged at a constant current. When the battery reaches around 80% SOC, the charge current is reduced in order to control the voltage applied to the battery. In this mode, the current is tapered in order to maintain the appropriate battery voltage. During this stage, the SOC slowly increases, and the battery can take significantly longer to go from 80% to 100% compared to going from a low SOC to 80%. Generally, high‐power charging is applied to Li‐ion batteries up to an SOC of 80%.
Figure 3.10 Li‐ion charge profile.
3.3.2 Battery Failure and Protection
Batteries can be a source of catastrophic failure resulting in dangerous and possible life‐threatening consequences. The automotive battery pack must undergo rigorous testing in order to ensure benign failure modes. In general, the battery should not emit parts, fire, or toxic or hazardous gases. Care must additionally be taken in manufacturing, transporting, using, and recycling batteries. Many safety standards exist to define the level of danger from an automotive battery. The following are examples of safety tests.
- Penetration: Penetration of the pack can expose the lithium‐based materials to air, resulting in fire.
- Crush: A battery pack must not become hazardous if it is crushed in a collision.
- Thermal stability: A battery pack can be susceptible to thermal runaway if the pack temperature is too high. This was a significant problem for sodium‐sulfur batteries but is generally not a problem for Li‐ion. Li‐ion batteries are thermally safe up to 80°C. Potentially dangerous reactions can occur at higher temperatures, and additional safety features must be implemented in order to reduce the likelihood of emissions of flames or hazardous gases. Reference the Further Reading section.
- Overcharge\overdischarge: These conditions can cause internal heating with the possibility of thermal runaway.
- External short: An external short can result in a very significant internal power dissipation within the battery with associated heating, elevated temperatures, and thermal runaway.
3.3.3 Battery Management System
As can be understood from the earlier material in this chapter, a battery pack is a complex energy storage system. In order to carry out the basic task of storing energy, a battery management system (BMS) is required to take all the battery and vehicle information and ensure safe operation of the battery. The typical BMS has the following tasks:
- Monitor voltage, current, power, and temperature.
- Estimate the SOC.
- Maintain a healthy battery and conduct diagnostics.
- Protect against fault conditions such as overcurrent, overcharge, undercharge, short circuit, and excessively high or low temperatures.
- Control power‐up, power‐down, and pre‐charge.
- Communicate with the vehicle.
- Balance the cells.
3.4 Battery Models
Electrochemistry is the study of the relationship between electricity and chemical reactions and is a vast topic. It is necessary to delve a little into electrochemistry in order to model the battery. The authors found [5] to be a useful introductory textbook.
A spontaneous process is a process which can proceed on its own without any outside assistance. A battery is an example of a spontaneous electrochemical redox reaction converting chemical energy and generating an electromotive force (emf) and performing electrical work. The Gibbs free energy is a measure of the reaction’s ability to do work.
The open‐circuit reversible voltage of an electrochemical cell Vr0 is the no‐load open‐circuit voltage of the cell, and is related to the change in the Gibbs free energy ΔG0 by the equation:
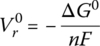
where n represents the number of moles of electrons transferred according to the balanced equation for the redox reaction, and F is Faraday’s constant (96,485 J/V‐mol). Josiah Gibbs (1839–1903) was the first person to be awarded a PhD in engineering from an American university (Yale in 1863), and he contributed greatly to the development of chemical thermodynamics.
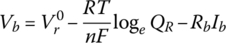
As the electrochemical cell is discharged, and the DOD increases or the SOC reduces, the reactants within the cell are consumed, and the concentrations of these reactions are reduced. A German chemist, Walther Nernst (1864–1941), also contributed significantly to electrochemistry and developed an equation relating the battery cell voltage Vb to the concentration of the reactants:
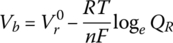
where R is the ideal gas constant, T is the temperature, and QR is the reaction quotient, which is a function of the reactant concentrations.
The Nernst equation is important as it relates the cell voltage to the SOC or DOD of the battery. The earlier Figure 3.5, reproduced in Figure 3.11, clearly illustrates the drop in cell voltage with the SOC. However, strictly speaking, the Nernst equation only applies when there is no current in the cell. In addition, we see that the cell voltage is dependent on the cell current. This relationship is governed by a number of voltage drops within the cell. There are three main voltage drops:
- Ohmic, the internal battery resistance due to the terminations and current collectors;
- Activation polarization, the internal resistance due to charge‐transfer reactions faced by the electrons at the electrode–electrolyte junctions;
- Concentration polarization, the internal resistance faced by the ions due to the electrolyte concentration.

Figure 3.11 Discharge curves for Li‐ion cell with polarization regions outlined.
For simplicity, we assume in this discussion that these resistances can be modeled by a single lumped equivalent battery internal resistance Rb. While this is a simplification of the complex electrochemical resistances, it provides a useful engineering approximation.
Thus, the battery cell voltage of Equation (3.29) can be modified to include an ohmic drop:
where Rb is the internal resistance of the battery due to the combined ohmic and polarization drops, and Ib is the cell current. The resistance can be different between charging and discharging, but this text assumes a constant resistance for simplicity.
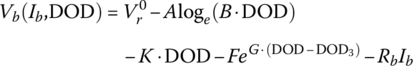
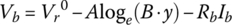
Finally, for this textbook, the battery equation is modified to account for two significant voltage drops. As can be seen from Figure 3.11, after the initial logarithmic drop, the battery voltage drops quasi‐linearly with battery capacity followed by an exponential drop. Thus, Equation (3.30) is modified as follows to show the cell voltage equation as a function of the no‐load reversible voltage; the logarithmic, linear, and exponential drops with capacity; and an ohmic drop with current:

where y is a variable that can be related to the capacity, the DOD, the SOC, or the cell energy, y3 is the value at which the exponential drop‐off begins, and A, B, K, F, and G are values determined by curve fitting.
Equation (3.31) can be written in terms of DOD as follows:
The equation can be expressed in terms of the no‐load voltage and the ohmic drop:

where

These equations can be easily represented as a simple battery equivalent circuit as shown in Figure 3.12.
Figure 3.12 Static battery equivalent circuit model.
3.4.1 A Simple Novel Curve Fit Model for BEV Batteries
There are many approaches to curve fitting to generate a battery model. The focus of this section is on a static or dc steady‐state model rather than on a more complex dynamic model. This novel static model can be generated on the basis of the discharge curves, while additional testing is required to generate a dynamic model with capacitive components.
The static curve can be modeled in a variety of ways. It is often useful to have a closed‐form equation as generated in Equation (3.32).
The following curve segments can be identified on the basis of the general characteristics of the discharge curves, as shown in Figure 3.13(a): an initial quasi‐logarithmic drop and a quasi‐linear drop in the middle range, followed by a quasi‐exponential drop as the cell is deeply discharged. In addition, the cell voltage drops with the cell discharge current due to the internal voltage drops.

Figure 3.13 Discharge curves for (a) 33.3 Ah cell and (b) simulation.
The first step is to identify the various modes within the discharge curve of Figure 3.13(a). The characteristic is quasi‐logarithmic between (Ah1,V1) and (Ah2,V2), quasi‐linear between (Ah2,V2) and (Ah3,V3), and quasi‐exponential between (Ah3,V3) and (Ah5,V5). An interim point is required for characterization in the exponential region, and this is (Ah4,V4). These data are recorded in Table 3.5 for the capacity rate of C/3. Points 6 and 7, as presented in Table 3.5, will be used in a later simplification. Curve‐fitting programs can be used to generate a curve fit for the battery cell.
Table 3.5 Curve‐fitting coordinates for 33.3 Ah cell.
| 1 | 2 | 3 | 4 | 5 | 6 | 7 | ||
| Ah | Ah | 0.3 | 2 | 28 | 32 | 33.3 | 8.3 | 25 |
| Vcell | V | 4.15 | 4.1 | 3.7 | 3.2 | 2.5 | 4 | 3.75 |
| DOD | % | 1 | 6 | 84 | 96 | 100 | 25 | 75 |
| y | % | 1 | 6 | 84 | 96 | 100 | 25 | 75 |
A simple curve fit is developed for the 33.3 Ah battery cell. The curve‐fit approach is outlined in the appendix of this chapter. As discussed in the appendix, the values of Table 3.6 are determined for the various parameters in Equation (3.32).
Table 3.6 Curve‐fitting parameters for 33.3 Ah cell.
 (V) (V) |
A (V) | B (%) | F (V) | G (%) | K (mV/%) | Rb (Ω) |
| 4.18 | 0.0279 | 1 | 0.0281 | 0.231 | 0.0039 | 0.0028 |
Plots of cell voltage can now be easily reproduced for various discharge rates. Plots based on Equation (3.32) are shown in Figure 3.13(b). These curves are an approximation of the cell terminal voltage. Now that we have a closed‐form equation for the cell voltage in terms of the current and DOD, we can plot the curves as shown in Figure 3.14(a). As expected, the cell voltage drops to 2.5 V at C/3, the rated capacity, at DOD = 100%. The characteristic at 4C is also shown.

Figure 3.14 (a) 33.3 Ah cell voltage versus DOD and (b) pack power versus DOD for 192 33.3 Ah cells.
Simulated curves for battery pack power as a function of DOD for constant discharge currents are recreated in Figure 3.14(b) for a 192 cell battery pack. For example, the 3C discharge rate results in a peak power of about 75 kW when fully charged, dropping to about 67 kW at a DOD of 80%. A discharge current of 133.2 A or a 4C rate would result in output powers greater than 80 kW at 90% DOD.
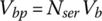
3.4.2 Voltage, Current, Resistance, and Efficiency of Battery Pack
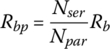
Once the cell voltage and current are known, the battery pack terminal voltage and current can be determined. If a battery pack has Npar strings in parallel and Nser cells in series for each string, as shown in Figure 3.15, then the battery pack voltage Vbp and current Ibp are related to the cell voltage Vb and current Ib by
and

Figure 3.15 Series‐parallel battery pack equivalent circuits.
The battery pack resistance Rbp is related to the cell resistance by
The efficiency of the battery pack during discharge, ηdis, is the ratio of the useful output power to the sum of the useful output power and the internal ohmic loss:
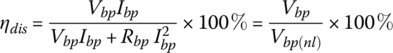
where Vbp(nl) is the no‐load battery pack terminal voltage.
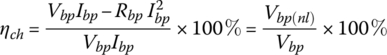
The efficiency of the battery pack during charging ηch is the ratio of the input power minus the internal resistive loss to the input power:
3.4.2.1 Example: Determining the Pack Voltage Range for a BEV
What is the voltage range for the 33.3 Li‐ion Ah cell when used in a BEV application with a DOD of 0% to 100%?
What is the battery pack voltage range if 192 cells are arranged in series‐parallel?
Solution:
From the earlier analysis, the cell voltage is 4.18V at 0% DOD and is 2.5 V when fully discharged.
The 192 cells arranged in series‐parallel results in the equivalent of 96 cells in series. Thus, we simply multiply the cell voltage range of 2.5 V to 4.18 V by 96, yielding a pack voltage ranging from 240 V when fully discharged to 401 V when fully charged.
3.4.3 A Simple Curve‐Fit Model for HEV Batteries
The DOD for a HEV is typically lower than that for a BEV. If we are planning on using only 50% of the SOC of the battery between 25% and 75% with the typical SOC being 50%, then the life of the battery will increase significantly. The modeling can also become easier as we are largely dealing with the quasi‐linear portion of the discharge curve, as shown in Figure 3.16. Thus, we can model the battery cell by ignoring the logarithmic and exponential portions of the cell equation. The simplified equation is

where Vb(nl,y6) is the no‐load voltage at y6. The equation can be expressed in terms of DOD as


Figure 3.16 Cell discharge curves for HEV operation.
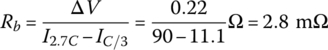
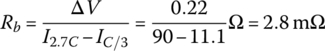
An estimate of the cell internal resistance Rb can be determined by measuring the cell voltage drop with increased current. Thus, the voltage drop ΔV is estimated at about 0.22 V at 50% of the rated Ah, as the discharge current increases from 11.1 A at C/3 to 90 A at 2.7C.
The no‐load voltage at a 25% DOD is obtained as

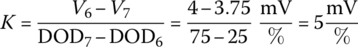
The voltage drop is modeled by a straight line of slope K through the quasi‐linear region between (Ah6,V6) and (Ah7, V7), with values given in Table 3.5:
3.4.3.1 Example: Determining the Pack Voltage Range for a HEV
What is the voltage range for the cell when used in a HEV application with a DOD of 25% to 75% and a load ranging from no‐load to a full load of 6C?
What is the battery pack voltage if there are 192 cells arranged with 96 cells in series and two strings in parallel?
Solution:
At no‐load, the cell voltage is simply Vb(nl,DOD6) = 4.03 V.
At full load, the 6C rate is 199.8 A, and the cell voltage is
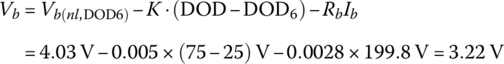
Thus, the cell output voltage ranges from 3.22 V to 4.03 V.
The 192 cells arranged in series‐parallel results in 96 cells in series. Thus, we simply multiply the cell voltage by 96, obtaining a pack voltage ranging from 387 V at no‐load to 309 V at full load.
3.4.4 Charging
There is a range of available powers for charging a battery pack. A standard home charger may be able to output from 2 kW to 20 kW depending on the installation. Fast charging can run into many tens of kilowatts. The same equations can be used. All we have to do is change the sign on the battery current, ensuring that the terminal voltage is greater than the no‐load cell voltage to recharge the cell.


A set of characteristic curves of cell terminal voltage versus DOD are plotted in Figure 3.17 for charging. Care has to be taken when charging to not exceed the maximum cell voltage. A maximum voltage of 4.3 V is shown.

Figure 3.17 Simulated charge curves for the 33.3 Ah cell.
Using 4.3 V as the maximum, it is clear that charging may have to be curtailed at a low DOD (or at a high SOC). For example, at 3C the cell hits the limit at approximately 20% DOD or 80% SOC. The curves show that charging at 1C or below keeps the cell voltage below the limit.
3.4.4.1 Example: Fast Charging a Battery Pack
A 24 kWh battery pack can be fast charged from 0% to 80% SOC in 30 min. Determine the approximate charge current and power in order to achieve this charge time.
Solution:
The nominal pack size is 24 kWh, and so 80% is 19.2 kWh.
Thus, the battery has to be recharged at an average rate of approximately 2 times 19.2 kW, which equals 38.4 kW net in order to recharge the pack in 30 min.
If the nominal battery pack voltage is 360 V, say, then the average charge current is 38.4 kW/360 V or 107 A.
3.4.5 Determining the Cell/Pack Voltage for a Given Output\Input Power
If the DOD is known, then the cell voltage is simply
as the no‐load voltage Vb(nl) is a function of the DOD. The current is positive for discharging and negative for charging. The basic circuit model is presented in Figure 3.18.
Figure 3.18 Simple battery model.
If the battery input or output power Pb is known, as often is the case, then the current and terminal voltage are easily determined by solving the following quadratic equation:
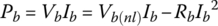
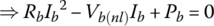
The solution is
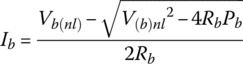
for discharge, and
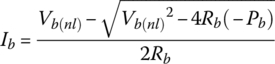
for charge.
3.4.5.1 Example: Battery Discharge
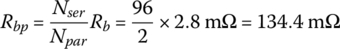
A battery has 96 cells in series per string with two parallel strings. Each cell has a no‐load voltage of 4.18 V and an internal resistance of 2.8 mΩ.
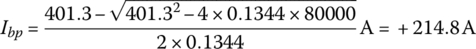
- Determine the pack current and voltage under a 80 kW discharge if the battery is fully charged.
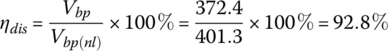
- Determine the discharge efficiency of the battery.
Solution:
The no‐load voltage when fully charged is 96 times 4.18 V or Vbp(nl) = 401.3 V.
From Equation (3.37), the pack resistance is
From Equation (3.50),
From Equation (3.47),

From Equation (3.38),
3.4.5.2 Example: Battery Charge
Determine the pack current and voltage under a 50 kW charge if the battery is fully discharged. The cell voltage drops to 2.5 V when fully discharged. How efficient is the charging of the battery at this power level?
Solution:
The no‐load voltage when fully discharged is 96 times 2.5 V or Vbp(nl) = 240 V. The pack resistance is as before.
and the pack voltage is

From Equation (3.39),
3.4.6 Cell Energy and Discharge Rate
The usable battery capacity drops as the C rate increases. This is basically due to the increased resistive losses at the higher discharge rates. Note that the following approach to estimating the cell energy of a battery works for the Li‐ion cells presented in this book but is not generally applicable to other battery chemistries.
The Ah value for an automotive BEV battery is typically specified at a low rate, for example, the C/3 rate. The total energy stored within the cell prior to discharge Ecell is equal to the rated capacity times the rated voltage plus the resistive losses for the rated condition:
where “h” is one hour.
The nominal voltage VxC at other C rates, designated xC, can be approximated by subtracting the internal resistance voltage drop from the rated voltage:

where x is the coefficient of the C rate.
The available output energy at xC is then approximated by
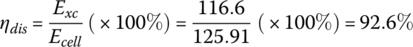
The efficiency of the discharge (and also of charge) is also a function of the C rate;

3.4.6.1 Example: Cell Capacity
The capacity of the cell is approximately 33.3 Ah at C/3 with a rated voltage of 3.75 V.
Determine the capacity at 3C. Assume Rb = 2.8 mΩ.
Solution:
The total energy stored within the cell prior to discharge is equal to the product of the capacity and the rated voltage plus the resistive losses at C/3.
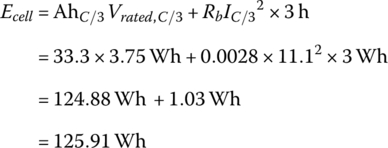
At 3C, the current increases to 99.9 A, and there is an increased internal resistive power loss that reduces the energy available from the cell.

It is clear from the example that the available output energy from the cell is reduced as the C rate increases. This occurs because the internal battery losses increase with the square of the current. Thus, if the C/3 rate is the baseline for a particular cell, then the available energy is reduced as the rate increases. The ampere‐hour capacity may not necessarily drop as it is equal to the available energy divided by the nominal voltage, which is also dropping.
The rated voltage of the cell is specified as 3.75 V for this cell, and this is the average voltage as the cell discharges from a SOC of 100% to 0% at rated C (C/3 in this case). The average voltage for 3C is

At the 3C rate,
The capacity can be determined by dividing the output energy by the nominal voltage
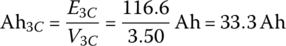
a value which shows little change from the rated capacity.
These quantities are summarized in Table 3.7 for the 33.3 Ah cell for C/3, C, and 3C. As can be seen from the table, the capacity remains approximately constant for the various rates, whereas the average cell terminal voltage, useful output energy, and efficiency vary relatively significantly.
Table 3.7 Estimations of various quantities for the 33.3 Ah Li‐ion cell.
| Parameter | Unit | C/3 (11.1A) | 1C (33.3A) | 3C (99.9 A) |
| x | 1/3 | 1 | 3 | |
| V | V | 3.75 | 3.69 | 3.50 |
| Ah | Ah | 33.3 | 33.3 | 33.3 |
| Wh | Wh | 124.88 | 122.8 | 116.6 |
| η | % | 99.2 | 97.5 | 92.6 |
3.5 Example: The Fuel Economy of a BEV Vehicle with a Fixed Gear Ratio
In this example, the vehicle fuel performance is investigated for the simple drive cycle and data presented in Section 2.3. The BEV has a 60 kWh battery. It is assumed that the combined battery and electric drive efficiency ηed is 85%, the charging efficiency from the plug ηchg is 85%, and the gearing\transmission efficiency ηg is 95%, as shown in Figure 3.19. The battery power drain during idle time is 200 W.
Figure 3.19 BEV architecture.
Consider two different countries in determining the CO2 emissions per kilometer for the electrical energy from the plug: the United States with about 500 gCO2/kWh (electrical), and Norway with about 10 gCO2/kWh (electrical).
Solution:
From Section 2.3, the traction powers are Pt1 = 3.478 kW and Pt2 =12.050 kW. The overall traction energy for the drive cycle is EtC = 20.72 MJ (5.76 kWh).
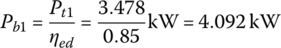
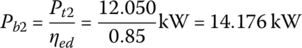
The power required from the battery Pb is the motor output power divided by the electric drive efficiency, ηed:

The battery powers Pb1 and Pb2 are
The battery power during idle time is

The energy consumed from the battery is simply the product of power and time:

The battery output energies Eb1, Eb2, and Eb3 are


The battery output energy over the drive cycle, EbC, is

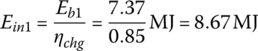
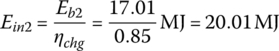
The BEV is fueled using electricity from the plug. Assuming a charging efficiency ηchg from the plug to the battery of 85%, the supplied energy from the grid Ein is

The input energies, Ein1, Ein2, and Ein3, are
The required input energy EinC for the cycle is

The powertrain efficiency of the vehicle from the battery to the output of the traction motor is

and so

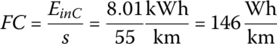
The fuel consumption (FC) of the vehicle and the related fuel economy are typically based on the input energy from the plug:
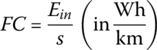
and so the fuel economy for this cycle is
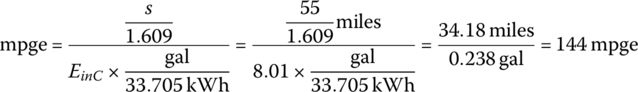
An equivalent mpg is estimated for BEVs on the basis of a simple calculation, and is termed mpge. An energy density of 33.705 kWh/gal (US) is used as the basis.
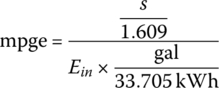
Thus, the cycle mpge is
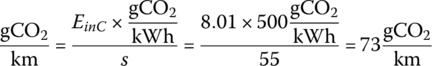
Knowing the input energy, the upstream carbon emissions due to the BEV can be estimated. Typically, the figures for carbon emissions per electrical kilowatt‐hour are published for the various electrical power grids around the globe. A representative number for the United States is about 500 gCO2/kWh (electrical) (including upstream emissions). Countries such as Norway and France can have much lower emissions, about 10 gCO2/kWh in Norway due to hydroelectric power and about 50 gCO2/kWh in France due to nuclear power. Other countries can have higher emissions due to the use of coal.
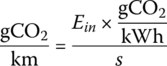
The emissions for this cycle in the United States is
This number is about 50 times lower for Norway at about 1.5 gCO2/km. It is little wonder that Norway has invested heavily in BEVs as its electricity is almost free of fossil fuel.
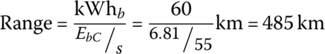
The vehicle range for the BEV is simply the energy storage of the battery kWhb divided by the energy consumption:
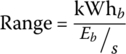
Therefore, the range of the 60 kWh vehicle for this cycle is
The various data are summarized in Table 3.8.
Table 3.8 Results for simplified drive cycle using a BEV.
| Speed (km/h) | Time (s) | Eb (MJ) | Ein (MJ) | ηpt (%) | FC (Wh/km) | mpg (US) (mpge) | Range (km) | CO2/km United States/Norway (gCO2/km) |
| 50 | 1800 | 7.37 | 8.67 | 85 | 96 | 217 | 732 | 48/1 |
| 90 | 1200 | 17.01 | 20.01 | 85 | 185 | 113 | 380 | 93/1.8 |
| Idle | 600 | 0.12 | 0.14 | — | — | — | — | |
| Total | 3600 | 24.5 | 28.82 | 84.6 | 146 | 144 | 485 | 73/1.5 |
This example illustrates the advantages and disadvantages of the BEV compared to the fossil fuel and fuel cell options to be discussed in the following chapters. The BEV powertrain is far more efficient than the gasoline or diesel vehicles. However, the range is limited. The ability of the BEV to reduce carbon emissions ultimately depends on the fuel source used to power the electric grid. A major advantage of the BEV is its ability to decouple the emissions from the place of use to the grid power station.
References
- 1 S. Levine, The Powerhouse, Inside the Invention of a Battery to Save the World, Viking, 2015.
- 2 M. H. Braga, N. S. Grundish, A. J. Murchison, and J. B. Goodenough, “Alternative strategy for a safe rechargeable battery,” Journal of Energy and Environmental Science, 10, pp. 331–336, 2017.
- 3 Website of AESC: http://www.eco‐aesc‐lb.com/en/product/liion_ev
- 4 Battery testing at Idaho National Laboratory: http://avt.inl.gov/fsev.shtml
- 5 T. L. Brown, H. E. LeMay, B. E. Bursten, C. J. Murphy, and P. M. Woodward, Chemistry: The Central Science, 12th edition, Prentice Hall (Pearson Education).
Further Reading
- 1 T. B. Reddy, Linden’s Handbook of Batteries, 4th edition, McGraw‐Hill, 2011.
- 2 O. Gross, “Introduction to advanced automotive batteries,” seminar, IEEE Vehicle Power & Propulsion Conference, 2011.
- 3 F. Hoffart, “Proper care extends Li‐ion battery life,” Power Electronics Technology, pp. 24–28, April 2007.
- 4 M. Petersen, “Probe blames Boeing and FAA for 787 Dreamliner battery fire,” Los Angeles Times, 1 December 2014.
- 5 E. Hu, “Samsung Pins Blame On Batteries For Galaxy Note 7 Fires,” National Public Radio, 22 January 2017.
Problems
- 3.1 A BEV has the following requirements: eight years of operation at an average of 24,000 km per year, averaged out over 365 days per year. Assume an average battery output of 204 Wh/km and a rated cell voltage of 3.6 V, a capacity of 3.4 Ah, and a lifetime index of L = 1.
- Determine the BOL kWh storage.
- How many cells do you need and what is the BOL range?
- What is the BOL storage and how many cells are required for a larger pack in order to increase the BOL range to 425 km?
- How many parallel strings are required if the pack has 96 cells in series?
- What is the battery pack mass, assuming a battery with a pack density of 150 Wh/kg?
- If the peak power is 325 kW, what is the P/E ratio of the battery for the larger pack?
- 3.2 A PHEV battery pack has the following requirements: ten years of operation at an average of 50 km per day, an average battery output of 5 km/kWh, and a 14.6 Ah cell with a rated voltage of 3.65 V and an index of L = 3.
- What is the BOL battery pack energy storage?
- What is the total number of cells required, to the nearest factor of 3?
- What is the pack voltage if the pack is in series‐parallel with three cells in parallel?
- If the peak power is 110 kW, what is the P/E ratio of the battery?
- What is the battery pack mass, assuming a with a pack density of 150 Wh/kg?
- 3.3 A NiMH HEV battery pack is sized based on the following requirements: 10,000 cycles of 60 Wh per year for ten years, a 6.5 Ah cell with a rated voltage of 1.2 V and an index of L = 1.5.
- What is the BOL battery pack energy storage?
- What is the total number of cells required?
- What is the pack voltage if the cells are all in series?
- If the peak power is 30 kW, what is the P/E ratio of the battery?
- 3.4 A PHEV battery has a 100% SOC of 36 kWh. The battery DOD is maintained within a range of 20% to 80%. The simplified HEV battery pack model has the following parameters: open‐circuit voltage is Vbp(nl) = 360 V at 20% DOD, with an internal ohmic resistance of Rb = 200 mΩ and a constant of K = 0.5 V/(% DOD).
- Determine the battery terminal voltage if the battery is discharged to 80% at a constant 100 A.
- Determine the battery terminal voltage, current, and efficiency at DOD = 80% for (a) +80 kW discharge and (b) −80 kW charge.
- If the battery has 96 cells in series, at which charging power does the battery hit a 4.3 V per cell limit at 20% DOD?
- 3.5 The LiT cell of Figure 3.20 is rated at 2.5 V, 2 Ah at 1C.
- Determine an approximate HEV cell voltage model as a function of y = DOD and Ib for the cell.
- Determine the approximate cell Wh, Ah, and efficiency for the 50 C rate.
Figure 3.20 Representative discharge curves for a LiT 2.0 Ah battery cell. [Ans. Rb = 2.8 mΩ, Vb(nl) = 2.61 V at 20%, K = 3.3 mV/(%DOD), 4.45 Wh, 2 Ah, 88.6%]
- 3.6 A Li‐ion cell is rated at 3.6 V, 3.4 Ah at 0.2C and has an internal resistance of 65 mΩ. Determine the cell Wh, Ah, and efficiency for the 4C rate.
[Ans. 9.38 Wh, 3.4 Ah, 75.7%]
- 3.7 An EV battery has a 100% SOC of 85 kWh. The battery can be charged at high power when the battery DOD is maintained within a range of 20% to 100%. The pack has 96 cells in series per string with 74 parallel strings. Each cell has an average no‐load cell voltage during charge of 3.64 V and an internal resistance of 65 mΩ.
- Determine the battery terminal voltage, current, and efficiency for a 120 kW charge.
- What approximate time is required to charge the battery from a DOD of 100% to 20%?
[Ans. −318.9 A, 376.3 V, 92.9%, 30–40 min]
- 3.8 For the vehicle in Problem 3.5 determine the carbon emissions and range when traveling at a constant speed of 120 km/h. See Chapter 2, Problem 2.7. [Ans. 142 gCO2/km, 124 km]
- 3.9 The drive cycle of Problem 3.5 is modified such that the idle period is replaced by a highway cruise at 120 km/h for 600 s. Determine the carbon emissions and range for the revised drive cycle.
[Ans. 91 gCO2/km, 194 km]
Appendix: A Simplified Curve‐Fit Model for BEV Batteries
In this section, a curve fit is done by hand by making some simplifying engineering assumptions about the dominating components of Figure 3.13(a) as the cell is discharged. Initially, the cell resistance Rb is determined on the basis of the ohmic drop with current. It is then assumed that the initial voltage drop is dominated by a loge component, then followed by a quasi‐ohmic drop, and finally followed by a quasi‐exponential drop. For this study, it is assumed that y = DOD, as DOD is a commonly used variable.
An estimate of the cell internal resistance Rb can be obtained by measuring the cell voltage drop with increased current. Thus, the voltage drop ΔV is estimated at about 0.22 V as the discharge current increases from 11.1 A (C/3) to 90 A (2.7C) at about 50% of the rated Ah.
In order to simplify the mathematics, it is assumed that the Vr0 is the voltage at a DOD of 1% rather than at 0%. Thus, the fully charged open‐circuit cell voltage Vr0 is determined by accounting for the resistive drop.

When discharged, the fully charged cell voltage initially drops logarithmically from V1 to V2. For this portion, we assume that the voltage drops are as follows:
It can be shown that
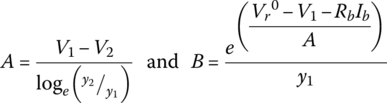
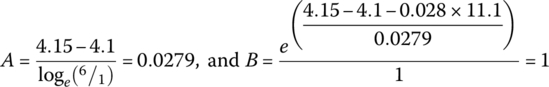
Thus, for the 33.3 Ah cell:
Through the quasi‐linear region, the voltage continues to drop due to the loge function. It is assumed that the balance of the drop in the linear region can be modeled with a straight line of slope K:

or
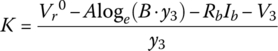
For this cell:

Thus, the cell voltage drops 3.9 mV for each percentage rise in DOD. Finally, the voltage drops exponentially from V3 to V5. An intermediate point V4 is required in order to solve for the F and G coefficients.
Let


and


It can be shown that
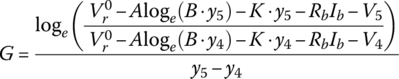
and

resulting in the following values for the cell:
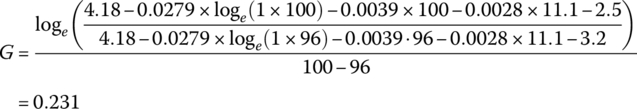
and
