BIG IDEA 8
Generalizing
The big idea that is at the center of this set of activities—generalizing—is an action that could represent all of mathematics. When teachers share methods with students, they are showing them something that is general—an idea that always works. For example, we know that multiplying a natural number by 10 results in a zero being added to the number. The problem that arises in many mathematics classrooms is that teachers show a general idea, one intended to help students focus on the underlying concept, but students think it is a specific method they should memorize. The same problem can come up when teachers show any method—for example, the multiplication algorithm or a method for working out ratio. A good way to show new ideas is to share that something general is happening—something that always happens—and teach students that their role in mathematics is always to work out what is particular in a situation and what is general. Each activity in this set is conceptually interesting and offers students occasions to study numbers and patterns, which is valuable in its own right. The activities have also been designed to give opportunities for students to think: What is particular and what is general? This question is at the center of the work of mathematicians, who study patterns to make general statements that ultimately lead to mathematical proofs.
In the Visualize activity, students are presented with a display of data and asked what it represents. This is a great occasion for students to struggle, as it is not obvious what the data display represents, but it is something students will be able to work out through exploration and investigation. When the display is presented to the class, students will probably have lots of ideas and conjectures about what they think the data in the pattern represents. The line plot actually shows the number of factors for each number. We are really excited about this activity, and we think students will embrace the challenge of the number mystery. In this activity, help students produce general statements and consider together how generalizable they are. For example, they may say that odd numbers have shorter stacks. Is that a generalizable statement? Is it always true? It is good to ask students why their observations exist, to help them think about the structure of numbers and reason about them.
In the Play activity, we present the game Pennies and Paperclips. This activity comes from a wonderful website and collection of activities called Discovering the Art of Mathematics, and it is a game that I use often with my undergraduate students. It is a lovely example of a low‐floor, high‐ceiling task: it has a low floor—anyone can access it and play the game—but it extends to very high levels and cool generalizations. In a sixth‐grade classroom we do not expect students to come up with formal mathematical proofs that relate to the patterns, but they can come up with conjectures and patterns that are generalizable. Can they work out situations when Pennies always wins? Or Paperclips always wins? Would these generalizations hold on different sizes of boards?
In the Investigate activity, we share a toothpick squares puzzle. In this activity, students build 2 × 2 and 4 × 4 toothpick squares, and we ask them to investigate any patterns they notice and record them on chart paper for a gallery walk later. This activity provides a really good opportunity for showing a generalization through color coding. Bringing color to mathematics is always worthwhile, both to highlight particular aspects of a mathematical idea and to bring mathematics to life. Many people know that color can be helpful, but they may not have used color to show how a pattern grows and to show generalization, as we highlight in the task, so this is a good opportunity for students to learn this approach. After students have engaged in a gallery walk, they can discuss as a class how their generalizations might work for finding out how many toothpicks there would be in any case.
Generalizing Number Patterns
Snapshot

Students explore making generalizations about numerical patterns presented graphically, to build an expansive understanding of what generalizations can be.
Agenda
| Activity | Time | Description/Prompt | Materials |
| Launch | 10 min | Show students the Number Mystery Line Plot sheet and ask, What do you think this graph shows? What do you notice about the graph that might help you figure it out? Collect some observations. | Number Mystery Line Plot sheet, to display |
| Explore | 20 min | Partners explore the Number Mystery Line Plot sheet to collect observations and develop a conjecture about what the graph represents. Students use their conjectures to predict additional data and add it to the line plot. | Number Mystery Line Plot sheet, one per partnership |
| Discuss | 20 min | Discuss students’ conjectures about what the line plot shows and evidence to support or refute these ideas. Come to consensus that the graph shows the number of factors of each whole number, and add data to the line plot for 17–20. | Number Mystery Line Plot, to display |
| Explore | 30 min | Partners explore patterns in the data and make general statements about what they notice. They investigate whether these general statements hold true when extending the graph and what new general statements they can make with this additional data. |
|
| Discuss | 20 min | Collects students’ general statements about the patterns in the data into a Generalizations about Factors chart, and name these statements as generalizations. Ask students to provide supporting evidence for these claims, or counterexamples to refute them. Come to consensus about which the class believes to be true. | Chart and markers |
| Extend | 30+ min | Partners develop their own number mystery graphs that show something about numbers without indicating just what they display. Groups swap mystery graphs to see whether they can find patterns and identify what the graph shows. | Make available: grid paper (see appendix), rulers, and colors |
To the Teacher
In this activity, we begin our exploration of generalizing by focusing on a number pattern presented visually in a line plot.
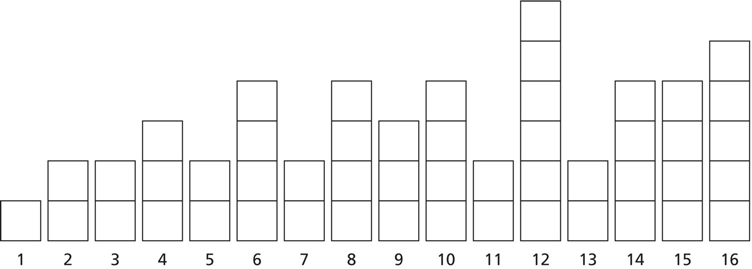
What number pattern does this line plot represent?
Whole numbers are shown across the horizontal axis. We challenge students to first make observations about this data and then try to figure out what this line plot shows. In a similar vein, we challenge you to try this with colleagues before you ask students to do so. Such an experience will give you insight into the ways students may be struggling to track down just what this data shows.
Upon looking at the graph, you and students will notice that the data appears to grow, but irregularly. The pattern is certainly not linear. It does not grow regularly, as with the radial patterns students investigated in Big Idea 7. In fact, what is shown is not a pattern of growth at all, but a reflection on the numbers’ own properties. This is a graph of the number of factors of whole numbers.
We’ve left the boxes within the line plot open so that students can choose to write or color inside them to help document the patterns they see, or the reason behind those patterns. For instance, if students were to jot the factors inside these boxes, they would see that all of the numbers with stacks of two boxes have just 1 and themselves. They would also see that the first (or last) box is always 1, and every number has 1 as a factor. This could lead to a generalization such as “no number has zero factors.”
Activity
Launch
Launch the activity by showing students the Number Mystery Line Plot in the document camera. Ask, What do you think this graph shows? What do you notice about the graph that might help you figure it out? Give students a chance to turn and talk to a partner. Invite students to share observations about the data that might help the class figure out what the graph shows—not their conjectures about what the graph represents. Be sure to ask students to hold on to their conjectures for later; at this stage you want to hear observations. Annotate a few on the line plot.
Explore
Working in partners, students explore a copy of the Number Mystery Line Plot sheet and use their observations of the data to try to figure out what the graph represents. Ask students to develop a conjecture with evidence to support that idea.
Once students have a conjecture, ask, If your conjecture were true, what would the next few values on the line plot look like? Ask students to add their predicted data to the graph.
If students struggle to develop a conjecture, ask them to start collecting evidence that will be useful either in supporting or refuting others’ conjectures.
Discuss
Gather students together to discuss the question, What does this line plot show? Ask groups to pose their conjectures and provide evidence. All groups can contribute additional supporting evidence or a counterexample which shows that the conjecture is not true. Use the class’s observations to come to consensus about what the line plot shows.
Ask, What would the next few values on the line plot look like using this conjecture? Together add data for 17–20 to the line plot. You might invite students to cross out the Number Mystery title of the line plot and give it an accurate name, such as Number of Factors. Tell students that in the next part of this activity, they are going to be trying to make general statements about the graph, the numbers, and the data.
Explore
Partners explore the following questions:
- What patterns do you see in the data?
- What general statements can you make based on this data? (Invite students to color‐code or mark up the graph to make these visible.)
Students collect their general statements about the data and can test them by continuing to extend the line plot. Provide students with additional paper and tape to make their line plots as long as they want. Students explore the following questions:
- Do your general statements continue to hold true as you extend the graph?
- What new statements can you make with more data to look at?
Discuss
Gather students together and collect groups’ general statements about the factors of numbers as represented in the line plot. Tell students that these general statements are called generalizations. Record each statement on a chart called Generalizations about Factors. Then invite the class to share supporting evidence for this generalization or a counterexample which shows that the statement either is not true or needs to be revised. All groups should be involved in providing evidence for any generalization. Students can contribute evidence using their entire line plot, however much they have extended it.
Come to agreement about which generalizations seem to hold true based on the data the class has. Discuss the following questions:
- What do these generalizations make you wonder?
- How far might we need to extend the graph to be confident in the claims?
Extend
Students can create their own graphs of number data without showing what that data represents. Provide groups with grid paper (see appendix), rulers, and colors. Once students have developed a graph, groups can swap number mysteries with one another. Students explore, Can you figure out what the line plot shows? What is your evidence? Each group develops a conjecture and evidence and presents it to the group who created the graph to find out whether they are correct.
Look‐Fors
- Are students testing ideas for the Number Mystery Line Plot that focus on number properties? Students have seen data that is collected to show variation among a sample in Big Idea 6, such as the data of hurricane frequency by category. The data in this activity is different, because it is based on the properties of the numbers themselves. While there is variation along the graph, any graph that plots the factors of whole numbers will be identical to this one. For students to interpret the graph, they need to think about what they know and can find out about the numbers themselves. Students must ask questions about the trends in the data, if any, and how those connect back to number properties. To help students attend to numbers, you might ask, What do you know about these number across the horizontal axis? What patterns do you see? How do those connect to what you know about these numbers? You may focus students on one number or a few numbers in particular to support students in generating ideas.
- Are students’ generalizations general? Moving from observations to generalization is a leap. Students may make an observation like, “Most of the odd numbers have shorter stacks than the even numbers.” But this is not yet a generalization. Observations that include language like most, some, few, rarely, almost all, tend to, and so on hint at a pattern but acknowledge that the pattern is not generalizable. Students may struggle with moving from these observations to identifying patterns that hold true across all numbers. You might ask students to think about why their observations may exist, which could support them in reasoning about what may be general about them. Further, some generalizations can have exceptions. For instance, students can make the generalization that “all prime numbers are odd, except for 2.” This is a valid generalization because no matter how far they extend the graph, no additional even primes will exist.
- Do students extend the line plot accurately? Once students have a shared understanding of what the line plot shows, they will need to extend the graph to continue to explore and test their observations and generalizations. If students make errors in counting the number of factors for a given whole number, this will shift the statements that they can make about the data. Attend to students’ extended graphs and ask them questions about how they constructed the data. If students are struggling with testing their ideas on the extended graph, you may suggest that they check their data to be sure that it is accurate before they discard generalizations.
Reflect
What did looking for generalizations help you notice?

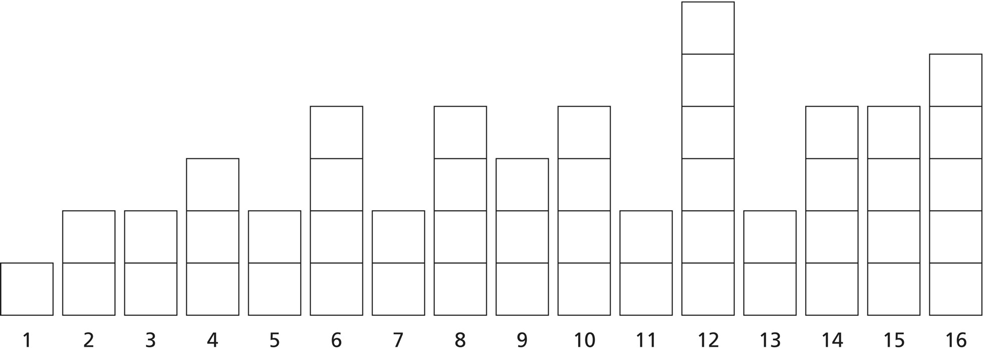
 Number Mystery Line Plot
Generalizing Strategy
Snapshot

We explore generalizing strategies by playing the game Pennies and Paperclips and developing statements about how players can win.
Agenda
| Activity | Time | Description/Prompt | Materials |
| Launch | 10–15 min | Show students how to play Pennies and Paperclips and ensure they understand the rules. |
|
| Play | 20–30 min | Partners play Pennies and Paperclips several times, with each partner getting an opportunity to be the Pennies player and the Paperclips player. |
|
| Explore | 20+ min | Partners develop statements about how Pennies can win and how Paperclips can win. They may test these statements by continuing to play the game. |
|
| Discuss | 15+ min | Discuss students’ conjectures about how Pennies can win and how Paperclips can win. Record students’ ideas on a chart and ask them to provide some evidence. |
|
| Play | 20–30 min | Partners choose one or more conjectures to test by playing the game. For each statement they test, students record the results of their game on the Pennies and Paperclips Evidence sheet. |
|
| Discuss | 20 min | Students discuss the conjectures they explored and offer evidence to support or refute these generalizations. Partners offer any new additional general statements to be added to the chart and evidence to support these. The class considers how much evidence is enough to declare a generalization true. |
|
To the Teacher
This activity is based on one developed by the mathematicians at Discovering the Art of Mathematics, an NSF‐supported project whose goal is to develop approaches to teaching mathematics to liberal arts students at the college level. In their activity, they focus on proof (Fleron, 2013), but here we use the game of Pennies and Paperclips to engage students with generalizing strategy. Because generalization so often focuses on developing abstract and symbolic representations for patterns, students rarely get opportunities to connect the work they do in games with generalizing. Here, we ask students to play a game repeatedly with the goal of developing statements about effective strategies for winning.
As students start to develop ideas about the patterns within the game and how Pennies or Paperclips might win, the statements they make will likely be hesitant. Embrace this first‐draft thinking and their risk‐taking. While we encourage you to press students for reasoning, they are unlikely to yet have enough evidence for their ideas. Ask them questions about what they need to explore in order to gather more evidence or test their initial ideas, and then give them time to go back to the game to do just that. The more that students play, refine their statements, and collect evidence to support or refute them, the closer they move toward generalizing—without ever using symbols. This iterative exploration could take several days or continue as an ongoing exploration after two days of work as a class.
We strongly encourage you to play this game yourself repeatedly, in both the Pennies and Paperclips roles, to see how students will gain insight into the patterns within the game. Gather a few colleagues together and have a Pennies and Paperclips party and see what you discover.
Activity
Launch
Launch the activity by showing students on a document camera how to play Pennies and Paperclips. Be sure students understand the rules of play and how to win. Tell students that today they are going to explore this game and try to learn how Pennies can win and how Paperclips can win.
Play
In partners, students play Pennies and Paperclips several times. Provide pairs of students with the Pennies and Paperclips Game Board sheet, two pennies, and several paperclips. Each partner should get the opportunity to be both Pennies and Paperclips.
Game Directions
- One player is Pennies and the other player is Paperclips. Pennies receives two pennies, and Paperclips receives several paperclips. Place the game board where both players can see and reach it.
- Pennies places two pennies on any two squares on the board.
- Paperclips then tries to cover the rest of the board with paperclips. Each paperclip must be placed across two adjacent squares (squares side by side horizontally or vertically, but not diagonally). Only one paperclip can cover any square. No paperclip can cover a square with a penny on it.

A game of Pennies and Paperclips showing three paperclips placed correctly and two that are incorrect
- Winning: If Paperclips can cover all the remaining squares on the board, then Paperclips wins. If Paperclips cannot cover all the remaining squares, then Pennies wins.

In this game, Pennies wins, because Paperclips did not cover all the squares.

In this game, Paperclips wins, because all squares are covered.
Explore
After partners have had a chance to play several times, ask students to try to make some general statements about strategies for winning the game.
- How can Pennies win?
- How can Paperclips win?
Students may want to play the game as they develop these statements to test out their ideas. Ask students to record their ideas so that they are ready to share these with the class.
Discuss
Show a Pennies and Paperclips Game Board sheet on the document camera and have pennies and paperclips handy so that students can show their ideas. Discuss the general statements students can make to describe how Pennies wins and how Paperclips wins. Record these conjectures on a chart and ask students to show some evidence using the materials on the document camera. Students’ ideas at this point are going to be in development and will probably sound like, “We think Pennies wins if . . . ” These statements, along with some evidence—not full proofs—are what we are hoping to generate at this point. If students need more time to play to develop these ideas, send them out to continue work. Students may also present ideas that others disagree with. Celebrate these moments in which ideas and evidence come together.
Play
Ask students to choose and test one or more of the conjectures from the chart you created as a class during the discussion. Students will need to play the game several times with the specific goal of collecting additional evidence that this general statement is true or of finding a counterexample, a case when it does not hold true.
Students should use the Pennies and Paperclips Evidence sheet to record the trial they explored and the outcomes as evidence to share. Students jot at the top of the sheet the conjecture they are testing. Whether they find supporting evidence or a counterexample, each game they try is evidence.
Discuss
Gather students together to discuss each conjecture that students tested, using the following questions:
- What evidence did you find to support this general statement?
- Did anyone find a counterexample—a case when the statement did not hold true?
- Do we now believe that this general statement is true? How might we need to modify the statement?
Discuss any additional general statements students might now be able to add to the chart:
- What new strategies did you develop?
- What statements can we now make about winning the game based on your evidence?
- What are you still wondering?
Students may well want to return to playing the game to continue to test, develop, and refine general statements about winning this game. Encourage students to think carefully about how to make their statements precise and when they can say they are convinced that a statement is true. Ask students to consider, How much evidence is needed?
Look‐Fors
- Are students trying different game‐play strategies systematically? Initially, we invite students simply to play the game. But as the activity progresses, students should be focusing on exploring the conditions that lead to Pennies or Paperclips winning the game. To do so, they will need to think systematically as they consider different types of moves. For instance, they may categorize the initial placement of the pennies by their location relative to each other to investigate what happens when pennies are in the same row or column, when they are diagonal to one another, or neither. They may explore whether the color of the squares matters by asking, What happens when the pennies are on the same color, or on different colors? By thinking in these ways, rather than simply placing the pennies in different positions over and over, students can more systematically explore what might influence winning. Ask, What idea are you exploring now? You might notice something about their board and ask what happens now, such as, “I notice you put your pennies close together. Do you think that matters? Do you think it might help Pennies or Paperclips?”
- How are students gathering evidence? As students begin to develop ideas, they will need to have some evidence to share, even if that evidence begins with a single example. For students to share, they will need to record their thinking somehow so that they can remember precisely the positions of the pennies and paperclips they want to report on. If students are struggling to hold on to their ideas, you may want to offer the Pennies and Paperclips Evidence sheets earlier in the lesson to support them. To push their thinking, after students have an idea and one example that supports it, ask, How can you test this idea with another example?
- Are students looking for counterexamples? When students have ideas, they want to find evidence to support them, but just as valuable are counterexamples. While it may be frustrating for students to find that one of their ideas does not always hold true, you can support them by highlighting the work they did to pursue evidence and discover that something that appeared to be true was, in fact, not. Encourage students to deliberately search for counterexamples by exploring extreme cases, or complex cases where multiple factors intersect. For instance, if students think that having pennies in the same row matters, then ask them to explore whether that is true in cases where the pennies are on the same or different colors or explore whether it matters if that row is at the top or in the middle of the board. Ask, Are there any cases where you’re not sure whether your idea will work? How will you test those?
Reflect
How much evidence do you think you need before you can consider a generalization true?
Reference
- Fleron, J. (2013, October 24). Pennies & paperclip proofs. Retrieved from https://www.artofmathematics.org/blogs/jfleron/pennies‐paperclip‐proofs
Pennies and Paperclips Game Board
Pennies and Paperclips Evidence

Generalizing Visual Patterns
Snapshot

Students investigate generalizing from visual patterns by exploring networks of toothpick squares and the number of toothpicks it takes to construct them.
Agenda
| Activity | Time | Description/Prompt | Materials |
| Launch | 10–15 min | Show the 3 × 3 Toothpick Square image and ask students, Without counting one by one, how many toothpicks do you think there are in this image? Discuss this question as in a number talk, and diagram, color‐code, and record the ways students saw the toothpicks. |
|
| Explore | 30+ min | Partners or small groups construct 2 × 2 and 4 × 4 toothpick squares to investigate the patterns they notice in the number of toothpicks needed. Groups make generalizations about the relationship between the square size and the number of toothpicks needed and present their findings in a chart. |
|
| Discuss | 20 min | Do a gallery walk of groups’ work. Discuss similarities, differences, and connections among the groups’ findings. Discuss the evidence for the generalizations the class has made and how these generalizations might help predict the number of toothpicks needed for larger squares. | |
| Extend | 60+ min | Students investigate how their generalizations change if the growing pattern changes. Select a new growing pattern or invite students to devise their own to investigate. | Make available: toothpicks, dot paper (see appendix), colors, and tape |
To the Teacher
In this activity, we explore a classic problem about toothpick squares to invite students to make generalizations from a visual pattern. The standards relating to generalization in sixth grade focus on representing these relationships symbolically. While students may do that in this activity, particularly as they construct expressions to represent how they saw the number of toothpicks, they will also likely represent their generalization using diagrams, color coding, and words. We value all of these forms and believe that in building connections between them all, students have a more robust understanding of what it means to generalize, why it might be useful, and the many times they engage in this kind of mathematical thinking in the real world already.
The extension for this activity provides an interesting twist on this classic problem by asking students to compare their generalizations about toothpick squares to other growing patterns of toothpicks. These are not frequently explored, and students may discover intriguing ways that their understanding of toothpick squares is applicable to or in conflict with the growing patterns of toothpicks in other arrangements. You could conceivably spend multiple days investigating and comparing these different patterns and designing your own.
Activity
Launch
Launch the activity by showing students the 3 × 3 Toothpick Square image. Tell students that this is a square made out of toothpicks. Ask students, Without counting one by one, how many toothpicks do you think there are in this image? Give students a few moments to think, and ask students to give a private signal, such as a thumbs‐up, when they have an answer, as one would in a number talk.
Invite students to share their answers and defend them by describing how they saw how many toothpicks make up the square. Color‐code or mark up the different ways students saw the toothpicks and decomposed the image. Record any calculations student did, using expressions to show the complexity of students’ thinking. For instance, if students saw four columns of three vertical toothpicks each and then three columns of four horizontal toothpicks each, you might record this as (4 × 3) + (3 × 4).
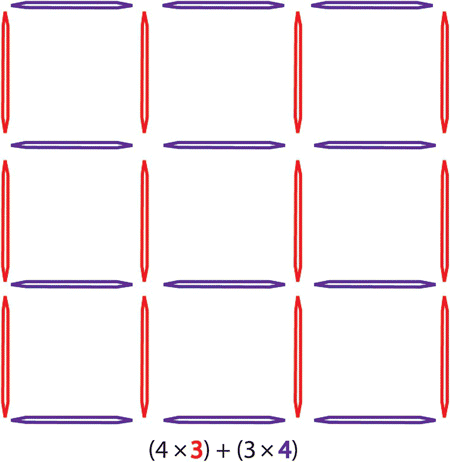
Come to agreement about how many toothpicks make up this image, and draw attention to the many different ways students saw the number of toothpicks.
Explore
In partners or small groups, students construct 2 × 2 and 4 × 4 toothpick squares, which represent those that come immediately before and after the 3 × 3 square in a growing sequence of toothpick squares. Provide students with toothpicks, dot paper (see appendix), colors or markers, tape, and a chart. Students investigate the following questions:
- How many toothpicks are needed to build each square?
- What patterns do you notice in the squares that help you figure this out without counting one by one?
- What general statements can you make about the number of toothpicks needed to build squares? Build as many more squares as you want in order to investigate and test your generalizations.
- How can your generalizations predict how many toothpicks would be needed to build any size square? Test your ideas by predicting the number of toothpicks in a larger square and then building it to see whether your prediction was accurate.
Each group constructs a chart to share what they have found and the generalizations they can make using their evidence.
Discuss
Ask groups to post their charts around the room, and hold a gallery walk. Ask students to consider the following questions as they compare charts:
- How are the different groups’ findings similar or different?
- Do you notice any connections between the strategies different groups used?
- What does the class seem to agree on? What needs further investigation?
Discuss the observations that students made during the gallery walk, including the similarities, differences, and connections they observed. Discuss the following questions as a class:
- What generalizations do we feel confident in based on our data? Which generalizations need more evidence?
- How could we use our generalizations to predict how many toothpicks would be needed to build a square of any size?
Extend
Alter the growing pattern for the toothpick shape and invite students to investigate how the generalizations they can make will change or remain the same. Students could investigate any of the following:
- Rectangles where the length is one more than the width: 1 × 2, 2 × 3, 3 × 4, 4 × 5, . . .
- Staircase patterns of toothpicks, which add one more step as they grow
- Pyramid patterns that add one new layer as they grow
- Another growing pattern that students devise themselves
Look‐Fors
- How are students decomposing the toothpick squares to see structure? While students can count these toothpicks one by one, doing so will obscure the structures that hold the toothpick squares together. As students construct, draw, and analyze other sizes of toothpick squares, watch how they find the number of toothpicks. Ask, What patterns in the square are you noticing? How are they constructed? How could this help you determine how many toothpicks a square is composed of? Extend these observations by asking, How do these patterns change when the square grows or shrinks? Students may, for example, decompose the square into vertical and horizontal toothpicks. You may want to ask, How are these related? What happens to the number of vertical toothpicks when the square grows? What about the horizontal toothpicks?
- What connections are students making between the visual pattern, number, and symbolic representations? One opportunity in this activity is for students to connect multiple representations of patterns to move toward generalizing. Ask students to show you the ways they are decomposing, diagramming, or color‐coding their visual images of the toothpick squares. Ask students how they would describe these patterns, and then how they could represent these patterns with numbers or symbols. If students use numbers or symbols, ask questions about how these connect back to the images they have constructed. They may want to color‐code their expressions to match the color‐coded diagram, for instance, to make those connections clear.
- Are students’ generalizations general? Students’ observations about growth are likely to begin as quite specific. For instance, they may say that the 2 × 2 toothpick square has half the toothpicks of the 3 × 3 square. Such observations may be true, but they are not yet generally applicable to all cases. When students make observations about the changes in the numbers of toothpicks overall or in rows and columns, ask them, Do you think this will be true for all cases, or just in this case? How could you find out? Push students to notice and test iteratively to move progressively toward general statements. You might ask them why they think this relationship exists by saying, What is happening in the toothpick square that is leading to that change? The structures that underlie differences are where students are most likely to make general statements that hold true across cases.
Reflect
When do you think generalizations are useful? Why?
3 × 3 Toothpick Square
