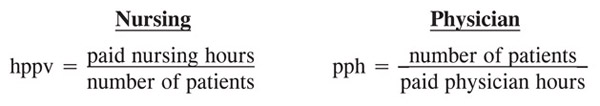
ED overcrowding is as much related to lack of bed availability due to nursing staff shortages as any other factor, both within the ED proper and the hospital wards. There are objective nursing staffing ratios utilized, as well as those for physicians. The nursing staff ratio is measured as hours of care delivered per patient (hppv), which is the converse of the physician strategy, defined as patients seen per hour (pph) (Figure 20). The nurses are expected to provide 2.26 average (range of 0.6 – 4.6) hours of care per patient.1 This approach can be at times difficult to understand and associated with much greater variability than the physician staffing model.2, 3, 4 However, the AAEM suggests a 1.25 – 1.30 nursing pph staffing ratio.5
Figure 20. ED Staffing Estimates
Another modification of this staffing model incorporates the facility volume in nursing service (RN/technician/clerical staff) hours worked per unit. ED visits in the small facilities (< 24,000) require 2.16 hppv, moderate facilities (24 – 48,000) require 2.37 hppv, and large facilities (48 – 72,000) require a 2.66 hppv staffing ratio2 (Figure 21).
Figure 21. Nursing Service Efficiency Based on Patient Volume
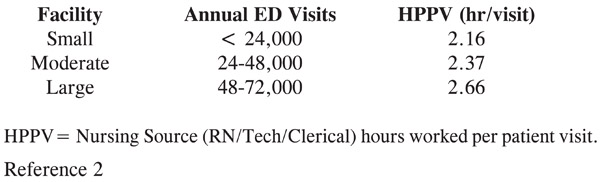
Unlike physician staffing, nursing staffing sometimes becomes less efficient as the facility size increases. This may be due to the increasing complexity of the patient mix encountered in larger facilities.
The simplest approach is to utilize the nurse-to-patient ratio of 1 nurse to 4.5 (range of 3.0 – 6.0) patients in the ED.6, 7 The lower end of the range is activated with more critically ill patients cared for. Typical recommendations include a 1:1 ratio for trauma, 1:2 for critical care, and a 1:4 ratio for ED patients8, 9 (Figure 22). However, some facilities utilize a 1:6 ratio in non-peak times, usually in the early morning hours (12 am – 6 am).
Figure 22. Nurse-to-Patient Staffing Ratio
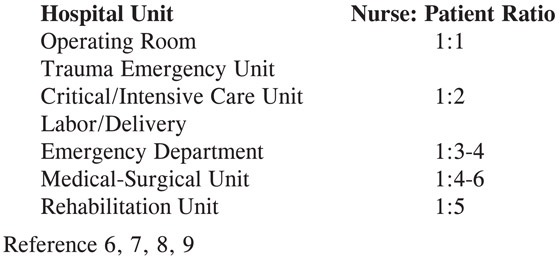
In fact, some states—California being the first—have certified these recommendations through their respective health departments.7 Other states have also mandated that no fewer than two nurses can be present in the ED at any one time to ensure the safety of ED operations.9
Further refinement of these observations from a 120-hospital cohort—classified as community hospitals (51%), teaching hospitals (38%), and rural hospitals (11%)—found that the largest proportion of sites was in the 2.5 – 3.1 hppv staffing range, with the mid-range group at 2.3 – 3.0 for nursing personnel. The indirect hppv was 0.5 (0.8 – 1.1) and there was a mid-range of 0 – 1.9 for non-nursing personnel.10 Inter-institutional comparisons found that the most nursing resources were provided in teaching hospitals (3.0), followed by community hospitals (2.7) and finally rural hospitals (2.4) hppv.
The latest comparison utilized a 1.94 worked hours per visit and 2.09 hppv if nonproductive time is incorporated, as an Emergency Department average.10
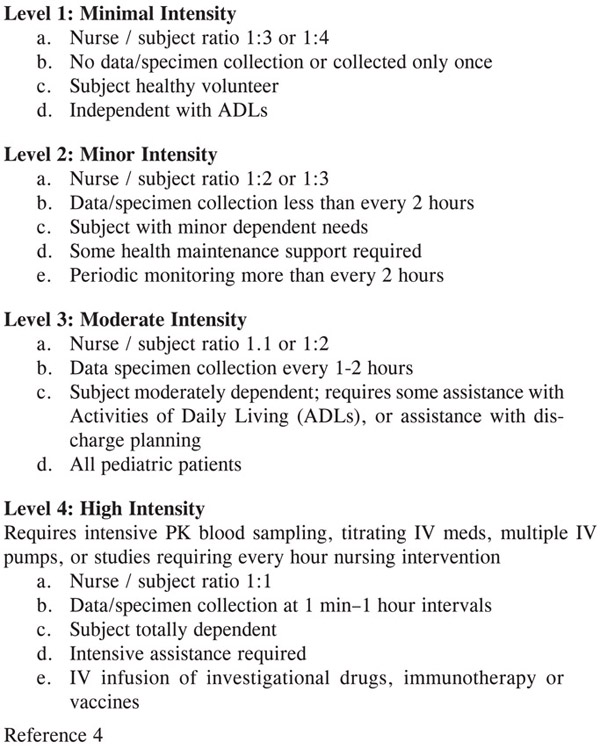
However, it is crucial to recognize that the preeminent ED nursing organization—the Emergency Nurses Association (ENA)—does not accept staffing ratios, nor does it accept productivity output ratios as discussed.3 The ENA position statement suggests that it “opposes mandated staffing ratios or other unilateral methods for determining nurse staffing in the ED.” Best practice staffing must account for six key variables, as well as the sheer number of patients encountered3, 4 (Figure 23). This organization thinks that these approaches fail to account for variation in patient acuity, length of stay, and individual staff capability, but can be modified by an inpatient care intensity rating3, 11 (Figure 24).
Figure 23. ENA Staffing Guidelines
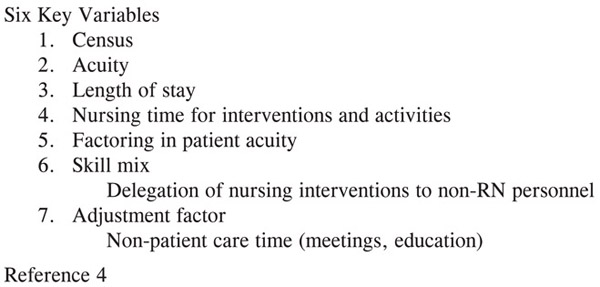
Figure 24. Inpatient Intensity Rating
The newest approach quantifies nursing functional output as nursing hours per patient per day. This output utilizes a combination of Registered Nurses (RNs), Licensed Practical Nurses (LPNs), and Certified Nurse’s Aides (CNAs). The Iowa Intervention Project recommended a mix of 86.1% RN and 13.9% non-RN staff to be involved in the patient care event.12
Currently, the most common method is to calculate the “hours per patient visit” or HPPV. The HPPV is the number of nursing hours divided by the number of ED visits. The ENA cited this approach as problematic for failing to differentiate the acuity and complexity of the patient mix. They discuss an inpatient intensity rating (1-4) blending staffing ratio and the work product required.12 The basic ratio is 1.0 – 5.0 hours per patient volume per day, ranging from maximal to least efficient with most facilities performing in the 2.0 – 4.0 range.3, 12
The ENA offers a computer-based staffing tool incorporating six factors—patient census, acuity, length of stay, nursing time, skill mix, and the incorporation of nonpatient care time such as break time or education.4 They also offer a “minimum staffing” model for the 24-hour-aday “smallest” ED operation to include 11 RN FTEs and 2 nonpatient care FTEs, for a total of 13.0 FTEs.4
A random analysis of an ENA testing sample of 10 ED sites was offered. The volume ranges from 12,000 to 64,000 annual visits with hours of coverage per patient from 1.82 – 4.69 with an average of 3.2 hours/patient/day in 2004.4
The interesting paradox is that decreased staffing is associated with worsened patient outcome, poor job satisfaction, and prolonged length of stay as hours of nursing coverage decrease.11, 13
The definitive study in the master was performed by Needleman, who found an association between hospital staffing by nurses and select adverse patient outcomes.14 They found a total of 11.4 hours of nursing care provided per day with RNs providing two thirds of the care and LPNs/aides providing one third of the care. There was a direct correlation between an increase in RN hours from the 25th to the 75th percentile, which was associated with a 2.5% decrease in length of hospital stay and a 2.9% reduction in various morbidities, such as development of UTIs and GI bleed.
Understanding the dichotomous nature of the physician and nursing ED staffing models, the physician groups have embraced staffing ratios expressed as patients seen per hour per physician (pph) to some degree, while nursing has not endorsed staffing ratios represented as hours of care per patient per day (hppv), suggesting subtleties of patient complexity overwhelm simple numerical relationships.
The factor most widely associated with staff shortages, high turnover and poor employee morale is the perceived lack of support for those in the trenches; this is predictably followed by worsened patient satisfaction. In fact, there is often a paradoxical effect offered by sophisticated educational and career advancement programs. These ladder educational progression programs may accentuate the perceived difference between the caregivers and leaders.
1. Cavorous, C.A., Suby, C. “Results of the 2004 Annual survey of hours: Part 1.” Journal of Clinical Systems Management 2005; 7 – 11.
2. Benchmark ED Staffing Ratios Based on Facility Size. VHA Database, 2001.
3. ENA, Staffing in the emergency department: An issue brief for ENA members. Des Plaines, Illinois. October 4, 2004; 1 – 4.
4. Ray, C.E., Jagim, M., Agnew, J., McKay, J.I., Sheehy, S. “ENA’s new guidelines for determining emergency department nurse staffing.” Journal of Emergency Nursing 2003; 29(3): 245 – 253.
5. American Academy of Emergency Medicine: Emergency nurse-to-patient ED staffing ratios. AAEM Board of Directors. February 22, 2001.
6. Landro, L. “Why Quota for Nurses Isn’t Cure-All.” The Informed Patient. Wall Street Journal. Dec. 13, 2006.
7. Minimum Nurse Staffing Recommendations. California AB 394. January 1, 2001.
8. Wilson, M.E., Howard, P.K. “ENA Letter to State Leader for Referencing Nursing Staffing Ratios.” Dec. 10, 2004.
9. Nursing Staffing Standards for Patient Safety and Quality Care Act of 2005 (H.R. 1222).
10. Zimmerman, P.G. “Managers Forum: Hours per patient visit.” Journal of Emergency Nursing 2006; 32(1): 84.
11. Stanton, M.W. “Research in action.” Hospital Nurse Staffing and Quality of Care 2004; 14: 1 – 11.
12. Iowa Intervention Project, “Determining Cost of Nursing Interventions: A Beginning.” Nursing Economics 2004; 19: 146 – 60.
13. Cho, S.H., Ketefian, S., Barkauskas, V.H. “The effects of nurse staffing on adverse outcomes, morbidity, mortality, and medical costs.” Nursing Research 2003; 52(2): 71 – 9.
14. Needleman, J., Buerhaus, P., Mattke, S., Stewart, M., Zelevinsky, K. “Nurse-staffing levels and the quality of care in hospitals.” New England Journal of Medicine 2002; 346(22): 1715 – 22.