EIGHT
A Day at the Races

SCATTERED ACROSS THE OCEANS OF SOUTHEAST ASIA live several culturally and linguistically distinct groups of sea nomads who rely on breath-hold diving to obtain their food. One of these is the Bajau people, who live in Indonesia, the Philippines, and Malaysia.1 Another is the Moken people, who inhabit the islands off the west coast of peninsular Thailand and Myanmar.2 Sea nomads learn to swim early in life, sometimes even before they can walk. Women, men, and children all regularly dive for harvesting, with the men doing most of the spearfishing and the women and children gathering most of the mollusks and edible worms. Most often, sea harvesting occurs at depths of fifteen to twenty-five feet, although deeper dives are also undertaken. The average adult sea nomad spends up to five hours per day submerged, the longest of any known breath-hold divers. They do all of this without the aid of wet suits, weights, or breathings aids. While, at present, the Bajau use goggles, the Moken, particularly children, often dive without them (a generation ago, none of the sea nomads used goggles). The Moken and Bajau were practicing breath-hold diving at the time of first contact with European colonizers in the sixteenth century and almost certainly had been doing so for many hundreds of years previously.3
All humans share a set of physiological diving responses with aquatic mammals like sea otters and dolphins. Upon entering the water, heart rate is slowed to reduce oxygen consumption and extend dive time. In addition, blood flow is routed away from organs that can withstand temporary loss of oxygen and toward the organs that need it most: the heart, brain, and active muscles. Finally, the spleen contracts to release about a half cup of red blood cells into circulation, thereby boosting the total oxygen-carrying capacity of the blood. All of these responses work together to extend the period of human breath-hold diving.4
To determine if the sea nomads had become genetically adapted to their particular aquatic lifestyle, Melissa Ilardo and her coworkers from the University of Copenhagen collected DNA samples from Bajau people in the village of Jaya Bakti on the island of Sulawesi. For comparison, they also collected DNA from Saluan people, who live in Koyoan, about fifteen miles away on the same island. The Saluan have little to do with the marine environment and do not engage in breath-hold diving. The researchers also brought along a portable ultrasound machine and used it to measure spleen size in all of their subjects. They found that, on average, Bajau people have larger spleens than Saluan people, and that the increase in spleen size was predicted by variation in a gene called PDE10A. Spleen enlargement provides the Bajau with a larger reserve of red blood cells to inject into the bloodstream during breath-hold diving. In addition, the Bajau tend to carry variants of the gene BDKRB2 that enhance the diving-evoked reduction of heart rate and the diversion of blood flow from the periphery to the core of the body.5
As we all know from opening our eyes underwater, the view in this situation is blurry. Human vision is poorly adapted to the aquatic environment. However, when Moken children were tested for underwater vision, their ability to discern visual detail was about twice as good as age-matched European children—that is, their underwater vision was still blurry but not as blurry as the European kids. There are two ways to produce this partial improvement in underwater vision. One is to constrict the pupil more fully to create greater depth of field, and the other is to warp the lens to better focus the incoming light, a process called ocular accommodation. The eyes of Moken children employ both of these strategies to improve underwater vision.6
To date, no genetic variants have emerged that would explain the increased accommodation or pupillary constriction in Moken people or other sea nomads. In fact, it’s likely that the improved underwater vision in Moken children can be entirely accounted for by practice. After eleven training sessions in a pool, spread over one month, European kids attained the same improved underwater visual acuity as Moken kids. This improvement was still evident when they were tested eight months later.7 The lesson from the sea nomads is clear. Lifestyle and environment can produce evolutionary changes in the genes of local human populations subjected to particular adaptive pressures, as sea harvesting did with selection for spleen size and diving response among the Bajau. But, importantly, as revealed by the case of enhanced underwater vision, just because we see a significant difference in a useful trait in a particular population, that does not mean that there is necessarily a heritable basis for that difference.

MODERN HUMANS AROSE IN Africa about three hundred thousand years ago, and over the past eighty thousand years or so have spread across the world to occupy nearly every type of natural environment. Within the last twelve thousand years, most, but not all, human populations have moved from a hunter-gatherer lifestyle to one dependent on domesticating and raising plants and animals. The challenges of particular human lifestyles and locations have resulted in local selection pressures for certain traits,8 like the enhanced physiological diving responses (but not the improved underwater vision) of the sea nomads.
One of the most notable recent human adaptations accompanied the domestication of cattle, which seems to have occurred separately in Africa and the Middle East about ten thousand years ago. Cattle domestication led to the strong selective pressure to drink and metabolize cow milk in adults. In most humans, the enzyme lactase, which breaks down the milk sugar lactose, decreases after weaning. However, in certain populations that have adopted extensive dairy farming, lactase expression persists into adulthood. Variations in the gene that encodes lactase, conferring persistent lactase expression, arose separately in the Middle East about nine thousand years ago and in Africa about five thousand years ago. Analysis of the DNA from ancient bones indicates that these gene variants spread from the Middle East into Europe only within the last four thousand years.9 This example illustrates some important facts about human adaptation. First, new human traits can emerge rather quickly in evolutionary time: in this case, within a few thousand years. Second, sometimes, two separate human populations undergoing the same selective pressure can have the same type of genetic variant arise independently—in this case, variants influencing the expression of lactase in adulthood. This process is an example of what biologists call “convergent evolution.”
However, in many cases, different populations exposed to the same environmental pressure will see different genetic variants arise. One good example of this process involves groups who live at high altitudes, above eight thousand feet, as in the Semien Mountains of Ethiopia or the high Tibetan plateau. In these environments, it becomes a challenge for the body to supply sufficient oxygen to crucial organs. Yet human populations in each of these high places have thrived in such difficult conditions. Tibetans have accumulated high-altitude-protective variants of genes EGLN1 and EPAS1, while some Semien Mountain dwellers have accumulated variants of different altitude-protective genes, VAV3, ARNT2, and THRB. The names of these genes aren’t important. The point is that the affected genes are different. The challenge of living in a high-altitude, low-oxygen environment can be met with different solutions—different combinations of useful gene variants in different populations.10
High altitude, breath-hold diving, and dairy consumption are just three of a growing list of local pressures for which human adaptive gene variants have been identified in local, well-defined populations. Some of the others include tolerance for dietary arsenic in people living in a particular region of Argentina, for malaria in many people of Central Africa, the Mediterranean, and India, for a marine-based diet in the native people of Greenland and Canada, and for cold temperature in native Siberians. It’s a short list, but one that’s growing longer all the time as more population-genetics research is conducted.
The local human adaptations I’ve mentioned so far involve variants in one or a small number of genes. But can local human adaptions also impact polygenic traits like height, which is about 85 percent heritable in Europeans and to which hundreds of genes contribute?11 Here, the answer remains unclear. On average, northern Europeans are taller than southern Europeans. When 139 known height-influencing genes were compared in groups of northern and southern Europeans, it was found that frequencies of the height-promoting variants of these genes were consistently higher among the northerners.12 A related study of Britons showed that many weakly acting height-promoting gene variants have been under strong selective pressure in the last two thousand years. Similar signatures of recent selection were found for increased newborn head circumference, female hip size (presumably to accommodate the larger infant heads during childbirth), fasting insulin levels, and several other polygenic traits.13 However, in 2019, two different groups published papers calling into question the strength of the result supporting polygenic adaptation for height in Europe. With a larger and less stratified population sample, the effect was greatly reduced.14 At present, it seems that there is polygenic adaptation for height among Europeans, but that it is a weak effect. This is an active area of investigation and this result may change further as still better sampling and statistical methods are brought to bear.
You’ll note that, at present, there are no behavioral or cognitive traits on the list of local, recent human adaptations. Nearly all behavioral and cognitive traits in adults have a heritable component—usually in the ballpark of 50 percent—that almost always involves the small contribution of many genes.15 Polygenic behavioral and cognitive traits could, in theory, be subject to local selective pressure in various populations, leading to partially heritable average population differences. But, as of this writing, there is no good evidence that this has been the case.
These examples of local, recent human genetic adaptation have now been mostly subjected to at least one round of replication and challenge from other investigators and, on the whole, they have survived quite well. Specific claims may be modified or invalidated by work to come, but the overall trend is undeniable: there are significant average genetic differences across local populations in a range of physical traits. The adaptive traits can involve changes in either a small number or a large number of genes and, at least in some cases, can emerge over a few thousand years.
Describing these results, which now fall squarely within the mainstream of thought in population genetics, is enough to get one branded as a racist in many quarters. To some well-meaning critics, such endeavors are to be condemned because they have been used by others to support racist genetic arguments. In their view, even if scientists who conduct such work have good intentions (say, to more effectively guide medical treatment decisions), reporting genetic differences underlying traits across local populations is situated on a slippery slope that is so laden with historical malfeasance that the project is better abandoned. To them, words like “population” and “ancestry” are just a politically correct construction to allow one to talk about race. For example, Angela Saini, commenting on the recent Human Genome Diversity Project, wrote, “The word ‘race’ had been prudently replaced by ‘population’ and ‘racial difference’ by ‘human variation’ but didn’t it look suspiciously like the same old creature?”16
I am entirely sympathetic to these concerns. There’s no question that the science of human variation has been and continues to be misused to rationalize racial bigotry around the world. Perversions of science, particularly population genetics, have been used to justify, either contemporaneously or retroactively, the Atlantic slave trade, the Jewish Holocaust, the genocide of Tutsi people in Rwanda, the stealing of land by colonial powers, and the systematic legal oppression of African Americans after emancipation. Sadly, this list goes on and on. Over the years, some of the leading scientists in the study of human differences—from Francis Galton, popularizer of the expression “nature versus nurture,” to James Watson, codiscoverer of the structure of DNA—have actively promoted racist pseudoscientific ideas. Today’s racists, from white supremacists in the United States to certain Hindu nationalists in India, all rely, at least in part, on arguments ostensibly based on population genetics to support their bigotry and policies of racial oppression.
So why not just be done with politically fraught investigations of genetic differences between populations and stick to the study of individual differences instead? In my view, population genetics is a valid area of inquiry that legitimately helps us understand human evolution and can more effectively guide medical care. But perhaps the most important reason not to throw the baby out with the bathwater is that the full weight of scientific investigation, including population genetics, is and will continue to be required to refute racist pseudoscientific arguments. These arguments are not going away, and they must be met with data, not mere assertion and certainly not by declaring the whole area of investigation out of bounds. The emerging results from population genetics are, and will continue to be, required to refute its own racist history.
WHAT ARE THE PRINCIPLES of so-called scientific racism? A version popular with white supremacists boils down to this:
1. There are broad, continent-based categories—like Europeans, Asians, and Africans—that reflect the clear division of humanity into a small number of biologically distinct racial groups. These racial groups have remained fixed and unblended for tens of thousands of years, allowing genetic differences to accrue.
2. The varying environments corresponding to these broad racial categories have imposed different selective pressures. In one popular racist telling, the African environment has selected for high sex drive, high violence, and low intelligence, and the people of Asia have been selected for low libido and high intelligence but low morals. The peoples of Europe, particularly northern Europe, have been selected to be just right: a happy medium, thereby justifying their role as colonizers and their resistance to immigration.
3. As a result of points 1 and 2, one can predict average human behavioral and cognitive traits based on these broad racial categories. Racial traits are heritable and immutable, and so will be deeply resistant to any social intervention, thereby excusing ongoing oppression and denial of educational and economic opportunity to broadly defined “racial” groups.
Of course, pseudoscientific racists never make arguments to denigrate and justify the ongoing oppression of their own self-defined racial group. Funny how that works out. In some cases, such arguments have been used to explain a positive trait in another group, but always with a negative caveat. For example, a common pseudoscientific white-supremacist argument holds that Jews, as a result of being denied land ownership for many generations, gravitate to more quantitative, urban occupations like moneylending and shopkeeping. In this story, the ban on Jewish land ownership created selective pressure for evolved intelligence, but also instilled a devious, amoral character. Similar fake evolutionary stories are told about East Asians and work habits, or Africans and athletic prowess.17
LET’S EXAMINE THE CORE claims of pseudoscientific racism to see how they hold up. First up is this contention:
There are broad, continent-based categories—like Europeans, Asians, and Africans—that reflect the clear division of humanity into a small number of biologically distinct racial groups.
If you live in the United States, you are required to fill out a form every ten years at the time of the national census. On this form, you are asked to tick one or more boxes to identify your race. Today, the choices are:
Black or African American: A person having origins in any of the Black racial groups of Africa.
American Indian or Alaska Native: A person having origins in any of the original peoples of North and South America (including Central America) and who maintains tribal affiliation or community attachment.
White: A person having origins in any of the original peoples of Europe, the Middle East, or North Africa.
Asian: A person having origins in any of the original peoples of the Far East, Southeast Asia, or the Indian subcontinent including, for example, Cambodia, China, India, Japan, Korea, Malaysia, Pakistan, the Philippine Islands, Thailand, and Vietnam.
Native Hawaiian or Other Pacific Islander: A person having origins in any of the original peoples of Hawaii, Guam, Samoa, or other Pacific Islands.
The instructions go on to clarify that “people who identify their origin as Hispanic, Latino, or Spanish may be of any race.”18 If you are filling out a similar form in the United Kingdom, the categories are different. The tick boxes used in 1991 were White, Black-Caribbean, Black-African, Black-Other, Indian, Pakistani, Bangladeshi, Chinese, and Any Other Ethnic Group. In the Brazilian census, you must pick a single racial category from a list consisting of Branca (white), Parda (brown, meaning multiracial), Preta (black), Amarela (yellow, Asian) or Indígena (indigenous). These lists of terms don’t capture cultural differences in how the categories are used. For example, in the United States, people who would self-categorize as black have, on average, 80 percent West African and 20 percent European ancestry (of course, these are just averages). In Brazil, most people who identify as preta have nearly entirely West African ancestry. Most people who self-identify as black in the United States would call themselves parda if they lived in Brazil. Furthermore, people in Brazil with nearly entirely West African ancestry are more likely to identify as preta if they are poor but parda if they are more affluent.
The key point here is that racial categories are socially and culturally constructed. They are vague, changeable, and vary from place to place and culture to culture, reflecting local history and politics, in particular the legacy of colonialism. It’s not a coincidence, for example, that the UK census distinguishes people with ancestry from India, Pakistan, and Bangladesh, reflecting British colonial history in that part of the world, while the US and Brazilian censuses lump them all in the general category of Asian. Some of the categories are based on present-day nations, others on continents. If we move away from government census forms and into the street, people around the world readily make racial classifications based on still more criteria, like language (Hispanic) or religion (Muslim, Jewish, Hindu, etc.) And, importantly, these categories can vary, even within the same country or community. To the US government and most people on the street, I’m white. But to the white supremacists on the internet, I’m decidedly not, due to my disqualifying Ashkenazi Jewish ancestry. Around the world, in every place or culture, racial classifications exist, and they are inherently ideological, economic, and political. Any scientific study involving race must accept and engage with this fact.
It’s not that racial categories don’t exist, as some well-meaning, idealistic people would claim. Rather, it’s that racial categories are not biological. They are not taxonomic subdivisions of the human species. And they are not, as some would contend, analogous to purposefully created and maintained breeds of domesticated cat or dog,19 or, for that matter, like Trut and Belyaev’s tame foxes. Rather, racial categories are cultural-biological categories. They are the collision of biological human differences and the local and changing cultural decisions about what kinds of differences are important.
The fact that race is not a biological phenomenon does not make it unworthy of study. After all, education, money, social class, and reputation are all unnatural phenomena, yet we understand their importance to human lives. Anthropologist Jonathan Marks nicely unpacks the implications of ignoring race when he writes,
We ought to be leery, then, of the statement “race doesn’t exist” simply because race doesn’t exist as a unit of nature, or biology, or genetics. For if the only reality we acknowledge is nature, what do we make of political or social or economic inequality? Those are real facts of history and society, rather than facts of nature. Do they suddenly vanish, then? If we synonymize the non-natural with the unreal, then poverty becomes not a problem to be solved, but a phantom to be ignored.20
IF THERE REALLY ARE genetic differences that correspond to broad, culturally defined racial groups and underlie average differences in traits, then we should be able to see them reflected in the analysis of many individual genomes. Richard Lewontin sought to address this question in 1972, years before the analysis of human DNA was possible.21 He examined variation in blood proteins in many people around the world, whom he grouped into seven invented “races”: Africans, West Eurasians, East Asians, South Asians, indigenous Australians, Native Americans, and Oceanians. He found that about 85 percent of the variation in protein types could be ascribed to variation within his seven races, and only 15 percent by variation between them. His conclusion in this paper is often quoted: “Races and populations are remarkably similar to each other, with the largest part by far of human variation being accounted for by the differences between individuals.… Since [such] racial classification is now seen to be of virtually no genetic or taxonomic significance either, no justification can be offered for its continuance.”22
When Lewontin’s finding was published, many argued that this was proof that racial categories were biologically meaningless. Yet this was cognitively dissonant for most people. If race is biologically meaningless, then how can we look at someone’s headshot photo (without information about their voice or clothing or mannerisms) and assign them to a broad category of ancestry with reasonable, albeit not total, accuracy? Clearly, we can make these guesses based on a few external traits like skin color, facial features, eye color, and hair color and texture. Overall, most variation in traits is within races rather than between races, but clearly there are a handful of external traits, the combination of which can help inform our broad estimates of an individual’s ancestry.
In Lewontin’s day, it was not possible to scan many locations in the human genome for variation. Thirty years later, in 2002, Marcus Feldman and his colleagues revisited this question. They analyzed 377 variable locations in the genomes of 1,056 individuals from around the world and replicated Lewontin’s basic finding: for the vast majority of individual locations in the genome, it is impossible to identify genetic variants to distinguish one broad race from another, because there is, on average, much more genetic variation within these racial groups than between them. However, when variation at all 377 locations in the genome was analyzed together with multivariate Bayesian statistics, and a computer program was instructed to group the data into five clusters, the groups that emerged were roughly consistent with some popular broad categories of race in the United States: African, East Asian, European, Oceanian, and Native American.23
The publication of this study and a few others that followed generated a lot of controversy. Some said that it reinforced the notion that broad racial categories are biologically true and enduring taxonomic divisions of the human species. This is incorrect. First, there’s nothing magic about those five populations. The number five was generated by the experimenters, not the data. In fact, it has been argued that, with a better sampling of African DNA, a division into fourteen populations is more accurate.24 What these types of studies show is actually rather intuitive: people are more likely to mate with those who are nearby as opposed to those who are far away, and the probability of mating is gradually reduced with distance. In addition, it shows that large geographic barriers like oceans or the Sahara desert have been impediments to mating. Where those barriers are porous, more interbreeding occurs and the population clusters, as defined by genetic markers, blur at the margins.25 Racial categories are not biological categories, but neither are they completely arbitrary cultural constructions. They are dynamic, culturally created categories that are based on a very small subset of observable heritable physical traits. Historically, they have been used to denigrate and control millions of people unjustly.
ANOTHER KEY TENET OF pseudoscientific racism is:
Racial groups have remained fixed and unblended for tens of thousands of years.
This assertion was a pillar of Nazi ideology, which claimed unmixed descent from the Corded Ware culture, named for the style of their five-thousand-year-old pottery retrieved from archeological sites. In the Nazi mythology, the Corded Ware people were early Aryans with deep roots in Germany. The Nazis further argued that because Corded Ware pottery was found in archeological sites in Poland, western Russia, and Czechoslovakia, that the Germans had an ancient claim on those lands. A similar myth underlies certain strains of Hindu nationalist ideology, which holds that, over many thousands of years, there has been no substantial contribution to Indian bloodlines or culture from people outside of South Asia.
The newest findings, which analyze DNA from ancient human remains and compare them to modern populations, provide a definitive rebuke to these claims of racial purity.26 In the case of the Corded Ware culture, the ancient DNA clearly shows that they mostly derive from a mass migration of Yamnaya people from the steppes of present-day Russia and Central Asia about five thousand years ago. Suck on that, Nazis.
Likewise, the ancestry of modern-day Indians, even in south India, was formed in large part by several waves of mass migration from present-day Iran and the Eurasian steppe. In fact, about 50 percent of the genetic variation found in today’s Indians derives from these migrations, which started about five thousand years ago. All over the world, nearly every population alive today is the product of repeated mixing over many thousands of years. As geneticist David Reich writes, “The story that is emerging differs from the one we learned as children, or from popular culture. It is full of surprises: massive mixtures of differentiated populations; sweeping population replacements and expansions; and population divisions in prehistoric times that did not fall along the same lines as population differences that exist today.”27 The analysis of ancient DNA shows definitively that there is no mythical racial purity. People in the United States who self-identify as white on the census are a mixture of at least four ancient populations that thrived about ten thousand years ago. Those ancient populations were as different from one another as East Asians and Europeans are now. In other words, we’re all mutts.
But we’re not exactly the same type of mutt. These days, you can spit in a tube, mail it off with $99, and get back a report saying that your ancestry is, for example, 33 percent Welsh, 42 percent Turkish, 20 percent Swedish, and 5 percent Greek. Or you might learn that you descend from 85 percent West African, 10 percent English, and 5 percent French ancestors. What’s important to realize about these estimates of your ancestry—and they are only rough estimates—is that the categories are chosen to be culturally meaningful to present-day people.28 They look back to an arbitrary time about five hundred years ago, before European colonialism got fully underway, thereby precipitating some of the more recent waves of genetic mixing. The direct-to-consumer ancestry companies could generate a genetic report using the categories of about three thousand years ago that might say that your ancestry is, for example, 45 percent Hittite and 55 percent Oxus, but that wouldn’t be very appealing to most of their customers. Or they could go back two hundred thousand years and tell everyone that their ancestry is African. In fact, I’ll tell you that for free. You don’t even need to spit in a tube.
LET’S CONTINUE OUR EXAMINATION of the racist pseudoscientific argument.
The varying environments corresponding to these broad racial categories have imposed different selective pressures.… The African environment has selected for high sex drive, high violence, and low intelligence, and the people of Asia have been selected for low libido and high intelligence but low morals. The peoples of Europe, particularly northern Europe, have been selected to be just right.
One of the hallmarks of racial categories is that they are broad: white, black, Asian, and so on. We talked about some examples of recent human adaptations to environmental conditions like high altitude, cold temperatures, and a marine-based diet. Crucially, these are local environmental conditions. When people speak of races, they are generally not talking about present-day local populations like the indigenous Siberians, who must contend with extreme cold, or the Bajau of Sulawesi, who have adapted to extended breath-hold diving. There is no specific “environment of Asia” to adapt to because, of course, Asia includes high mountains, deserts, boreal forests, beaches, tundra, grasslands, and tropical rainforests. The same holds true of the other continent-wide racial terms that are so popular. If you hold, as many racists do, that it has been so easy to obtain food and shelter in Africa that the selective pressure to be clever is much smaller than it is in Europe, then you must imagine that this pertains to all of the various local environments of Africa, or even just sub-Saharan Africa—from tropical forests to high mountains to desserts—and, in the same way, it must pertain to all the various local environments of Europe.
Even when you get down to racial categories based on present-day nations, the same problem exists. What are the unique selective pressures of the Chinese environment? Of course there aren’t any, because China is composed of many distinct environments and lifestyles. The situation is even sillier when some linguistically based racial terms are used. What is the natural environment of the Hispanics? There isn’t even a single continent of Hispanics! As a result, it’s hard to imagine a scenario in which local selective pressures could drive average genetic changes in Hispanics as a group. Arguments that imagine different selective pressures on broad racial groups to produce different cognitive or behavioral traits do not withstand even the most cursory scrutiny.
THERE IS ALMOST NO topic that is more contentious, either in terms of individuals or populations, than intelligence. But what is it? Psychologist Linda Gottfredson of the University of Delaware has provided a useful definition:29
[Intelligence]… involves the ability to reason, plan, solve problems, think abstractly, comprehend complex ideas, learn quickly and learn from experience. It is not merely book learning, a narrow academic skill or test-taking smarts. Rather, it reflects a broader and deeper capability for comprehending our surroundings—“catching on” “making sense” of things or “figuring out” what to do.
Some psychologists break intelligence down into sub-domains, like crystallized intelligence (a person’s store of knowledge about the world, including both facts and procedures) and fluid intelligence (an ability to solve novel problems that relies minimally on stored knowledge). These are domains that various intelligence tests seek to measure, and that are sometimes expressed as an IQ score.
There are some who believe that intelligence tests are meaningless, but the weight of evidence is against this view. These tests are far from perfect, and some of them have aspects that are culture-bound. But around the world and across economic circumstance, they are reasonable predictors of success in school, advancement in the workforce, and even lifespan.30 An IQ test score does not reflect everything that one would like to know about human intelligence, but in truth no measure could ever meet such a challenge. There are tests that seek to measure other aspects of cognition, like creativity (the ability to produce unusual solutions to problems or pose novel questions) or practical intelligence. These measures can provide some additional predictive power beyond the more widely used IQ tests, but not that much.
If we examine a histogram for adults in the United States, in which IQ test score is plotted against the likelihood of obtaining that score, we see a roughly bell-shaped distribution, with the average close to one hundred points (IQ tests are calibrated to have the average for large populations fall at that number). In this distribution, about 14 percent of the population has an IQ above 115 and about 2 percent above 130. The falloff on the lower side of the scale has roughly the same shape, but with a second, much smaller bump added, centered at about seventy-five points (figure 17). IQ scores of seventy or below are taken to indicate intellectual disability, which affects about 2 percent of the population in the United States.31
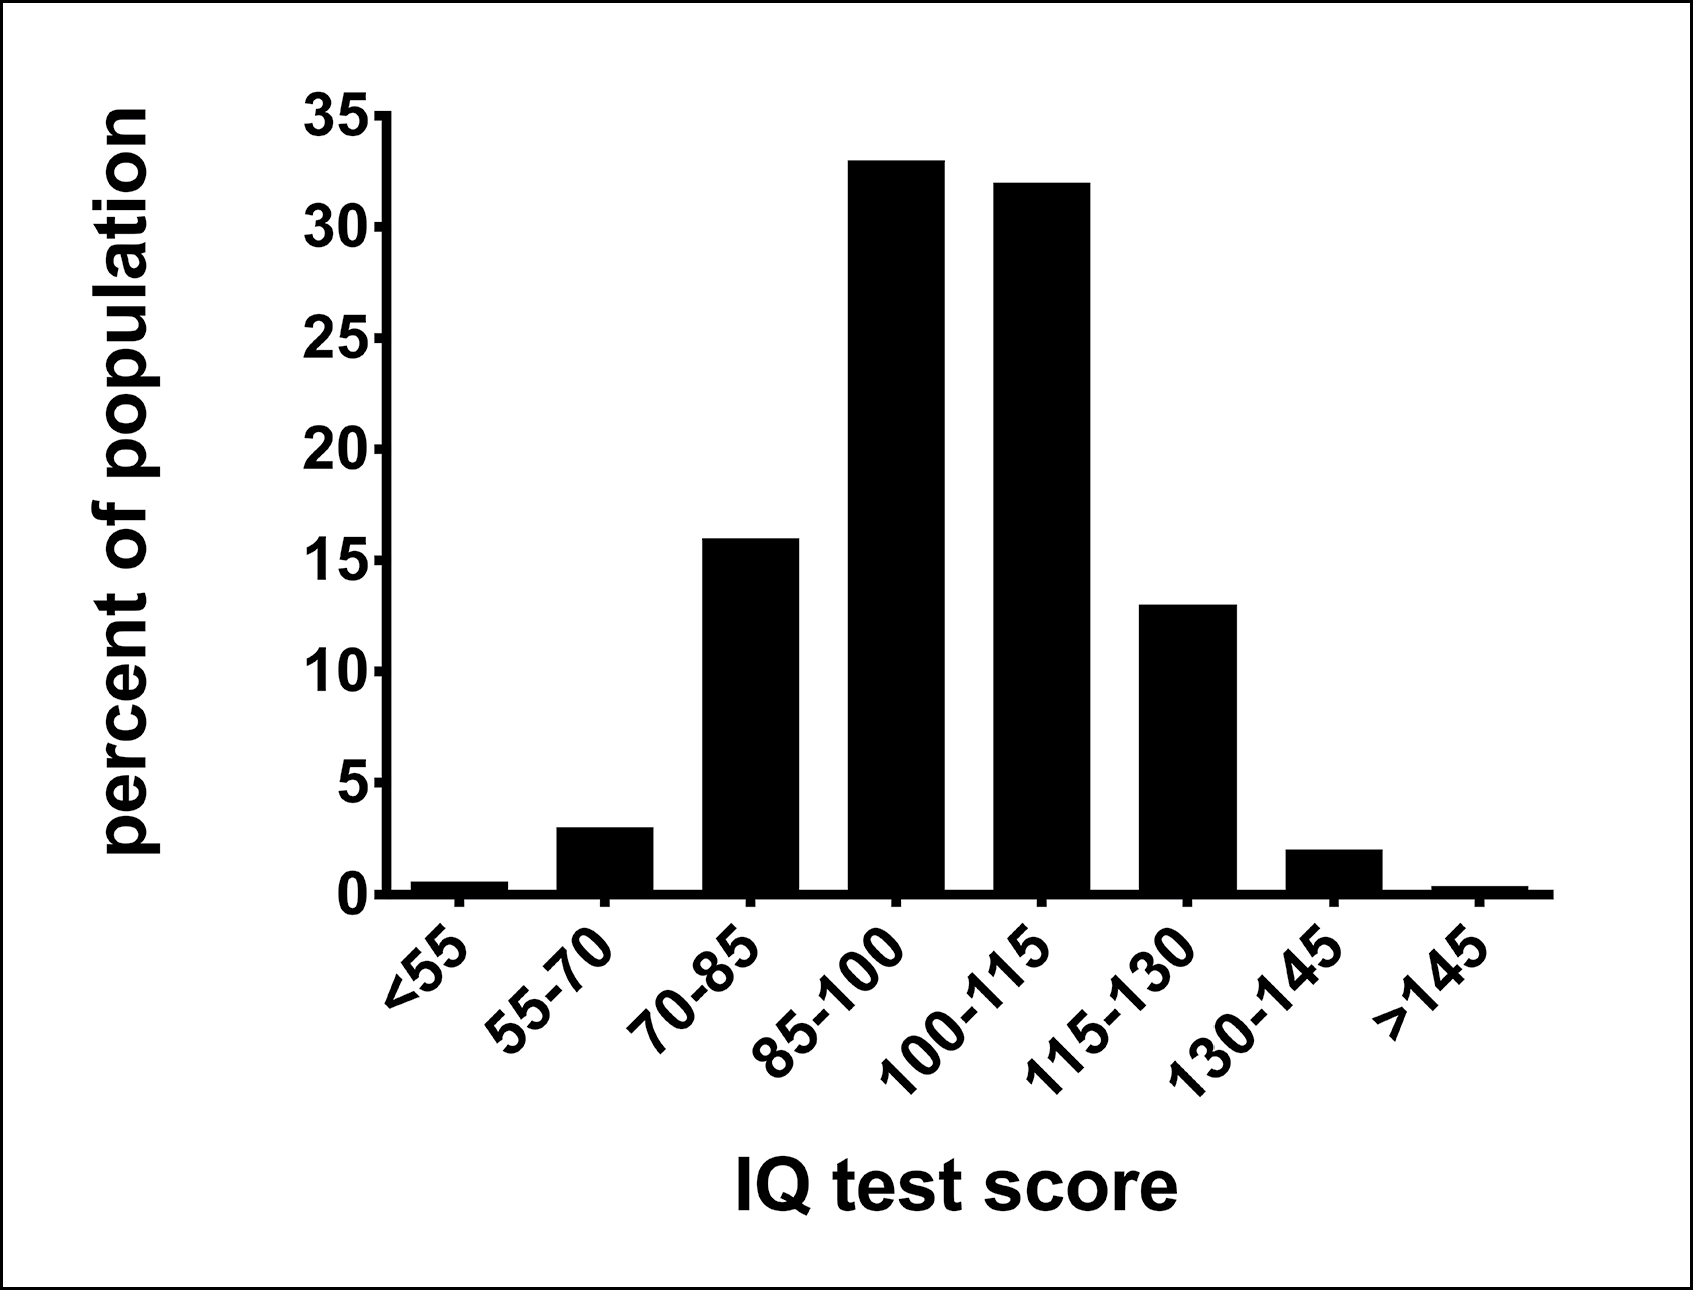
FIGURE 17. A histogram showing the approximate distribution of adult IQ test scores in the United States. The mean score is one hundred points by definition. The distribution is approximately bell-shaped (Gaussian), but with a small extra bump centered at about seventy-five points. This small bump mostly reflects highly deleterious mutations in a limited number of genes involved in brain development and synaptic function that produce intellectual disability.
This distribution is very similar to what one sees for height in the United States. Height is quite heritable (about 85 percent in the MISTRA twin study we discussed in chapter 1) and also a highly polygenic trait, reflecting small variations in hundreds of genes and their interaction, both with the environment and with each other, through summation and more complex processes. However, in a small fraction of the population, there are rare single-gene mutations that can drastically effect height, like those involving the secretion of growth hormone, and can produce dwarfism or some related conditions, resulting in a small added bump at the low end of the height distribution.
The statistics for IQ test scores are very similar. The estimates for the heritable component of IQ in the United States range from about 70 percent (from the MISTRA study) to about 50 percent (using other methods).32 At either end of this range, the conclusion is similar: IQ test scores have a significant heritable component, but a significant nonheritable component as well. Just like every other behavioral or cognitive trait, the heritable component is highly polygenic. As with height, there are a number of mutations in single genes that can have an outsize impact on IQ score. These genes include SYNGAP1, SHANK3, and NLGN4, and they direct the expression of proteins that are involved in the brain’s wiring during early development and its ability to subtly change its electrical and synaptic properties in response to experience across the lifespan. Because mutations in these genes affect the wiring and electrical function of the brain, they often cause other neuropsychiatric problems, like autism or epilepsy, together with intellectual disability.33
IN THE 1960S, TESTS performed on high schoolers in the United Kingdom and the Republic of Ireland revealed that the average IQ score was about fifteen points lower in the Irish. In the years to follow, some academics, including the famous psychologist H. J. Eysenck, asserted that the gap in IQ score was due to genetic differences between the populations of these two nations. Their argument was as follows: From twin studies we know that IQ test score has a significant heritable component among both groups, so the difference between the groups must also be mostly heritable. As a result, there’s no point is trying to improve the average intelligence of the Irish through better health care, nutrition, or schooling, because they will always be genetically intellectually inferior.34
This argument fundamentally misuses estimates of trait heritability. As we have discussed, an estimate of the heritable component of a trait is only valid for the population in which it was studied. If a trait has a heritable component in two different populations, that tells us nothing about the origin of the difference between those populations. For example, body mass index (BMI) is a highly heritable trait in both the United States and France. Average BMI is significantly greater in the United States, but the difference between the Americans and the French is not due to genetic differences between the two populations.35 Rather, it’s because, on average, Americans eat more highly caloric foods (and, to a smaller degree, they exercise less).
If the hypothesis is that the IQ score differences between the Irish and the citizens of the United Kingdom measured in the 1960s are due to genetic differences between the populations, then the main testable prediction would be that these differences should persist over at least a few generations. That prediction has been conclusively falsified. Repeated IQ testing in recent years has revealed that the Irish have improved such that there is no longer a statistically significant difference between them and the people of the United Kingdom.36 While there is no proof that these changes are causally related, it is worthwhile to note that the average standard of living in Ireland has increased dramatically between the 1960s and the present day, with attendant improvements in health care, nutrition, and education.
A second prediction of the genetic hypothesis for population differences in IQ is that the estimate of heritability should be the same for both populations. Recall that 85 percent of the variability in height is accounted for by heritability in the United States, but only 50 percent in rural India or similarly impoverished populations because, due to malnutrition and disease, impoverished people are unable to fulfill their genetic potential for height. To my knowledge, heritability estimates for IQ test scores do not exist for Ireland and the United Kingdom circa 1960, but they have been made in many other circumstances. Several different studies in the United States have shown that the heritability of IQ test score is significantly higher in the middle class than it is in the poor, as well as significantly higher in students with well-educated parents and in people who self-identify as white compared to black.37 These findings argue against the genetic hypothesis for IQ group differences.
Also around 1960, it was reported that in the United States the average IQ test score for self-identified blacks was about fifteen points lower than for self-identified whites. This was about the same gap as was seen for Ireland and the United Kingdom around that time. In fact, many of the same people who asserted a genetic basis for the Irish-UK IQ test gap made and continue to make the same assertion for the black-white gap in the United States. The most prominent was the best-selling book The Bell Curve, by Richard J. Herrnstein and Charles Murray, published in 1994. However, in opposition to this hypothesis, since 1965 the IQ test gap between blacks and whites has narrowed, falling from about fifteen points to about nine points.38 That this gap has not been entirely erased is not surprising, as profound economic and social inequities remain between blacks and whites in the United States.
Beginning in infancy, children in wealthier families are more likely to have social experiences that contribute to their intellectual development. For example, in one study in the United States, the children of parents with professional careers were estimated to have heard thirty million words by the age of three, while the children of working-class parents heard only twenty million words, and those words were drawn from a smaller vocabulary. This study also showed that the children of working-class parents received fewer encouraging comments and more reprimands.39 Similar studies have shown, not surprisingly, that kids from wealthier families have greater access to books, newspapers, and computers.
While it is likely that these social experiences influence children’s intellectual development, it is difficult to know how much of the effect is due to the environment and how much is due to the gene variants that the parents who create these environments pass on to their children. Disentangling these effects requires adoption studies, and their evidence is clear. When children are adopted into homes of higher socioeconomic status, they achieve, on average, a twelve-to-eighteen-point boost in IQ test score, compared with siblings who were not adopted or who were adopted into homes with lower socioeconomic status.40 Of course, the home environment is not the whole story behind this improvement, as families with higher socioeconomic status also tend to benefit from better schools, better health care, and safer, less traumatizing neighborhoods. Nevertheless, these adoption results argue against the claim that social interventions fail to close racial IQ gaps because IQ is mostly genetically determined.
IN MANY WAYS, IQ is much like any other behavioral trait. IQ test score has substantial heritable and nonheritable components, and the balance between the two can vary between populations, becoming more heritable in wealthier populations with more social, economic, and political power. The nonheritable components of IQ include social experiences both within and outside the family, nonsocial experiences like nutrition and infection, and, of course, a dose of randomness from the imprecise, stochastic nature of brain development. While there are some mutations in single genes associated with brain development and plasticity that can produce large cognitive disruptions,41 the heritable component of the variation in IQ over a score of eighty, where most people reside, is highly polygenic.
There are now GWAS investigations seeking to discover gene variants associated with general cognitive function, and they have enrolled sufficient numbers of subjects to achieve reasonable statistical power.42 These studies have assessed general cognitive function with IQ tests or similar instruments biased toward assessment of fluid intelligence. GWAS endeavors, which have enrolled mostly residents of European countries with varying ancestry, have revealed that variation in over one thousand genes contributes to general intelligence. Not surprisingly, these genes tend to be expressed in the brain, and many are related to the development, synaptic function, and electrical activity of the nervous system. Together, variation in all of these identified genes accounts for about 30 percent of the variability in the test scores for the sampled population.
It’s important to reiterate that none of these thousand-plus genes are specialized to confer intelligence. They code for proteins involved in, for example, letting ions flow across the membrane of neurons to create essential electrical signals, or guiding the growing tips of neurons to connect to their neighbors. It shouldn’t be surprising that the gene variants that promote intelligence also have other effects in the nervous system. On average, they protect against Alzheimer’s disease and depression. But they also put one at higher risk for autism.43 Interestingly, intelligence-related gene variants are not just expressed in the nervous system. For example, one such gene, SLC39A8, directs expression of a protein that uses energy to move zinc ions (Zn2+) across the membrane of cells. This zinc ion transporter protein is found in neurons but is even more strongly expressed in cells of the pancreas. So the variant of SLC39A8 that, on average, tends to provide a tiny boost to intelligence probably also has an effect on pancreatic function. The point here is that, when we think about gene variants that affect intelligence, we have to recognize that they have many other effects, across the whole body, most of which we don’t understand.
LET’S MOVE ON TO the final tenet of pseudoscientific racism:
One can predict average human behavioral and cognitive traits based on these broad racial categories. Racial traits are heritable and immutable, and so will be deeply resistant to any social intervention, thereby excusing ongoing oppression and denial of educational and economic opportunity to broadly defined “racial” groups.
If, as is widely held by racists, genetic differences account for a large share of the remaining IQ test score gap between blacks and whites in the United States, then there must be average differences in the prevalence of gene variants, starting with the thousand or so intelligence-related genes that have been revealed by the large GWAS investigations. Furthermore, those average racial differences must be sufficient to account for a large part of the remaining nine-point gap in IQ test score.
I can’t say this loudly enough: There is no evidence for significant average differences in intelligence-related genes between “races.” 44 Not between self-identified whites and blacks in the United States, nor between any pair of self-defined racial groups. Not only that, there is no evidence for racial group differences in genes that have been linked to any behavioral or cognitive trait. Not aggression. Not ADHD. Not extraversion. Not depression. Nada, niente, nichts, bupkis.
Science is not about what could happen; it’s about what we can prove did happen. To assert that genetic variants underlying “racial” differences in cognitive or behavioral traits must exist because of some just-so story about continent-wide selective pressure, without providing the genetic evidence, is nonsense. It is the very definition of nonscientific, self-serving racial bigotry.