The cash flow statement may come last in the statements, but it is not least. Experienced investors understand the cash flow statement’s crucial presentation of a company’s cash reality, but most management’s public communications suggest that they couldn’t care less. They focus squarely on the Street’s quarterly EPS estimates and strive to meet or exceed them. This short-term orientation may avoid the ruthless downgrades and selloffs when the company “misses by a penny.” But just as beating by a penny may imply aggressive accounting or manipulating levers to squeak by Street estimates, missing by a penny may suggest that the company aggressively tried to find every last shekel between the couch cushions and still couldn’t get there.
Every financial statement offers the opportunity for manipulation, because they all interrelate. Decisions regarding revenue, inventory, receivables, acquisitions, and share repurchases flow through all three. We focus so strongly on revenue recognition, because the income statement’s top line affects all statements most seriously. But every line of the income statement affects the premise of cash flow, because the income statement’s bottom line, net income, is the top line of the cash flow statement. If management uses aggressive accounting or manipulates numbers in the income statement, it calls into question the reliability of the cash flow statement.
The investor must look at all three statements to determine whether the cash flow statement properly adds back noncash items, accurately reflects working capital changes, and shows serial acquisitions, as well as whether management issues stock options or repurchases shares to mask their effects. All three statements come together in the cash flow statement and can manipulate this statement’s job of presenting cash reality.
The cash flow statement has three parts. From top to bottom, they are cash from operations (operating cash flow), cash from investing activities, and cash from financing activities. Each section is important.
Net income heads cash from operations, which ends with net cash from operations, more commonly known as operating cash flow (OCF). OCF is the actual cash change from the comparison period, based on the business alone without any spending on or selling of property, plant, or equipment, acquisitions (enumerated in the next section, cash from investing), or buying back shares, paying dividends, or issuing debt (in the cash from financing section). There are many numbers between net income and OCF. Most investors gloss over them and concentrate on a few. That’s a mistake, because each line offers potential for mischief. There can be many a slip between the net income cup and the OCF lip.
Noncash items appear on the income statement, because they affect how accountants evaluate them for tax purposes. So to reflect cash and not accounting reality, the first lines of the cash flow statement adds them back in to reflect cash reality.
First up, the statement adds back depreciation and amortization (D&A). Chapter 4 showed how changes in measures of estimating D&A could benefit net income. D&A have another important role in determining the way that accurate cash flow measures are important for understanding a company’s current and future cash needs. Manipulating D&A by changing estimates can affect the quality of the cash flows.
Consider when a property such as a building is fully depreciated and owners have reaped the D&A tax benefits. They may spend hardly anything for years and harvest the cash flows. Judging from Dairy Queens in rural areas, Berkshire Hathaway spends little unless absolutely necessary on these fully depreciated restaurants. Warren Buffett took all the earnings and tax benefits years ago, and now the properties are enormous cash flow generators. Investors might look at the lack of D&A for these properties and worry that the company is starving maintenance capex and will eventually have to pay for deferred maintenance. But these are among the simplest, cheapest properties in the industry, and Berkshire determines that the cash flows earn greater returns when invested elsewhere.
In Chapter 4, we saw Akamai Technologies spend more than a billion dollars and fully depreciate its servers over only three years, benefiting the income statement. This inflated cash flow for a few years, until eventually it would be time to upgrade the systems. Then the expense would go back on the income statement, hurting net income and therefore cash flow. Management was underinvesting and giving the impression of earnings power, but they couldn’t do it forever.
Fully depreciated equipment doesn’t signal trouble ahead for Dairy Queen. But for Akamai, it did. Server technology and Akamai’s business demand regular change—unlike the technology for soft-serve ice cream or quick burgers. Sooner or later, as happened, Akamai would have to replace the assets to maintain earnings on assets.
Depreciation and amortization is neutral. The investor needs to understand both a business and its equipment to determine if the D&A is more like that of a Dairy Queen or an Akamai.
This is where opportunities for investors to uncover true cash and potential manipulation begin. Despite massive company opposition, in 2004 FASB1 issued the requirement for a company to include stock-based compensation as an operating expense. Yet, because it is noncash, it is added back to operating cash flow. Because so many companies grant stock options as compensation, the investor must review the underlying numbers in the notes to determine the true effect on current and future cash flows.
Large option and warrant grants to employees and other parties can mean massive future dilution of existing shareholder’s ownership shares. Companies report diluted share numbers that include in-the-money options and warrants, but you don’t see what might happen if out-of-the-money options were to come into the money. An investor buying long has to at least eyeball the magnitude of potential dilution, because sharecount affects valuation, risk and potential return.
To focus those eyeballs, the investor must look at the notes, where the company discloses the numbers of warrants and options as well as their strike prices and expirations. Compare the strike prices to the current stock quote. How many options at what strike prices are close to or far from today’s quote? In how many years to do they expire? The idea is to see the timing and magnitude, if any, of potential sharecount growth to gauge what it could do, for example, to earnings, OCF, and free cash flow per share.
Adding back stock-based compensation can end up boosting operating cash flow. But that’s not the only place where the financial waters are muddied. Another cash flow statement line common with West Coast tech companies is “excess tax benefit from stock options.” This is a cash benefit—taxes were reduced—but no company can say that its normalized operating cash flows include the business of generating excess benefits from stock options. This became mostly moot when, in 2006, FASB stated that excess tax benefits from stock options should appear in the financing-cash flow section, not the operating section.2 Today it’s common to see companies subtract this number in net cash from operations and add it back in the financing section.
Treatment of tax benefits from stock options still matters and will for a while. Investors who review many years of data need to know whether a drop-off in operating cash flow is due to company performance or to the change in treatment of excess tax benefits from stock options. A few examples show both the effect of stock-based compensation on operating cash flow and the excess tax benefit.
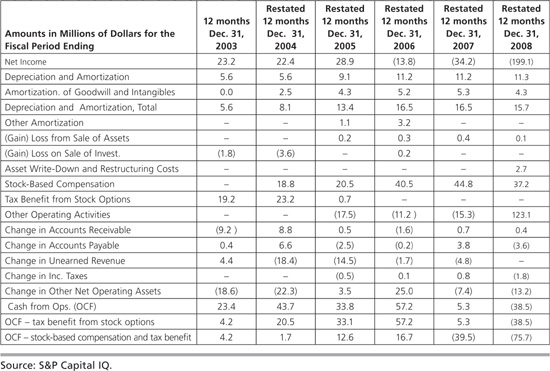
We start with Rambus, which, like InterDigital, is an intellectual property (IP) company that licenses its technology to companies. But as Table 5.1 shows, for a number of years Rambus’s OCF primarily came from generating tax benefits from stock options and adding back stock-based compensation—not from royalties from licensing advanced computer IP. The bottom lines of Table 5.1 show how much lower OCF would be without these items.
Table 5.1 Contribution of Stock-Based Compensation and Tax Benefit from Stock Options to Rambus Operating Cash Flow: 2003-2008

Rambus shareholders believed they owned two things: a cash flow generator from IP royalties and a call option on the potential for back royalties if Rambus was successful suing companies it alleged used its IP without paying license fees and royalties.
But no. The company’s actual business of earning royalties from licenses produced little operating cash flow for these five years. Shareholders owned only a company with cash flows almost exclusively from tax benefits and adding back share-based compensation. In fact, they were paying absurd OCF multiples solely to speculate on whether Rambus would earn future royalties on its technology and win back royalties through expensive and hard-fought litigation—litigation that in large part has been ongoing since the early 2000s with mixed results.
A better, simpler, and more conservative view of operating cash flow is not to add back stock-based compensation, maintaining the income statement’s treatment of it as an operating expense only. Then, determine whether what may be real cash effects of excess tax benefits from stock options are providing an illusion of operating cash flow growth. Investors who ignore either of these can get clobbered.
Many investors stop now, after reviewing the lines adding back noncash charges and skip the next section of the cash flow statement: changes in working capital. This is a mistake. It shows where the company is borrowing and spending from operating cash flow.
The cash from operation section ends with changes in working capital, also called changes in assets and liabilities. These include changes from period to period in accounts receivable, accounts payable, and inventory—all three reported on the balance sheet, relevant to the income statement, and crucial to the cash flow statement.
Trends in working capital are critical. Companies can manage working capital to increase cash from operations, and therefore free cash flow. That can work in one quarter or a year to improve the asset side of the balance sheet and mollify the minority of the Street that glances at operating cash flow, but the benefits are unsustainable.
Think of working capital as a pot that the company uses to even out the variations in customer payments, managing products between manufacture and delivery, and paying vendors. A certain amount of variation is normal, but poor trends should concern the investor.
Reducing accounts receivable boosts operating cash flow, but only so much. A company can theoretically only narrow days receivables outstanding to zero—it can’t collect more than it’s owed. It’s good if a company becomes an efficient collections machine, because then it’s not in effect lending to customers. But as accounts receivable improvements slow, so too do their benefits to operating cash flow.
Expanding accounts payable may improve operating cash flow today, but cannot boost it indefinitely. Only the most powerful companies, such as Wal-Mart or Apple, can dictate payment terms to vendors, and even those big dogs have to pay their vendors someday. The rest of the world’s merely mortal companies must pay vendors within a reasonable time. Therefore, any benefit from stretching out payables eventually stops. Accounts payable are really just short-term financing from suppliers, so it’s equivalent to debt. The supplier “lenders” consider them accounts receivable and will want to collect them, too. That’s why exploding accounts payable may indicate a company, not with power, but rather in deep trouble—just as any company with unsustainable debt.
Expansion of inventory can be an investment in inventory customers want, or it can be a sign that no one wants it, it’s building up, and write-downs loom. On the flip side, reduction of inventory may benefit working capital and operating cash flow, but it could mean working down excess inventory (good), writing off inventory (bad), or waning customer demand (worse).
One way to measure the impact of these working capital items is to calculate the cash conversion cycle (CCC):

Track this over 8 to 12 quarters to see if working capital affects the cash flow for a company. This will be an important indicator for Jacobs Engineering, an example we’ll explore later in the chapter, because it pulls so many of the operating cash flow section warnings together.
Now, let’s examine how working capital changes operate in a straightforward case. Later we’ll look at how highly acquisitive companies can manipulate working capital and operating cash flow by playing three-card monte—moving the ball around so much that you have no idea where cash really lies.
Table 5.2 illustrates that the eight quarters through September 30, 2011, for paper company Domtar Corp. showed a normal fluctuation in accounts receivable, inventories, and accounts payable. Accounts receivable are higher in the December quarter and lower in the March quarter. Inventories expand in the June quarter and decline in September’s. And accounts payable vary a bit, but decline in the March quarter. That makes sense, because if your collections are good in that quarter, you’re more likely to be paying vendors.
Table 5.2 Good Working Capital Management at Domtar: December Quarter 2009–September Quarter 2011*

For these three working capital items the net over 8 quarters is $59 million, only 3 percent of Domtar’s more than $2 billion in operating cash flow for the period, and the rolling last 12 months’ (LTM) numbers show a similarly small effect. There is no material trend in any of the three categories. The company borrows from and repays steadily to each category, reflecting that the company managed its seasonal working capital needs well. No red flags here.
In contrast, consumer fashion accessory company Fossil’s working capital management of inventories raises questions. Examining Table 5.3, you see that Fossil’s inventories increase in three of four quarters (with the exception of 2009, the fallout from 2008 to 2009) and then decline for the quarter ending in January, normal for most retailers dependent on the all-important holiday shopping season. However, anticipated demand ultimately did not materialize. After the holiday season results showed the continued inventory deterioration, John in April shorted the stock, which fell 38 percent on its earnings release in May 2012.
Table 5.3 Fossil’s Working Capital Changes: January Quarter 2009–October Quarter 2011*
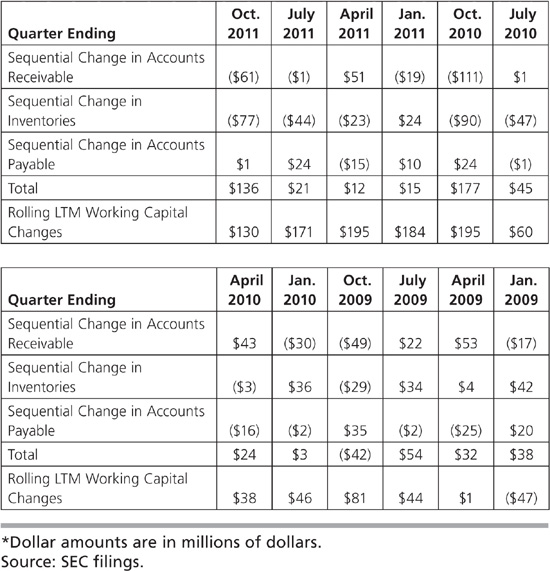
Fossil’s accounts receivable increased in the quarters ending in early October and January. Accounts payable increased in the quarter ending in April. But in the six quarters ending in April 2010, with the expected seasonal exception, working capital improvements boosted operating cash flow. And then they trended poorly, with rolling 12-month working capital changes turning negative from the quarter ending July 2010 to October 2011, reducing operating cash flow.
Where, as with Fossil, working capital changes are negative and the company survives, it is dipping into cash and/or using debt to stay afloat and eventually must pay the piper, as we’ll see next with Under Armour. There are rare exceptions, such as companies that have negative working capital, but Fossil isn’t one of them. The point is that there is a limit to how much and how long working capital improvements can boost operating cash flow, while there is no limit to how badly working capital mismanagement can lead to operating cash flow and company ruin.
Table 5.4 reveals that sports clothing retailer Under Armour’s inventory grew faster than revenues year-over-year and as a percentage of LTM revenues grew for eight quarters through September 30, 2011. This is a great example and common to apparel retailers, so stick with us on this one.
Table 5.4 Under Armour’s Expanding Inventories and Declining Operating Cash Flow, December Quarter 2009–September Quarter 2011*
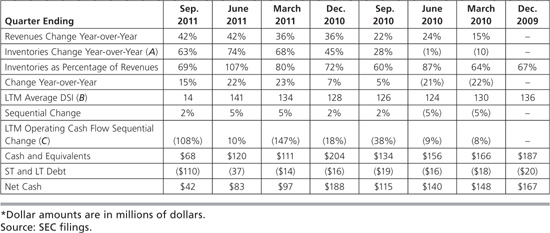
Inventories as a percentage of sales (A) grew year-over-year, as did LTM DSI (B) sequentially for the five quarters to September 30, 2011, while LTM operating cash flow (C) declined for six of the last seven quarters and net cash dropped off a cliff from the quarter ending December 31, 2010, to September 30, 2011. In line with the Street’s focus, investors apparently were mesmerized by the revenue growth, bidding up the stock from $27.83 on September 30, 2009, to $86 two days after the September 30, 2011, earnings release. But growing revenue was turning into less operating cash flow and more and more inventory. The company could only keep it up until the quarter ending in March 2011, when it spent cash and increased debt. This can’t go on forever.
In 2011, John profitably shorted gaming company WMS Industries and Green Mountain Coffee Roasters, due to their working capital red flags. Table 5.5 shows WMS’s expanding receivables through Dec. 31, 2010. They presaged a plummeting stock. Figure 5.1 shows the stock from September 2010 through December 2, 2011.
Table 5.5 WMS Industries’ Expanding Receivables, 2010 by Quarter
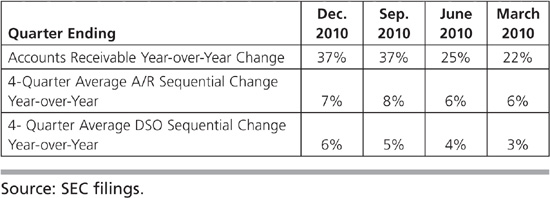
Figure 5.1 WMS Industries: September 2010–December 2, 2011.
Source: FreeStockCharts.com, by permission.
Last of all, highly acquisitive companies can turn working capital inside out, making it nearly impossible to determine the quality of operating cash flow. For example, Green Mountain Coffee Roasters grew revenues at red-hot rates before and after acquiring Diedrich Coffee in May 2010 and Van Houtte in December 2010. Prior to the acquisitions, inventories had fluctuated within a reasonable range and then exploded. For the six quarters including and after the Diedrich acquisition, the company was free cash flow negative for four quarters, breakeven for one, and positive for one, with positive operating cash flow for only three of the six.
This shows a company whose acquisitions and revenue growth obscured weaker organic growth. Green Mountain should have focused on collecting receivables and liquidating inventory. But investors cared only for revenue growth, even though it did not increase value, and their buying drove the shares ever higher. They rose 238 percent for 2011 to the August 3 high, and then began a trend downward. They fell off a cliff in November, plummeting 39 percent on November 10 alone, when the quarterly report came out, reducing the year’s gain by 90 percent.
These are dramatic examples of where working capital changes can show deteriorating earnings quality. Through analyzing these accounts on the cash flow statement, the investor can understand better the real nature of operating cash flow.
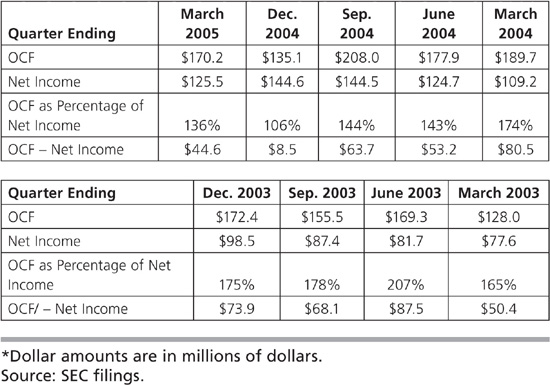
Over time, operating cash flow (OCF) should track net income. The trend of OCF as a percentage of net income tells a lot both about earnings quality and OCF sustainability. A declining percentage calls into question the quality of EPS, OCF, or both. As with almost all indicators, it’s best to track this for 8 to 12 quarters.
OCF declined as a percentage of net income at Maxim Integrated Products, whose balance sheet, revenue recognition, and income statement issues appeared in prior chapters. The percentage of decline warned of trouble. John’s June 27, 2005, report to clients showed his concerns about Maxim’s operating cash flow:
For the past seven quarters, Maxim has experienced a general decline in operating cash flow as a percentage of net income. Although the company saw a sequential increase in cash from operating activities for the March 2005 quarter, from 106 percent of net income to 136 percent, we note the substantial decline year-over-year. Table 5.6 shows that fall from 174 percent to 136 percent, attributable to increases in accounts receivable and inventory. This negative trend could lead to inventory write-downs and extended payment terms, increasing risk to future earnings.
Table 5.6 Declining OCF as Percentage of Net Income at Maxim: March Quarter 2003–March Quarter 2005*
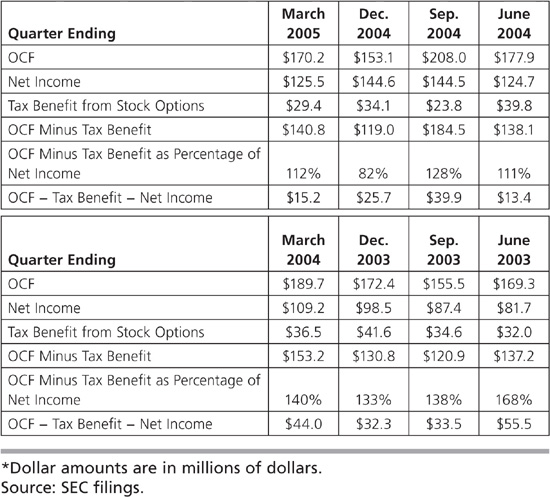
We note that a tax benefit due to stock options comprises a significant proportion of Maxim’s cash from operating activities, representing 17.3 percent and 23.6 percent of operating cash flow for the March 2005 and December 2004 quarters, respectively. Because Maxim relies heavily on employing stock options as means of compensation, the company reports this tax benefit as an operating activity, thus boosting its operating cash flow. We disagree with this accounting technique and regard the tax benefit as a financing activity instead. The tax benefit is not a result of the company’s operating activity nor is it sustainable. (emphasis original)
Once the benefit is removed, Table 5.7 illustrates that Maxim’s cash from operating activities as a percentage of net income falls substantially year-over-year from 140 percent to 112 percent. This highlights our concern over potentially inflated cash from operating activities. Under new stipulations by FASB, companies will be required to report the tax benefit as a financing activity, reducing operating cash flow beginning day one of Maxim’s fiscal year following July 1, 2005. Because Maxim relies heavily on stock options as compensation, Its operating cash flow will be greatly affected, and—holding everything else constant—the company will experience declining OCF in the near future.
Table 5.7 Tax Benefits Boost Maxim’s Operating Cash Flow: June Quarter 2003–March Quarter 2005*
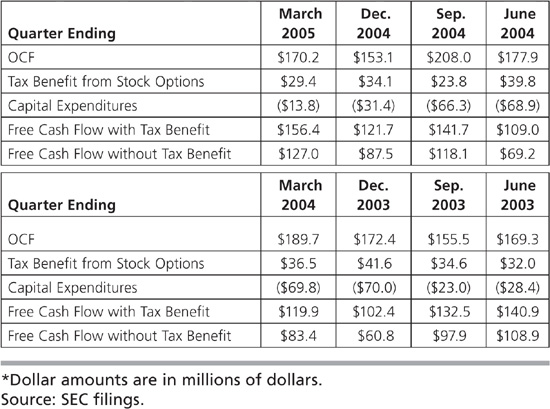
Maxim has experienced a great upsurge in its free cash flow over the past eight quarters, rising 16.6 percent as shown in Table 5.8. Street analysts commend the company for its particular strength, but we note that free cash flow will deteriorate in the near future when the tax benefit from operating cash flow disappears. Thus, investors who price the stock on a cash flow basis may witness multiple expansion without any underlying operating improvement. They would sell the stock.
Table 5.8 Tax Benefits Boost Maxim’s Free Cash Flow: June Quarter 2003–March Quarter 2005*
Operating cash flow is therefore only as understandable as its components, just as net income on the income statement requires analysis of the line items. More investors do the latter than the former. Similarly, more investors care more about net margin—how much revenue turns into net income—than they do about operating-cash flow margin, which is the percentage of revenues that turns into operating cash flow. Both matter.
The operating cash flow margin helps determine how much of the revenue is translating into cash flow and is crucial, because it reflects business strength better than earnings. Measure it on a rolling 12-month basis to smooth it out. If it starts to drop off, find out whether it’s short-term or persistent. Then you can see if there’s trouble and know to avoid it.
The rarer and happier situation occurs with a company whose OCF margin is rising without any of the short-term ways to boost it. If the investor can buy that stock at an attractive valuation, it’s an excellent chance to profit. Table 5.9 shows that Apple, in the three years to the quarter ending September 24, 2011, showed a steady increase in operating cash flow margin.
Table 5.9 Apple’s Tasty Operating Cash Flow Margin Core: December Quarter 2008–September quarter 2011*
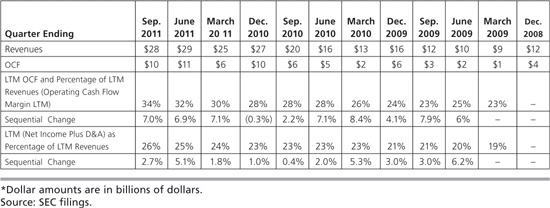
Apple’s sequential change in LTM operating cash flow margins is simply superb. But let’s say you are concerned that Apple’s OCF is overly influenced by adding back stock-based compensation and changes in working capital. Using LTM (net income + D&A)/revenues produces equally dramatic and more consistent results.
Apple is a company that, throughout these three years, wrung more operating cash flow out of each dollar of revenue, no matter how you count it. No wonder investors have continued to profit from this efficient cash-generating machine.
Another way to look at OCF and net income is to track the absolute numbers, not only percentages, to make sure you’ve got the picture. Ideally, we want to see operating cash flow consistently exceed net income. We need to compare this year-over-year to remove business seasonality. We are looking for trends. Is operating cash flow minus net income this year worse than last year? What has been the year-over-year trend for the last four to six quarters? If a company keeps stretching to make its numbers, it can often show up in year-over-year trends.
John’s December 2004 report to clients expressed concern over the divergence between operating cash flow and net income at RAE Systems (now private):
RAE’s cash flow from operations dipped to negative in the September 2004 quarter, while the company’s net income grew 15.5% sequentially and 45.4% year-over-year. Table 5.10 illustrates that for the past six quarters, operating cash flow has amounted to just negative $363,000 compared with net income of $4.2 million, resulting in an operating cash flow to net income deficit of $4.5 million.
Table 5.10 RAE Systems’ Operating Cash Flow Lags Behind Net Income: June Quarter 2003–September Quarter 2004
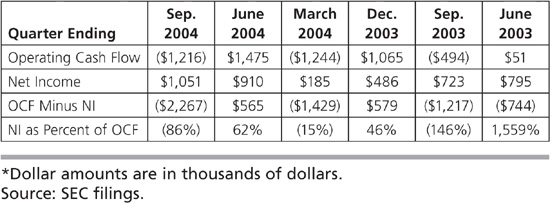
When the company had negative operating cash flow before, net income also declined. In the September 2003 quarter and every other quarter for a year, net income jumped while cash flow dipped into negative territory, without balancing in other quarters. This raises earnings quality questions.
The operating cash flow deficits have largely been driven by working capital items such as inventory and accounts receivable. Future cash flow may also be negatively impacted—payables that RAE’s stretches today will have to be paid. The company generated $616,000 in cash flow from payables this year (2004) and $224,000 in the most recent quarter, and $669,000 last year. But stretching out payables is just a form of short-term financing. It can’t last forever and whatever benefit it provides today to cash flow will be reversed and adversely.
On December 15, 2004, RAE traded at $8.05. Six weeks later, shares stood at $6.55. Cash flow concerns formed one of several reasons for the report, and those negative catalysts came quickly.
In February 2005, John warned clients that operating cash flow lagged well behind net income at Openwave Systems:
As Table 5.11 shows, in four out of the past six quarters, Openwave’s quarterly operating cash flow has lagged behind its reported net income. In our opinion, this is a sign of poor earnings quality. In the most recent two quarters, to December 2004, the company turned the corner to profitability, generating a net income of $2.8 million. Meanwhile, operating cash flow during the same period was negative $19.2 million. The primary factor driving the poor operating cash flows in the December quarter was the substantial increase in accounts receivables.
Table 5.11 Openwave’s Operating Cash Flow Lags Behind Net Income: June Quarter 2003–December Quarter 2004*
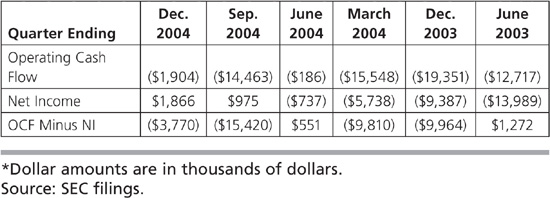
Ultimately, Openwave shares fell more than 99 percent. (’Nuff said.)
Our last example here comes from John’s February 2005 report on personal care products company Helen of Troy, whose lackluster operating cash flows showed poor earnings quality.
Helen of Troy’s operating cash flows have turned negative, even while net income has grown. This typically indicates periods of poor earnings quality. Net income grew to $31.1 million in November, up from $25.1 million in the year-ago period. Meanwhile, operating cash flow dropped to negative $1.1 million from $12.9 million over the same period. As a result, the operating cash flow/net income ratio was –3.5 percent in November 2004, down from 51.3 percent in the year-ago period.
The results in Table 5.12 (see page 144) are presented on a year-over-year basis to account for seasonality. As the table shows, operating cash flow has weakened considerably in each of the last three quarters. The key drivers of this deterioration have been large increases in inventory and accounts receivables, as well as an increase in accrued expenses.
Table 5.12 Helen of Troy’s Operating Cash Flow Lags Net Income: Year-over-Year, Fourth Quarter 2003–Third Quarter 2005*

So Helen wasn’t so beautiful after all.
While operating cash flow minus net income and OCF/NI are better-known formulas, we turn to indicators you haven’t seen before. They are extra steps of analysis unique to this book.
EBITDA—earnings before interest, taxes, depreciation, and amortization—appears constantly in the financial media and company press releases, and is sometimes loosely thrown around as “cash flow” or even (yowza) “free cash flow.” EBITDA is operating income from the income statement (EBIT) with D&A added back and ignoring anything below it, such as interest and taxes. Adding back D&A makes sense, but taxes and interest are expenses. EBITDA, adjusted EBITDA, and other formulations are not real cash flow.
The cliché is that EBITDA is “earnings before bad stuff.” It doesn’t account for working capital changes, which are key to understanding the direction of the business and red flags. By adding D&A back in, EBITDA assumes the fixed assets will not be replaced. And by ignoring interest expense or income taxes, it doesn’t take into account how the company is financed.
The latter points to the defensible use for EBITDA and variations such as EBIT capex and EBITDAR. Value investors like Tom routinely estimate a normalized enterprise-value-to-EBITDA multiple because buyers—usually private equity—use this multiple to determine what gains they could make if they purchased a company and added debt. Levering up usually means interest deductions and shifts in tax liability, which is good for buyers if the business cash flows can cover the payments. For these buyers, it is precisely because they know how they will adjust a target’s capital structure that EBITDA is just fine for that purpose. An EV-to-EBITDA multiple can help the investor on the long side evaluate margin of safety and potential return for a buyout candidate.
Another exception where EBITDA is useful comes with a company that is growing rapidly through acquisitions. In the rare case where you can have great confidence in the acquirer’s disciplined track record paying value prices for excellent future returns, EBITDA is a reasonable measure until free cash flow grows and normalizes. These are two ways that EBITDA is useful to the long investor, but the short seller knows management can also use EBITDA to obscure or manipulate cash reality.
Tracking the spread between the EBITDA margin and the operating cash flow margin can show possible manipulation. This is a better tool than OCF minus net income because this calculation will pick up more clearly whether the company is pulling levers on the income statement to generate a lot of growth in EBITDA. Use rolling LTM from quarter to quarter to smooth out fluctuations. Then note, not the absolute value of the difference, but the trend—whether it’s widening considerably. Companies usually, but not always, produce more EBITDA than OCF, because it doesn’t account for working capital.
There is no absolute value at which the spread shows a problem. It might be 5 percent for one company and 10 percent for another one, even if in the same industry. It’s the trend that matters. If the LTM EBITDA margin expands, but doesn’t translate into cash flow, then the spread will widen—the result of the equation grows—and that’s the concern. It is a tipoff that something is going on to make the income statement look pretty without cash coming in the door. Table 5.13 shows clothing retailer Under Armour’s textbook widening LTM spread for 8 quarters through September 2011.
Table 5.13 Under Armour Widening EBITDA Margin – OCF Margin Spread: December Quarter 2009–September Quarter 2011
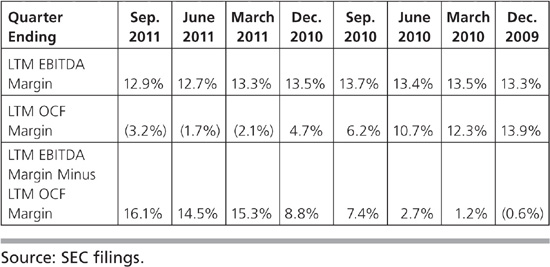
A number of things can cause it. It might be stuffing the channel. Maybe the company reversed a reserve or overstated its gross profit margin or managing operating expenses to make margins look more attractive. The reality is that the margin improvement is of low quality when the spread widens. We track this for the previous three years.
It doesn’t get any clearer than with the well-known streaming and DVD delivery company Netflix for the two years to September 30, 2011. Table 5.14 shows that Netflix’s LTM EBITDA margin was basically flat, while the LTM OCF margin dropped considerably. The spread widened—it used to be negative and turned to positive, as EBITDA became greater than operating cash flow. As with the next example of Jacobs Engineering, this pointed to low-quality earnings, cash flow issues, and moderating demand, all of which appeared in the Netflix earnings report for the quarter ending September 30, 2011. Netflix shares had already plummeted, but we see in Figure 5.2 that they had farther to fall.
Table 5.14 Netflix’s Widening EBITDA Margin–OCF Margin Spread: December Quarter 2009–September Quarter 2011

Figure 5.2 Netflix: April 2010–December 12, 2011.
Source: FreeStockCharts.com, by permission.
In 2011, John advised members of Motley Fool stock services about numerous operating cash flow concerns at Jacobs Engineering.3 The company at the time combined all of the operating cash flow and net income items we’ve discussed in one big heaping bowl of short-seller soup. It begins with DSO and accounts receivable warnings, moves to OCF-minus-net income divergence, tap dances to the EBITDA-margin-minus-OCF-margin spread, and concludes where the working capital problems ensure a deteriorating cash conversion cycle. Beautiful to behold.
Shares of Jacobs Engineering Group (JEC) score in the lowest quintile in our earnings quality model. Historically, companies with the lowest earnings quality have lagged behind companies with the highest earnings quality by 1,500 basis points annually over the past 10 years.
As shown in Table 5.15, the quarter ended April 2011 brought JEC its seventh consecutive year-over-year increase in days sales outstanding. Furthermore, the DSO reached at least a three-year high at 71 days.
Table 5.15 Growing DSO at Jacobs Engineering: April Quarter 2009–April Quarter 2011

Our concerns with respect to lengthening credit terms do not relate to the collectability of the receivables. Rather, the extension of credit terms often acts as a way to incentivize the customer and front-load revenue recognition. This creates a short-term boost to revenue at the expenses of long-term sustainability, because a revenue “gap” is created that must be filled by a new customer to offset the revenue pulled into the current period.
In addition, JEC witnessed an increase in its unbilled accounts receivable. Year-over-year, the unbilled accounts receivable (A/R) grew 14.3 percent compared with a revenue decline of 1.1 percent. An increase in unbilled revenue may signal aggressive revenue recognition, because the company’s management has discretion in determining revenue recognition and profitability in percentage-of-completion accounting, as shown in Chapter 2.
In our view, managements engage in extended payment terms or accelerated revenue recognition when demand for a company’s products is weakening. Otherwise, there is no incentive to front-load revenue to boost short-term results. In fact, management reduced its guidance on the conference call, citing uncertainty in the market.
Prior to the April quarter, OCF minus net income had also fallen year-over-year for four consecutive periods. This is another sign of poor earnings quality, because it means the net income reported on the income statement is not resulting in a corresponding amount of cash flow. It remained weak in the most recent quarter with a cash flow shortfall to net income. While there is some seasonal effect in this quarter, cumulatively the company has had a shortfall over the past year.
Finally, Table 5.16 reveals that the spread between the LTM EBITDA margin and the LTM OCF margin has expanded to 5 percent, the highest in at least three years. As operating margins have held steady, OCF margins contracted. As a result, profits generated on the income statement have converted less and less into cash flow.
Table 5.16 Jacobs Engineering Widening EBITDA Margin – OCF Margin Spread: April Quarter 2010–April Quarter 2011*
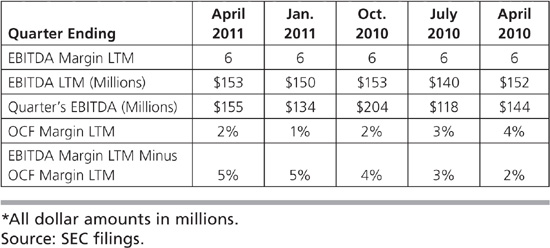
In our view, EBITDA does not represent an adequate measure of cash flow, primarily because it does not account for changes in working capital, which are often key indicators that management is stretching in a given quarter or over time.
Based on the tone of the conference call, we could see a continued negative trend. CEO Craig Martin stated:
“We are big believers that as you take share, you position yourself best for the more robust cycle of the market. So we would certainly be willing and able to sacrifice margin in order to expand our market share. And in fact, that’s part of our plan. One of the ways that our cost structure helps us to steal share in these down cycles is that we have that beneficial cost position.”
This effort to steal share may compress margins in the future, and, given that the demand scenario is pessimistic, cash flows may continue to be weak.
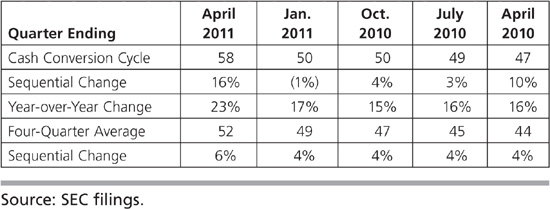
Table 5.17 shows that, as a result of poor cash flow metrics, the company’s cash conversion cycle has been on the rise, reaching at least an 11 quarter high at 58 days and well outside of the normalized band of prior quarters and years.
Table 5.17 Jacobs Engineering Rising Cash Conversion Cycle: April Quarter 2010–April Quarter 2011
With this perfect confluence of earnings quality indicators, it was no wonder the company missed earnings the next quarter. JEC’s stock price plummeted 38 percent from $50 a share to approximately $31 at the October 2011 lows.
With operating cash flow issues now wired into our brains, we see in front of us a mirage. That is, a “Cash” EPS mirage, unique to this book.
Cash EPS is net income minus accruals. The accruals are the changes in the following:
 Total current assets
 Total liabilities
 Cash
Cash
 Securities and investments
 Total current portion of long-term debt
 Depreciation and amortization
If net income is greater than Cash EPS, then management has created an earnings mirage. Many times companies report profits and earnings growth that are mirages, when all of them came from changes in accruals only.
Cash EPS should be greater or equal to the company’s reported EPS. Watch the trend. A quarter or two doesn’t necessarily mean much, but a clear negative trend calls into question whether management is estimating based on experience in order to manipulate the numbers.
Consider short-term liabilities (such as interest, taxes, utility charges, wages) that continually occur during an accounting period, but are not supported by an invoice or a written demand for payment. When preparing financial statements for that accounting period, such liabilities are estimated on the basis of experience (based on previous payments). Similar increases in the assets of the firm (which may also continually occur) are not taken into account, in order to comply with accrual basis accounting rules. Management can use its “experience,” which it can determine to suit its needs.
Over a number of quarters, if cumulative reported EPS is greater than Cash EPS, it signals poor earnings quality. If Cash EPS is negative and reported EPS is positive, then the latter is all coming from accruals. This is a low-quality source of profits and may be a persistent problem.
Returning to Jacobs Engineering, Table 5.18 shows that the company’s earnings driven by accruals as Cash EPS were cumulatively negative over the example period.
Table 5.18 Negative Cumulative Cash EPS at Jacobs Engineering: April Quarter 2010–April Quarter 2011
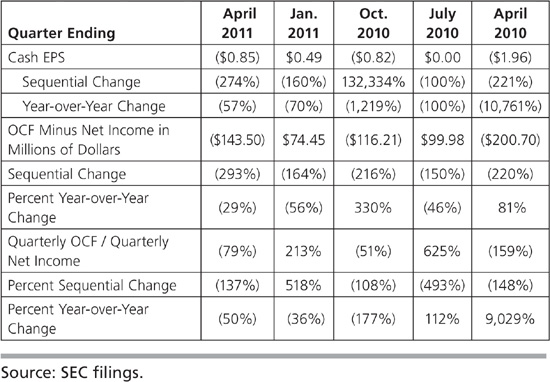
Jacobs wasn’t producing “real” EPS, a strong negative earnings quality indicator.
In 2011, John notified clients of his Parabolix Research service that Cash EPS was also a negative indicator for earnings quality for Digital River, an e-commerce solution company:
The company has persistently generated negative Cash EPS, which removes changes in accruals from reported EPS. Where accruals have historically been a larger driver of performance than net income, as at Digital River, they are a source of low earnings quality.
Cash EPS was negative coming out of the 2008 crisis that ended near the end of the first quarter of 2009, and its rebound was quite weak. Table 5.19 shows that cumulative EPS for the nine quarters exceeded Cash EPS substantially by $2.11 a share. This means Digital River’s earnings quality is low. Reported earnings were generated more by accruals and were fiction rather than reality.
Table 5.19 Negative Cumulative Cash EPS at Digital River: June Quarter 2009–June Quarter 2011
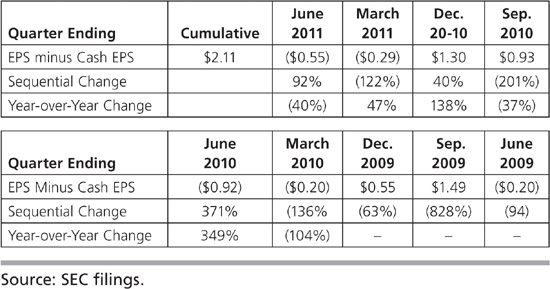
Eventually, this and other factors caught up with Digital River. It warned on July 28, 2011, after which its stock dropped 39 percent through August 26 versus 12 percent for the S&P 500.
The investor can combine information from the cash from operations and cash from investing sections to calculate free cash flow, another path to warning signs of earnings quality problems.
The financial world defines “free cash flow” in different ways, including:

“Owner earnings” is Warren Buffett’s formulation, also called “structural free cash flow.” It omits all other adjustments to net income and omits working capital changes.

It’s “true,” because it’s the actual cash reality, even though adjustments, working capital, and more may or may not be sustainable or desirable.
These are ways that investors use free cash flow for comparative purposes, and value investors in particular will use more than one to get at what matters for the particular company and industry. For the purpose of identifying ways to manipulate free cash flow, we use true free cash flow, which uses OCF from the cash from operations section and capital expenditures (capex) from the cash from investing section.
We calculate free cash flow as a percentage of the revenues to arrive at the free cash flow margin. We use LTM free cash flow margin for the same reasons as LTM operating cash flow above. Table 5.20 shows that just as Apple has experienced a healthy growing operating cash flow margin, so has Priceline with its free cash flow margin. It steadily climbed over each four-quarter period, wringing more out of its billions in growing revenues.
Table 5.20 Growing Free Cash Flow Margin at Priceline: June Quarter 2010–March Quarter 2012

To see the other side, we return to John’s report on Helen of Troy, where he identified its poor free cash flow quality.
Helen of Troy’s free cash flow—using the simplest calculation of OCF minus capex—has also been dismal in recent periods. Poor operating cash flows act as a cash drain. However, the company’s acquisition of OXO in particular had a significant cost. Typically, we adjust capital expenditures to reflect the cash outlay for an acquisition, because all of the benefits of acquisitions are clearly evident in higher sales and net income. However, the cash cost is not. Helen of Troy included the cash of the acquisitions into capital expenditures, which we believe presents a fair picture of the company’s free cash flow—which has been persistently negative. For the nine months ended November 2004, free cash flow was negative $302.1 million. Table 5.21 shows the last four quarters each compared to the prior year quarter.
Table 5.21 Negative Free Cash Flow at Helen of Troy: Year-over-Year Fourth Quarter 2003–Third Quarter 2005*

With a number of examples now of this company’s significant issues, it’s fair to say that this Helen was the face that launched a thousand slips.
And with that we leave the interaction of the cash from operations and cash from investing sections to find the fewer, but still important, opportunities for manipulation in the investing and financing cash flow sections.
The cash flow statement’s next section contains investments bought and sold. Most commonly, it includes additions to and sales of property, plant, and equipment, capital expenditures or “capex,” acquisitions and sales of businesses, and purchases and sales of securities and cash instruments.
Companies either break out additions to and sales of PP&E or specifies “net,” which combines the two. Here too, the investor has to look at trends. A company is not in business to sell its PP&E. A restaurant chain might be selling company-owned stores to franchisees, hoping to earn higher-margin, but nominally smaller, franchise fees, but the boost to cash from selling stores can’t continue. Worst, if the company faces a cash crunch, it might sell both well-performing and poorly-performing company stores at any prices to get the cash. (We’ll look at this in a moment with restaurant chain Steak ’n Shake.) If the company nets purchases and sales, that’s a clue to go to the footnotes to find out what’s what.
The cash from the investing section also doesn’t distinguish between growth and maintenance capital expenditures, and this is essential to evaluating cash reality. In a well-run company, management invests in growth capex only where it yields a sufficient return on capital and manages maintenance capex to keep the existing business in good shape—not putting off maintenance or upgrades essential to current operations. One capex number doesn’t tell investors how much or well management spends company money on growth or maintenance.
Companies rarely break out growth and maintenance capex. Investors often use depreciation and amortization as a proxy for maintenance capex, but whether that makes sense depends on the business and how D&A works for its equipment. (We explained how important this is with Akamai’s questionable D&A in Chapter 4.) But even knowing maintenance capex doesn’t reveal whether management is starving itself to look good to a buyer—which is fine for shareholders if a buyer appears and pays a premium, but could cause more trouble later if the company isn’t sold. Most simply, if you maintain your car, it lasts longer. Put it off, and you may find yourself broken down on a highway.
There is no rule about good or bad growth, or about maintenance capex. Growth capex can be a poor investment and lead to low-quality cash flows, or it can be an intelligent use of capital and lead to higher returns. And low maintenance capex can be correct (the restaurants, like Dairy Queen, require little updating) or a poor decision (putting off maintenance capex, boosting current cash flows and net income, only to have to pay it later, reducing cash flows and net income) that distorts real cash flows for the company.
Let’s see these concepts in action. In 2008, a shareholder group led by Sardar Biglari, then-CEO of Western Sizzlin’, a small restaurant chain, gained control of the iconic Steak ’n Shake chain and became CEO. Table 5.22 shows that for the two years prior to that change in the control, the chain’s rapid expansion—seen in growth capex—and negative free cash flow marched it towards the drive-up window of doom. The company would have been already blown up were it not sustained by cash from willy-nilly restaurant sale-leasebacks.
Table 5.22 Declining Free Cash Flow and Cash at Steak ’n Shake: July Quarter 2006–April Quarter 2008*

Management saw the writing on the Steakburger® wall in the spring of 2008, reducing growth capex to nothing in the second fiscal quarter of 2008. Table 5.23 shows that Biglari, as CEO starting in June 2008, continued the trend from excess growth capex spending to a maintenance capex deficit. This boosted free cash flow and cash dramatically.
Table 5.23 Free Cash Flow and Cash Turnaround at Steak ’n Shake: July Quarter 2008–April Quarter 2010*

At first investors thought this was temporary, to return the balance sheet from the brink. Investors at several annual shareholder meetings questioned management’s capex decisions after it appeared to be no longer necessary to save the company. Biglari named a higher, but still low, $10 million capex estimate for fiscal 2011, which he achieved. This ambitious CEO wasn’t prettying up the cash flow for sale. He simply made the rational decision to spend no more on the Steak ’n Shake business than required to derive desired returns on capital. With the company change to a holding company structure, the newly named Biglari Holdings could invest excess cash from Steak ’n Shake wherever it could earn the highest return, whether in more restaurants or elsewhere.
There is no rule, then, about the magnitude or allocation of growth or maintenance capex. The important earnings quality issue is to make sure that the money isn’t being wasted. Breaking capex into its parts is key to this process.
Cash spent to acquire companies appears in the cash from investing section of the cash flow statement. It’s easy to skim over it and analyze the acquisition separately, but highly acquisitive companies can manipulate free cash flow when they acquire inventories.
When a company makes an acquisition, it’s an investing cash outflow, but the liquidation of acquired inventory and collection of receivables are operating cash inflows. These are one-time events, but the highly acquisitive company can keep this up repeatedly until it stops, and then suddenly the real, sustainable operating cash flow appears—and it’s almost always painfully less. The company “buys” growth until it can’t anymore. Serial acquirers can use acquisitions to obscure real earnings and cash flow power until they stop acquiring.
Investors routinely omit acquisitions from their calculation of free cash flow. True, the cash isn’t spent on the ongoing business, but this begs the question of whether management is allocating capital for higher return. James Montier cites a 2008 KPMG study showing that 93 percent of managers think their merger and acquisition (M&A) activity adds shareholder value, but fewer than 30 percent of the transactions actually do.4 This suggests that if management does not assure investors that the merger or acquisition will be “accretive”—if it can’t manage even that standard cheerleading—we better really watch out. This is particularly true with non-software “tech” companies, which face not only declining average selling prices (ASPs) but also eventual limits to market growth.
Cisco Systems provides a useful example. Table 5.24 shows that Cisco has been a serial acquirer, especially from 2005 through the end of 2010.
Table 5.24 Cisco Systems Squanders Cash on Acquisitions: 2005 –2011*
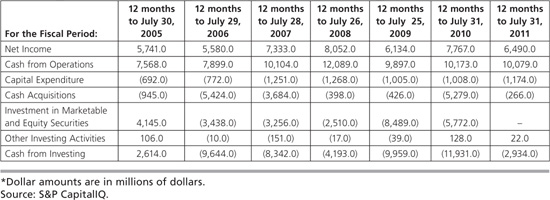
Cisco spent $15.5 billion on acquisitions from 2005 through 2011, yet its net income increased a mere $741 million, only 4.8 percent of the acquisition expenditures. On that basis, we can safely say that the investments have not paid off. So why should the investor not deduct some or all of acquisitions from free cash flow, when a priori it’s impossible to know what the future return will be?
Cisco’s serial acquisitions make it nearly impossible for the investor to determine true earnings power. In the fiscal fourth quarter ending July 31, 2011, the company announced $770 million in restructuring charges, and, for only the second quarter since that ending January 25, 2003—over eight years—did the company not make an acquisition. However, it started up the acquisition machine again in the quarter following its first restructuring charges.
Cisco stock closed at $13.86 on January 24, 2003, and stood at $18.01, plus small dividends, almost 9 years later, on November 7, 2011. Where’s the shareholder value from all those billions?
Acquisitions can mask declining growth. In Cisco’s case, investors had ample warning before the tech crash that the company was running hard to keep in place—and failing to do so, even if the stock price was rising.
Quest Software offers an example here too. Part of John’s 2005 report to clients concerned Quest’s acquisition strategy and negative free cash flow. (This report also appears in part in Chapter 4 to show that Quest’s acquisitions added nothing to tangible book value.) John observed that acquisitions led to increases in revenue, earnings, and operating cash flow, but added no value for shareholders and appeared to have led largely to the enrichment of Quest’s management. He wrote:
Our second concern regarding the acquisitions is the large drain on the company’s free cash flow. While the benefits of the acquisition are factored into operating cash flow, there is no penalty for the price actually paid for the acquired entities. As a result, in Table 5.25, we have adjusted free cash flow to reflect not only capital expenditures, but also cash paid for acquisitions to obtain a truer picture of both the acquisitions’ benefits and costs.
Table 5.25 Acquisitions Drain Free Cash Flow at Quest Software: September Quarter 2003–June Quarter 2005*
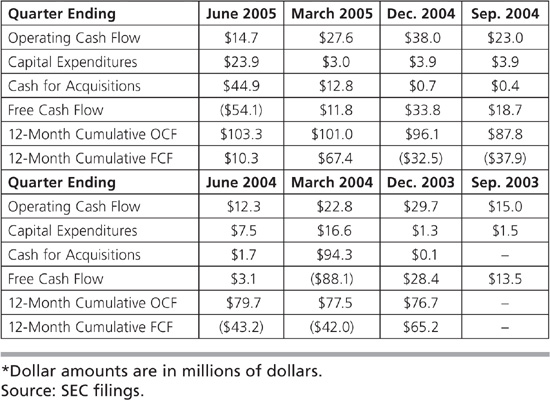
When factoring in cash paid for acquisitions, free cash flow plummeted in the June quarter. More important, on a 12-month rolling basis, free cash flow has been negative in four of the last seven 12-month periods. These acquisitions have taken a toll on Quest’s cash-generating capability, and the operating benefits appear to be minimal; another acquisition always seems necessary to boost the company’s growth rate. We expect further deterioration in free cash flow due to the $57 million paid for [an acquisition] subsequent to the June quarter.
From the long side, Tom is wary of highly acquisitive companies, but favors jockeys—master capital allocators with histories of successfully acquiring companies and earning high returns on capital. An investor is lucky to invest in a few in a lifetime, though Warren Buffett and Charlie Munger, while the most famous, are only two of the few to date (and Biglari Holdings’ Sardar Biglari is almost certainly one in progress). Tom wants financing to be out of cash flows or at extremely low cost—whether through debt or share issuance. And at any time, he wants to buy a highly acquisitive company so cheaply and with such a low debt burden to cash flows that a liquidity crisis doesn’t kill the company and stock.
John is equally wary of highly acquisitive companies, but he doesn’t short them in a bull market. While their earnings quality may be a disaster or difficult to decipher, they can keep that going for a long time where credit flows. But in a bear market, access to capital shuts off. The company suddenly can’t issue equity and finds it harder to get debt financing. When a company’s in liquidity crisis mode, its weak cash flow starts to collapse. So, for a company with questionable earnings quality, track it during a bull market and wait for the bear market to short.
Now we move to the last section of the cash flow statement, less prone to manipulation, but the place to find where management misuses capital for share repurchases and dividends.
The most important thing to watch in cash flows from financing is cash paid for stock buybacks and dividends.
Silicon Valley companies have long maintained that they cannot compete for scarce, highly trained technical personnel or top executives without offering options packages. We won’t argue the point but instead focus on what we do know is wrong: their practice of repurchasing shares at any price to mask or “make up for” options grants.
The only defensible buybacks are those that purchase company stock at such a discount to intrinsic value that it offers a return on capital greater than any other use of the cash. They should be opportunistic—when the stock price represents this greater value. By definition, buybacks to keep the share count down due to increasing share count from options or other means are not opportunistic. (Well, they may provide “opportunity” for management and employees, but not for shareholders.) Table 5.26 shows this sketchy practice at Rambus.
Table 5.26 Rambus Share Count Increases Despite Buybacks: 2001–2010*
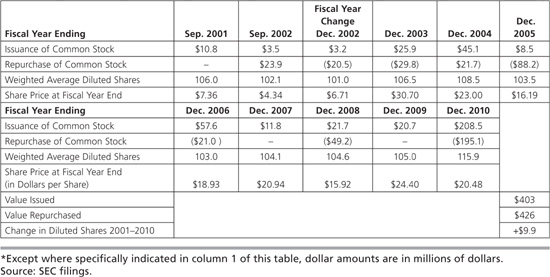
Over the nine years from September 2001 to the end of 2010, Rambus spent $829 million—it diluted shareholders by $403 million and then used $426 million of shareholder cash to compound the offense through buybacks. The net to shareholders for this expenditure of their money was that diluted share count increased by 4.9 million. It may appear that the company gave with one hand and took with the other, but it actually grabbed with both. And as you can see, it made no difference to the company what the stock price was at issuance or repurchase. This runs close to what some might call theft from shareholders.
If this is routine for Silicon Valley companies, then they are all gambles. There is no margin of safety, management allocates capital for the good of employees, and shareholders are ripped off.
The financing section also tells whether the company uses debt to fuel buybacks and dividends. The rational investor is indifferent to cash or debt; all that matters is that the investment returns more than an alternative and higher than the cost of capital. (Of course, debt loads have to be payable and with a margin of safety, should credit dry up.) So, if the stock is selling for a discount consistent with extreme bear market lows, and interest rates are low due to the deflationary nature of economic contractions, it may make sense to issue debt to buy back shares, rather than to invest anywhere else. This is very, very rare.
But it almost never makes sense to issue debt to pay dividends. We have only to turn again to Hewlett-Packard to see debt increased to pay for dividends and to repurchase stocks.
Hewlett-Packard shows all the ways to completely obscure true earnings. Chapter 4 showed the clouding effect of “recurring nonrecurring charges” for serial acquisitions and restructuring. As earnings power declined in the last six years, the company turned to debt to fuel buybacks and dividends. It is unsustainable. See Table 5.27.
Table 5.27 Hewlett-Packard Uses Debt for Dividends and Share Repurchases and Gets Nowhere: 2006–July 2011
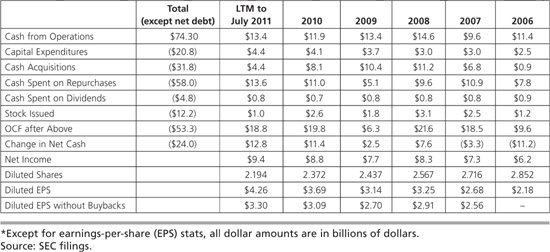
The problem started in 2006, when net cash began its decline to $24 billion dollars in net debt. The 2009 one-year improvement in net debt was almost exclusively due to a decline in cash spent on share repurchases.
The change in net cash—$24 billion—is almost 40 percent of the $58 billion spent on share repurchases. But it gets worse. During the same period, the company issued $12.2 billion in stock—whether for options or acquisitions. The company could not fund with cash acquisitions, stock issuances (grants or acquisitions), repurchases, and dividends (“Lions and tigers and bears, oh my!”), so it simply reduced cash and increased debt to the tune of $24 billion.
What good did this do for shareholders? At first, it appears HP doubled its EPS, where revenue increased 41 percent, net income by 50 percent, and OCF by 18 percent. It looks more efficient—as though they must have cut costs. But then you factor in flat gross margins, net margins up slightly from 6.8 percent to 7.3 percent, and declining levered and unlevered free cash flow margins. Take out the reduced share count and EPS tracks net income exactly. The buybacks are responsible for 40 percent of the change from cash to debt. Unless Hewlett-Packard miraculously transforms itself into a sensible capital allocator, not to mention a better business, the buybacks and/or dividends will have to slow or stop, and down goes the stock.
The investor needs to scrutinize the cash flow statement carefully. Working capital changes can make operating cash flow look better than it is. Serial acquisitions obscure working capital, operating cash flow, and true free cash flow. Options grants, options tax benefits, and share issuances and repurchases can be all part of a game to cloud the real share count and cash flows of the business. If cash is indeed king, then the investor must analyze the cash flow statement to determine if it’s real royalty or merely a pretender to the throne.