Too many contracts, not enough shares
Mistake 8: not understanding money management
The safest way to double your money is to fold it over once and put it in your pocket.
Kin Hubbard
While traders the world over continually search for the ‘perfect’ entry system that will deliver them continually successful trades, those who have developed a portfolio or system-like mindset have come to understand and accept their ‘edge’ (see chapter 10). Understanding your edge also means knowing and understanding all the probabilities and range of outcomes that your trading system can produce—both negative and positive. This allows you to shift focus from entry and exit signals, to understanding the rules of money management. That is not to say that traders with good money management have given up the ‘search’, but they are able to continually research and test new entry and exit techniques knowing that, while the numbers and performance results of these ‘systems’ are important, it is the application of money management rules that will ultimately determine the outcome of any trading system or methodology.
These traders are effectively able to wear two hats and separate their system development role from their role as a trader. The systems that they are trading are executed according to the rules they have developed and documented prior to any live or real time trading. This is their trading ‘hat’—simply doing what they said they would, safe in the knowledge of the range of probable outcomes of the plan. The second hat—the system development hat—is the one they wear while developing and testing new ideas, concepts or trading systems. The two roles are kept distinctly separate so as not to cause any confusion and to prevent any ‘thinking’ occurring while they are trading. An integral component of their system development process is a thorough understanding of the money management model they will use. Specifically, we will refer to money management as the answer to the question of ‘how many?’ or ‘how much?’ of any share or futures contract we will trade.
It’s simple, but it ain’t sexy!
The vast majority of traders, investors, trading educators and trading-related media tend to avoid money management like it is the black plague. The focus for most seems to be everything but money management—entries, exits, new indicators, projections, forecasts, guesses, whiz-bang software all attract the punters like moths to a light. However, mention money management and people either ignore you, fall into a self-induced coma, or run off to mow the lawn with a pair of scissors if it means they will escape dealing with this vitally important issue.
Leading author, educator and trader Ryan Jones wrote The Trading Game: playing by the numbers to make millions, a book that explores the many aspects of money management in detail. Here, Ryan offers his take on why money management is often overlooked by the majority of market participants.
In the trading industry, money management is simply not the sexy thing to spend your time or money on. Pick up any magazine and a majority of the ads have to do with picking market direction, tops and bottoms, and things that deal with some sort of ‘mystical market prowess’. It is my personal opinion that there is this idea that those who can accurately pick market direction possess some sort of genius that others don’t possess. It is kind of an ego thing. Money management is not exciting. It is maths, and maths that virtually anyone can understand and apply. Consider this: over the past 20 years of being involved in this industry, I have talked with attorneys, doctors, engineers, rocket scientists, teachers, pastors—you name it—I have talked with someone associated with virtually every field of work except one ... I have never once knowingly talked to an accountant who was also an active trader (not involved in this industry as an accountant). Generally, accountants are considered low-key, low-risk people from a personality standpoint. Let’s be honest, accounting is inhumanely boring. Money management is boring, thus it just doesn’t get the kind of attention like technical analysis and picking market direction.
Money management is simply not sexy. It is not promoted by people in the industry because it does not have the sex appeal to sell. It can be confusing at first. However, it really is not hard to understand for those who spend a little time with it. I also think it is ignored because there is ignorance as to how important it really is to the overall, long-term results. I believe that money management (or lack thereof) is the number one reason for failed trading attempts.
Traders are forced to add an extra layer of thinking to their plan when confronted with the issue of money management. Beyond the initial focus on searching for magical entry and exit techniques to deliver unobtainable returns lies the understanding of probabilities (see chapter 10) and recognising the importance of money management to the long-term success of a trading business.
Money management decisions are made every single time a trader enters the market, whether those decisions are conscious or not. Thus, from the beginning, no matter what you are trading, the money management decisions should be planned out before trading begins. Of course, there is room for changes to the plan as trading presses forward, but the major crux of the plan is in place. If you wait, you may miss the opportunity to capitalise on the profitable periods and this can be tremendously costly.
Money management is simple maths, but applying it to trading and a trading plan can be a little more complex. This is because the type of money management applied can have a dramatically different result on the same trading strategy and/or system. Money management is simply determining how much of your capital you are going to risk on each trade. This is done by determining the trade size. It is a decision that all traders must make every single time they enter the market, and whether they make it based on careful thought or little thought at all, everyone makes this decision. I try to encourage traders to make this decision before starting a trading strategy or system. Create a plan that clearly describes what your trade size will be at the beginning, and all details with regard to any changes in trade size. For example, if you start with one, when will you increase to two, or three, and so on? If you increase to two, three, four or whatever, what must happen for you to decrease back down to three, two and even one if circumstances warrant? These things should be determined prior to trading so that the trader knows what the ramifications are at each increase/decrease level. Generally, changes in trade size should be based on changes in equity and/or risks being taken.
The position sizing technique and the amount of capital you plan to risk on each trade must be incorporated into your overall trading plan, and must be documented prior to engaging the market. Properly applied money management techniques can greatly improve the overall performance of a successful trading system. In the event of the system or methodology entering a drawdown or period of poor returns, these techniques can actually prevent the system from completely ‘blowing up’ and losing vast amounts of either capital or accumulated profits.
It is estimated that 90 to 95 per cent of all traders fail (blow their account out) within two years. The very fact that so many traders risk their entire accounts (most don’t realise this is what they are doing) speaks volumes to the importance of money management. On the flip side, proper money management can literally turn an average performing strategy into a multimillion-dollar machine in a matter of a few short years. How important is this? Consider the following scenario. Two traders trade the same exact system over the course of four years. The first three years are great. The fourth year the system falls apart and gives back a great deal of the gains achieved during the first three years. The trader applying a proper money management strategy would geometrically grow their account during the three good years and then protect those profits when the drawdown comes. The trader who does not is not efficient during the three profitable years, and ends up giving most profits back in the fourth year. The net result could be hundreds of thousands of dollars between the two traders.
Money management strategies help us to solve the ‘how many?’, ‘how much?’ questions, and to apply this strategy consistently in our trading business. Many traders and investors have little understanding of this concept. Despite hours of work and research devising entry and exit strategies, little (if any) thought is given to position size.
There really are only a few basic money management philosophies. For example, gamblers like to increase trade size after losing trades and/or after the equity decreases. By doing this, they increase the probability of making back losses with fewer winning bets. This is generally not for traders who have a positive expectation in their trading. It has been proven over and over again that the best type of money management when the expectation is positive (you expect to be profitable over time) is to increase trade size as the equity increases, not as it decreases. This is called anti-martingale (martingale increases trade size as equity decreases). There are several variations within the anti-martingale money management strategy. And there are some major differences in long-term results within these variations, which is really why it is so important for traders to understand money management in general.
Randomly choosing to buy or sell varying numbers of shares or futures contracts results in haphazard and inconsistent results. Worse still, traders often fall into the trap of increasing position size following a string of losing trades in an attempt to make back the losses they have incurred. This is a gambling mentality that will result in inconsistent results and ultimately will eventually destroy your trading account. This is known as a martingale money management approach—increasing trade size as the value of the account decreases. It is based on the ill-informed idea that the losing streak will eventually come to an end and the massive bet on the winning trade will make up all the losses and return the trader to profit. Unfortunately, it rarely works in real life. Consider the following example.
Example 1
Starting with trading capital of $100 000 and using the 2 per cent risk rule requires the trader to risk $2000 on the first trade. This trade is a loser, so the trader doubles the risk on the second trade to $4000, and it too is a loser. The third trade requires an $8000 risk and the third consecutive loss follows. The fourth trade now requires a risk of $16 000. The losing streak continues, requiring the trader to risk $32 000 on trade number five having already suffered losses of $30 000 from the first four trades. If this fifth trade were to lose, the account would be down by $62 000 and require the trader to risk $64 000 on the next trade. Clearly this is not possible as there is now only $38 000 left in the account.
Anti-martingale money management systems require position or trade size to decrease during a losing streak when your account size is decreasing, and increase as the account increases, thus causing geometric growth during these positive runs. They are the only type of money management systems that are employed by those with a professional approach to their trading business. Understanding and applying these strategies can have a dramatic impact on both the profitability and longevity of your trading business. There are five commonly accepted methods of anti-martingale money management strategies, as described here.
Equal dollar value model
Position size is arrived at by dividing the total available capital by the number of open positions traders believes they are capable of managing. It can result in huge variations depending on each person’s belief in their capabilities. A share trader with a $100 000 account may believe they can effectively manage 10 open positions. Each position will thus have a face value of $10 000. Another may believe they can manage 15, giving a face value of $6600 to each position. Position size is then adjusted according to the value of the overall account as it rises and falls in value. The other major issue with this method is the huge variation in the price of shares. Dividing the capital equally between positions gives very small positions in high-priced shares, and massive positions in lowly priced shares. This leads to anomalies in individual trade risk and exposure.
When applied to the futures markets, this method manifests as trading one contract for every $x in the trader’s account. Often, this is touted as $10 000. Traders with $100 000 would thus assume they would trade 10 contracts. If the account increases to $110 000 they would trade 11, and if it decreases to $90 000, nine would be traded. The problems arise when consideration is given to the positioning of stop-loss points, the differing contract specifications of individual commodity contracts, and the margin requirements of each contract. These are dramatically different between, for example, natural gas and corn. An initial stop-loss of, say, $2000 may be appropriate for corn, but would be ridiculously tight in natural gas.
Optimal F (fixed percentage) model
An extension of the fixed or equal dollar value model discussed above is using a fixed percentage of your total account for each trade. Through back-testing and analysis the optimal percentage figure is arrived at and then used to calculate each position size. Optimal F is the optimum fixed fraction or percentage to place on any trade. If, for example, you determine that 15 per cent is the ‘best’ fit, you then allocate 15 per cent of your account to each and every trade. As the account grows, 15 per cent will be a larger dollar amount. If the account decreases, then 15 per cent of this reduced figure will be a smaller dollar amount. The major issue is that Optimal F calculations are based on the past and then applied going forward. You are effectively hoping that the Optimal F for the trades in the historic test period will be replicated in live trading now and into the future.
Percentage risk model
Using this method requires traders to define the percentage of total trading capital they are prepared to risk on each trade. Amounts from 0.5 per cent up to 5 per cent are often suggested. These will vary based on individual risk tolerances, trading styles and time frames. Using this model involves an arbitrary decision as to the size of the percentage risk to be used and the initial stop-loss level at which the trade will be exited—both factors that can hugely affect the results of each trade, as shown in the following example. This stop-loss level may be based on chart analysis, technical analysis or a randomly selected price at which the trade will be exited if it fails.
Example 2
Using $100 000 as available capital and applying a 2 per cent risk rule determines that $2000 will be put at risk on a trade.
Shares in XYZ are trading at $5.40, and a stop-loss level of $4.95 is arrived at from chart analysis, giving a loss per share of $0.45 in the event the trade is a loser.
Trade position size is calculated by dividing the $2000 risk by the potential loss per share.

However, if the initial stop-loss level is determined to be further away from the current price, say $4.65 or $0.75 per share, the resulting position size is smaller:

If the same profit target exit price point is assumed, the larger position size will result in a much larger profit being realised.
The percentage risk model is a step towards varying position size in line with initial stop-loss values in combination with the maximum dollar amount that is to be put at risk on each trade. It also allows the percentage risk figure to rise and fall as total equity rises and falls. If the $100 000 used in the above example increases to $120 000, then the risk per trade will increase to $2400 ($120 000 × 2 per cent). If the account were to decrease to $90 000, then the risk per trade will be decreased to $1800 ($90 000 × 2 per cent). The shortcomings of this method are the subjective selection of the initial stop-loss points and the fact that no allowance is made for the volatility of the individual share or futures contract being traded.
Volatility-based model
The use of volatility takes the percentage risk model a step further and incorporates the fact that individual stocks and commodities have varying degrees of average price movements or volatility. This volatility is incorporated into the position sizing and money management model to more accurately reflect the effect these individual price behaviour patterns or ‘personalities’ can have. The net effect is that position sizes in instruments displaying high volatility are smaller than in those with lower volatility.
The major benefit of this method is that it dramatically reduces the amount of subjective decision making required to formulate the stoploss point, and hence position size.
The most commonly used measure of volatility is average true range (ATR). ATR is a measure of daily price ranges over a given period of time and can be used effectively in position sizing models. An ATR of $0.50 means that on any day, the instrument being traded is expected to move within a $0.50 range. This is its ‘normal’ price range. If we were to set a stop based on this value, it is highly probable that we would be stopped out of the trade on a daily basis. To avoid this, a multiplier of ATR is used to position stops outside of this normal daily price ‘noise’. Various multipliers of ATR from 1.5 to 5 can be used, depending on the risk tolerance and individual needs and styles of traders.
This figure is then used in combination with the percentage risk model to determine position size. This allows position sizes appropriate to the volatility for every instrument to be calculated and applied to the trading system. Stop-loss levels can also be arrived at without any subjective appraisal, as shown in the following example. While this example has been taken from the commodity markets, it can just as easily be applied to share prices.
Example 3
Sugar futures are trading at 13.00 cents per pound and the 14-day ATR is 0.18 cents per pound. Each one-cent move in sugar equals $1120:
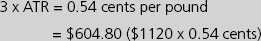
Stop-loss level = 13.00 − 0.54 = 12.46
Percentage risk: 2% × $100 000 = $2000
Position size: risk amount ($) ÷ 3 × ATR:

If the volatility as measured by ATR was higher, the initial stop-loss would be set much wider and the number of contracts able to be traded would be reduced, as in the following example.
Example 4
Sugar futures are trading at 13.00 cents per pound and the 14-day ATR is 0.55 cents per pound.
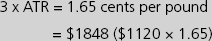
Stop-loss level = 13.00 − 1.65 = 11.45
Percentage risk = 2% or $2000

The shortcomings of this model are that stop-loss levels can have little relation to other potentially important price points. This may be just on key support and resistance areas, or in the middle of a previous day’s price range. The stop-loss may need to be adjusted in these circumstances, resulting in redoing the calculations to ensure the position size remains within the risk parameters specified in your trading plan.
Fixed ratio model
This strategy allows the trader to increase and decrease the number of contracts or shares being traded based on the profits generated from a trading strategy or system. When a system is performing well, position size is increased and when it is suffering a drawdown position size is decreased, based on the profits or losses being experienced. It is suited to smaller accounts because it allows trade size to increase faster than in the standard money management systems which increase trade size slowly at first, and then more rapidly as the account size grows. These money management methods tend to favour increasing position size at the ‘back-end’, while fixed ratio increases position size much more quickly at the early stages or ‘front-end’ of a trading system.
Increases to the number of contracts traded (for share traders, a ‘contract’ can be a fixed number of shares, such as 500) occur based on a dollar amount of profit. This number is called the delta. It is arrived at by determining the largest drawdown previously experienced by the system and then using, in general, half of this figure as the delta. This amount can be varied depending on how aggressive or conservative you wish to be.
Trading a system that has experienced a worst historical drawdown of, say, $10 000 would imply a delta of $5000. Applying fixed ratio to this system means that, after starting trading the system with one contract, a second contract can be added when the account accumulates profits of $5000 — the total account size is $15 000. Now trading two contracts, the trader needs to accumulate $10 000 (delta of $5000 × 2 contracts) in additional profits before a third contract can be added—the total account size is $25 000. The account needs to now reach $40 000 before a fourth contract is added. (Accumulated profits of $25 000 + $15 000 from three contracts make $5000 profit each.)
A similar approach is used when decreasing contracts during a drawdown or following a series of losing trades. The delta applied can be varied so that decreases in trade size occur faster than increases to allow profits to be protected. From the above example, instead of waiting for the account to decrease by $5000 before trading one less contract, the trader may decide to use $2500. If the account drops in value by $2500, the trader then trades one less contract.
Decisions, decisions and more decisions
The choice as to which money management strategy to use will come down to personal preference, risk tolerances and a range of other variables. The most important decision is to actually choose one and implement it from the outset of your trading. Understanding and using money management is the key to success in a trading business. It will allow you to capitalise on the times when your trading system or methodology is working well and generating profits by increasing trade size accordingly. It will also ensure you protect both profits and capital during losing streaks and periods of drawdown by reducing position sizes accordingly.
Early in my trading career, I turned a $10 000 account into well over $21 000 in about three to four months. I did so by increasing my trade size and going on a fairly solid run. However, the money management I was using was one of the more popular fixed fractional strategies. Two weeks after hitting this equity high, my account dropped to only $2500! I was overtrading. I was implementing the wrong money management strategy for the risk I was taking. Back in 2000, I began trading a system and took a $15 000 account into over $107 000 in just three months. However, for the remaining nine months of that year, this system went into a drawdown and never came out. Had I not been using money management, the account would have ended the year at a break-even. However, because of the money management, this account ended up over 100 per cent for the year. I chose this example because it reflects the example of doing well for a short period of time, and taking advantage of that despite the system falling apart. The end result was still tremendously positive. I also use this example because I was being very aggressive during the drawdown. A more conservative approach during the drawdown could have preserved a return of well over 350 per cent on the year when the underlying system made virtually nothing without money management.
Understanding money management and risk management will move you from the realm of the uneducated punter to the educated trader. Knowing exactly ‘how many’ you will buy or sell when your trade entry triggers are confirmed shifts you to a new level of professional money and trade management. You will no longer be guessing and exposing yourself to positions sizes that are either too large or too small for your account size. You will also be able to clearly define when to increase and decrease your position sizes in line with your total equity.
Ryan Jones took his first trade when he was 16 ... and lost. Being a super-competitive person, the ‘challenge’ was on. For the next five years, Ryan kept losing. There were many short-term successes, but they all ultimately ended in the red. At the age of 21, Ryan took six months off to analyse all of his trades and experiences. He made the startling discovery that would change forever how he approached trading—that money management is the key to long-term success. In this chapter, Ryan explained the importance of this discovery.
Ryan has recorded many impressive trading feats, and in his 22-year trading career has traded nearly every major market using a vast number of trading strategies. Ryan has developed over 1000 technical analysis-based systems and created advanced trading courses. He is the author of The Trading Game: playing by the numbers to make millions. Ryan is currently creating the most advanced technical analysis and system development software program to hit the industry: <www.smarttrading.com>.