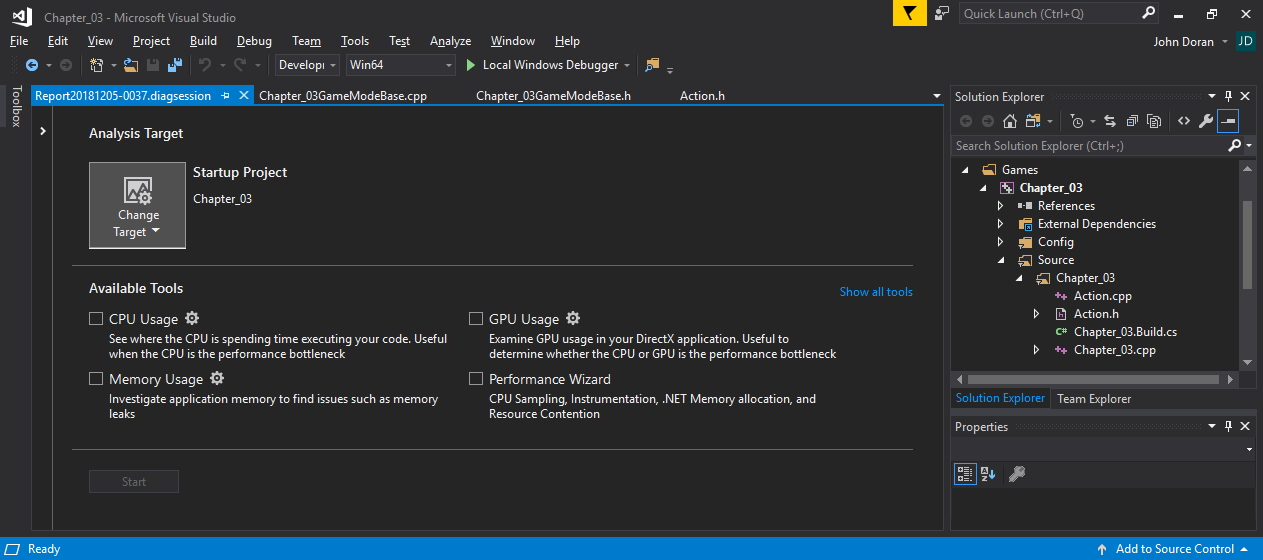
- Go to Debug | Performance Profiler...:

- In the dialog shown in the preceding screenshot, select the type of analysis you'd like displayed. You can choose to analyze CPU Usage, GPU Usage, Memory Usage, or step through a Performance Wizard to assist you in selecting what you want to see.
- Make sure to run the game without the editor and then click on the Start button at the bottom of the dialog.
- Stop the code after a brief time (less than a minute or two) to halt sample collection.
Do not collect too many samples or the profiler, as then it will take a really long time to start up.
- Inspect the results that appear in the .diagsession file. Be sure to browse
all the available tabs that open up. Available tabs will vary depending on the type of analysis performed.