To begin this chapter, allow me to repeat an important passage from the introduction to this book:
The Federal Reserve hikes interest rates, consumer confidence falls, war breaks out in the Balkans, drought shrinks the coffee crop in Brazil, oil prices spike sharply in Rotterdam, and the U.S. trade deficit reaches a new record high. Each of these macroeconomic waves—some of them thousands of miles away—will move the U.S. stock market in very different but nonetheless systematic and predictable ways. If you come to fully understand these macrowaves, you will become a better investor or trader—no matter what your style of investing or trading is. That’s the power of macrowave investing, and that’s what this book is about.
Well, the purpose of this part of this book is to illustrate in more detail those systematic and predictable ways the stock market and its sectors do indeed move in response to macroeconomic events. The overarching goal is to help you as a trader or an investor to use the flow of macroeconomic information to better time your trades and to better identify the sectors that you want to trade within.
To achieve this goal, we must undertake the at times difficult task of learning about each of the various macroeconomic indicators that are released on a weekly, monthly, or quarterly basis. To help you do this, I have organized the various indicators by the type of macroeconomic problem that each indicator is most closely associated with.
For example, in Chapter 13’s discussion of taming the recessionary bear, you will be introduced to two of the most important leading indicators of recession—declining housing starts and auto sales. Similarly, when we stalk the inflationary tiger in Chapter 15, you will come face to face with the Consumer Price Index and the Producer Price Index. But please note this about the way I’ve organized things. The segregation of the various indicators into specific chapters and specific problems will be, in many ways, a very artificial one. The fact is, at any given time, any one of the major economic indicators can provide important evidence on any given macroeconomic problem—be it inflation or recession or growth or productivity. So when we seek to read the indicator tea leaves as a means of improving our trading performance, we must always do so within the broader context of current economic conditions.
A huge spike in new jobs shattered expectations that the Federal Reserve Board will cut interest rates. The resulting stock sell-off sucked $182 billion out of market capitalization on the Nasdaq and the S&P 500. … The good news that began all of this bad news—the Labor Department this morning reported that unemployment in February fell to 5.5 percent, as the economy added 705,000 new jobs.
MONEYLINE
Does this quotation help you see why I am emphasizing the importance of context? In the Alice in Wonderland world of Wall Street, bad news can be good news and good news can be bad news, and only the economic context for this news can help us resolve these paradoxes.
For example, an increase in the unemployment rate or a decrease in industrial production or a fall in consumer confidence can all be very bad news for Wall Street and send stock prices plummeting if the economy has begun to soften. In that particular context, the Street’s primary fear is recession, and such bad news strongly reinforces this fear.
But here’s the perversity of it all: That same seemingly bad news—rising unemployment, falling production, and sinking consumer confidence—may also be embraced as very good news by the Street and send stock prices soaring if the economy is in the later stages of an expansion and inflationary pressures are high. In such a case, what the Street is most worried about is not economic stagnation but rather whether the Fed will raise interest rates. In that context, any signs of an economic slowdown can help assuage those fears and reassure the markets. So, as we move through these next several chapters examining the various economic indicators, please keep this crucial point about King Context always uppermost in your mind.
With that said, let’s complete two more tasks before diving into the thicket of economic indicators. One is to review the very important distinction between so-called leading indicators, lagging indicators, and coincident indicators. The other is to revisit the role of expectations in driving stock market prices.
A leading indicator provides us with a signal of what is about to come. For example, housing permits usually start to fall months before the economy actually enters a recession. Hence, housing permits are a leading indicator of recession, and macrowave investors love leading indicators because they are the best tools for prediction and anticipation of changing market and sector trends.
In contrast, a lagging indicator only changes direction after business conditions have changed. For example, the average duration of unemployment is considered to be a typical lagging indicator. This is because decreases in the average duration of unemployment invariably occur after an expansion gains strength, while the sharpest increases tend to occur after a recession has begun. In this sense, lagging indicators can only provide us with a confirmation of what has already begun to happen. Accordingly, lagging indicators are much less useful in a macrowave context—although they can be important in confirming changes in the trend.
As for so-called coincident indicators, these rise and fall, or coincide, with the trend and are designed to indicate the current state of the economy. Some examples include nonfarm payrolls, personal income, and industrial production. As with lagging indicators, macrowave investors find coincident indicators useful more for confirming than predicting trend changes.
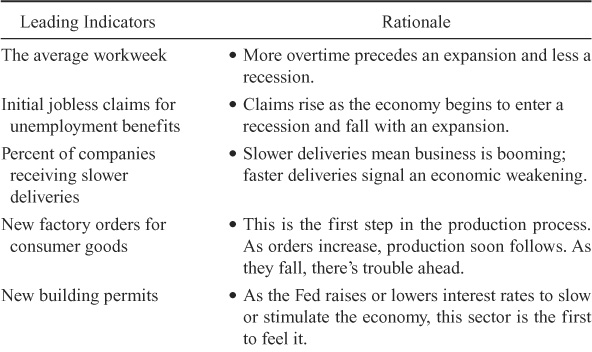
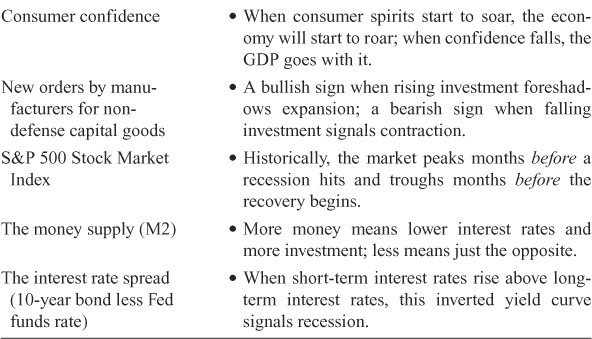
Now take a look at Table 12-1. It lists the major ingredients of the so-called Index of Leading Indicators. The nonprofit Conference Board releases this index during the first week of every month for the preceding two months. Note in the table that the left-hand column lists the specific indicators that make up the index, while the right-hand column provides a brief comment on why each item is considered a leading indicator.
TABLE 12-1. The Index of Leading Economic Indicators


Now chances are, if you have heard about any one macroeconomic indicator, the Index of Leading Indicators is the one. It certainly gets a lot of attention in the press. The irony, of course, is that the Index of Leading Indicators has a relatively poor track record accurately forecasting turns in the business cycle. In fact, one of my favorite jokes on Wall Street is that this index has predicted ten of the last five recessions. More important, this index has much less impact on the stock market than many of the other individual indicators we will soon discuss. The primary reason is that it is constructed from previously announced data, so that, in many ways, by the time the Index of Leading Economic Indicators is released, it is simply old news that the markets have assimilated. You will see what I mean in the next several chapters. But before we go there, let’s finish this chapter with a discussion of the critical role that expectations play when it comes to gauging the stock market’s reaction to economic data.
To better understand the critical role of expectations in moving stock prices, I want to introduce you to the technique of using so-called event studies to gauge the market’s reaction to new macroeconomic news. The essence of an event study is to compare stock market prices just prior to and just after a major unexpected macroeconomic event. Note that the most important word in that last sentence is the word “unexpected.” Here’s the issue.
Virtually all the best Wall Street professionals carefully watch the macroeconomics event calendar. As this “smart money” watches this calendar, it also forms expectations about the actual event. Indeed, this is a very highly developed ritual in which Wall Street’s analysts and economists regularly estimate and come up with consensus predictions about what the latest numbers to be released will be.
Now the bigger point here is that this smart money not only makes predictions, it also trades on that information prior to the actual event. Thus, if the consensus on Wall Street is that the Consumer Price Index is going to show a big increase, Wall Street’s smart money is likely to move out of the inflation-sensitive sectors and into more defensive sectors in the days—and perhaps even weeks—before the actual news hits. In fact, when the news hits and if the news meets expectations, the market is unlikely to react much at all. The reason: it already has.
That Wall Street trades heavily on expectations creates problems for the naïve statistician trying to gauge market reactions to macroeconomic events. In this particular example, suppose that Professor Simpleton were to look at prices just before the CPI was released and just after. Because nothing moved, he would conclude with a high degree of statistical significance that “inflationary signals appear to have no impact on stock prices.” Of course, this is nonsense. What Professor Simpleton has failed to notice is that the stock price movements have already taken place over some much more difficult-to-define time period—it might three days, four days, a week, or maybe even two weeks or a month.