CHAPTER 3
Regulated and Energy-Intensive Sectors
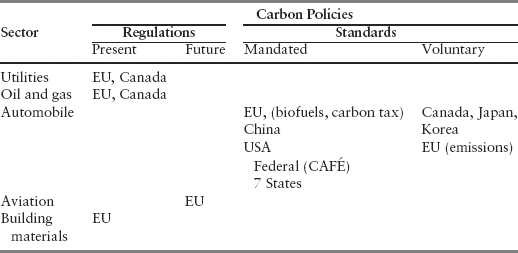
Climate change policies are anticipated to have an effect on a number of industries. The most sensitive sectors are either energy-intensive, including aviation and cement, or energy industries, such as oil, gas or coal, and power utilities, or those sectors that provide energy-consuming products, such as automobiles. The power industry, among others, is being heavily targeted by regulatory bodies as “large final emitters.” The transportation sector, which also emits a large percentage of CO2, is also being affected by government measures (Table 3.1).
TABLE 3.1 A Summary of Policies Affecting Selected Regulated Energy-intensive Industries
In Chapter 1, we defined carbon risks at the sectoral level as being either regulatory or physical. This chapter provides a brief outline of the risks and opportunities that climate change presents within sectors affected by government policies. Chapter 4 discusses the physical manifestations of climate change on a number of sectors, both regulated and unregulated.
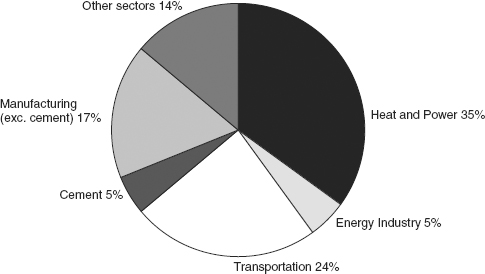
The power industry represents a major portion of global CO2 production (Figure 3.1). Measured in terms of economic importance and environmental impact, it is one of the most important sectors in the world. Nearly every aspect of industrial productivity and daily life are dependent on electricity, for which there is no reliable or adequate substitute. Interruption in energy supply can be highly disruptive, as illustrated by the California energy crisis of 2001–2002 and the August 2003 blackouts in eastern Canada and in the U.S. Northeast and Midwest.
FIGURE 3.1 Global CO2 production
Source: WBCSD 2005, The Cement Sustainability Progress Report, World Business Council for Sustainable Development, Geneva, www.wbcsd.org.
The greenhouse gases that power producers emit are directly related to the fuel mix used, as well as the efficiency of their plants. The emission factor per utility is defined in terms of its total emissions/total power generated (emissions kgCO2/generation MWh). As shown in Figure 2.2, a utility’s carbon intensity decreases as its fuel mix moves from coal and lignite to gas or nuclear.
The profile of the power industry has changed in recent years, as deregulation has led to major consolidations within this sector. In Europe seven producers now have a cumulative market share of 70 percent of generation. The United States has a mixed system, where rates are regulated even though some deregulation exists at the wholesale level. It is anticipated, however, that government policies will inevitably drive mergers and acquisitions in this sector in the United States.
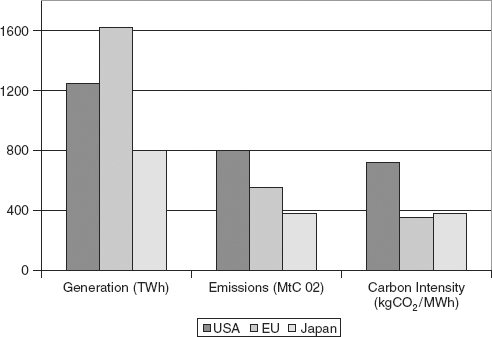
In Europe, 10 companies in the power and heat sector account for more than 60 percent of total emissions. The average emissions factor per utility in the EU is 353 kgCO2/MWh, while the same measurement for the United States is more than twice the EU average (720 kgCO2/MWh). Comparative figures for the Japanese grid indicate a carbon factor at about the same level as the EU in 2002 (379 kgCO2/MWh) (PricewaterhouseCoopers 2003).
Figure 3.2 illustrates not only the similarity of emissions between Japan and European Union (EU) markets, but also that the 10 largest European power producers generate 35 percent more power and emit 35 percent less CO2 than the 10 largest U.S.-based utilities. The differences between these countries’ utility carbon intensities lie in a combination of production efficiencies and the fuel mix of generation. From an efficiency perspective, thermal plants in Europe are 10 to 25 percent more efficient, on average, than their U.S. counterparts (PricewaterhouseCoopers and Enerpresse 2002).
FIGURE 3.2 Carbon intensity of power sector by region
Source: Based on data from PricewaterhouseCoopers and Enerpresse 2003: Climate Change and the Power Industry, www.pwcglobal.com and PricewaterhouseCoopers and Enerpresse. 2002. Climate Change and the Power Industry, www.pwcglobal.com.
Looking at the fuel mix used in the EU and the United States, coal-based generation exceeds 50 percent of U.S. output, whereas the EU has reduced its use of coal to approximately 35 percent. The balance of the difference is due to the use of nuclear (20 percent in the United States, 33 percent in Europe). In comparing similar figures for the EU and Japan, coal and nuclear play a greater role in the Japanese power sector, compared to the greater use of hydro and gas in Europe (PricewaterhouseCoopers 2003).
There is a need, however, to reconcile the growing demand for affordable and reliable electricity supplies with the necessity to reduce greenhouse gas (GHG) emissions. A number of options exist to address this imbalance. In the near term, fuel switching and increased efficiency of production can contribute to emission reductions. Government actions aimed at controlling GHGs from large final emitters are anticipated to accelerate the shift in resource use from coal to gas as the primary fuel used in power plants (Ling et al. 2004). Based on carbon prices of about €25 per metric ton CO2 within Europe, some forecasts predict that investments in new gas plants and writing off obsolete coal plants would be more than covered by increased operating profits arising from a predicted 40 percent rise in the wholesale price of electricity (Leyva and Lekander 2005). Others anticipate that a coal-to-gas transition would not take place before carbon prices reached €60/metric ton CO2 (Citigroup 2005).
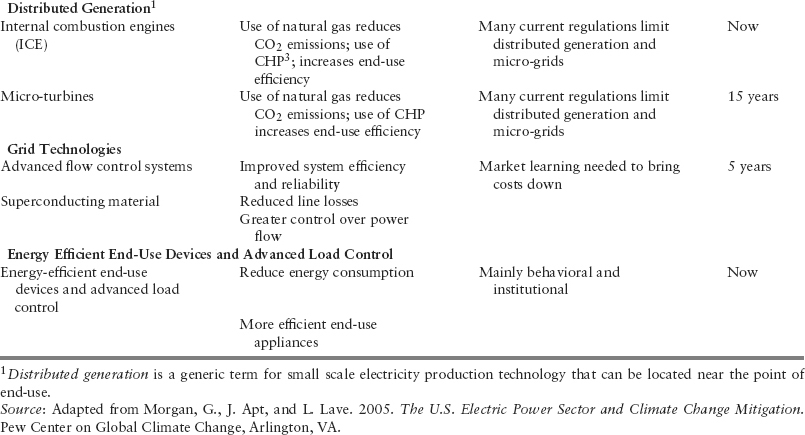
In the longer term, a gradual deployment of lower-carbon technologies and the expansion of renewable technologies, such as biomass, will contribute to improved carbon profiles for many utilities. Demand-side management also has a role to play in reducing the amount of electricity used. Table 3.2 summarizes the different points of entry (generation, grid, end user) and timing of where changes can be made to the energy industry (Morgan, Apt, and Lave 2005).
TABLE 3.2 Summary of Availability of New Technologies Affecting the Electricity Industry
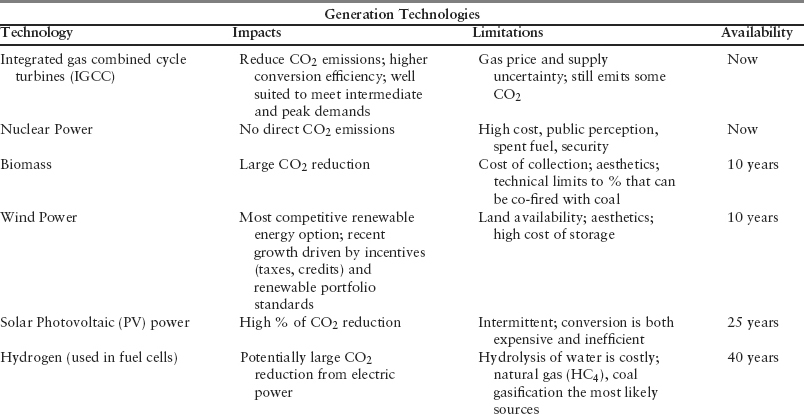
Most recently, two of these technologies, integrated gasification combined cycle (IGCC) and carbon capture and storage (CCS) have gained increased profiles in climate policy agendas within the European Union emissions trading scheme (EU ETS) and the Kyoto Protocol’s clean development mechanism (CDM).
The rapid economic growth that exists today in India and China is closely linked to an equally increasing demand for generating capacity and electricity. The greatest potential for large-scale cuts in CO2 emissions when coal is used is likely to come from a range of advanced technologies, including CSS combined with IGCC. In an IGCC system, coal being used to produce electric power is reformed, using steam, into a synthetic gas, which can be easily separated into a concentrated stream of CO2 and gaseous hydrogen. The hydrogen provides a clean, carbon-free fuel for combustion, distributed generation applications, or as a fuel for automobiles. The CO2 is sequestered by pumping it underground. CSS involves the capture of flue gases exiting the combustion chamber of large point sources, the stripping of CO2 from the gases and its subsequent storage in an underground geological reservoir. CO2 can be captured from sources including power stations, natural gas processing facilities, and steel and cement plants. This combination of IGCC and CCS can deliver power plant efficiencies in the region of 50 percent, with only 3 to 4 percent energy penalty for CO2 capture and handling.
In the CCS process, CO2 can be stored in geological reservoirs that are more than 800 meters below ground level, in depleted oil and gas reservoirs, deep saline formations both on and offshore, and can be used in enhanced oil recovery (EOR) and coal-bed methane retrieval processes. The oil and gas industry can offer a wealth of knowledge and experience both in storage of CO2 in depleted oil and gas fields and in the well-established use of CO2 for EOR. The capture and transport of carbon, in itself, requires energy and creates emissions, but net CO2 emissions are estimated to be cut to just 10 to 20 percent of a plant that does not use CCS. The electricity industry is anticipated to be one of the greater users of carbon capture and storage. (See Box 3.1.)
BOX 3.1 CARBON CAPTURE AND STORAGE (CSS) PILOT PROJECT BY VATTENFALL
The Swedish power company, Vattenfall, has taken the first step toward developing a commercial CCS system for carbon-free power generation based on coal. The institution is building the world’s first 30MW thermal pilot plant for CO2 capture near its lignite-fired power plant in Swartze Pumpe in Germany. It is scheduled for completion by 2008.
Among the different technologies that exist for CO2 capture, Vattenfall has chosen an “oxyfuel” combustion system, wherein oxygen is mixed with recycled flue gas containing CO2, and then used for combustion, resulting in a flue gas that contains only water and CO2. Their CO2 will be stored in subsurface geological sites, such as depleted oil and gas fields.
Source: Strömberg, von Gyllenpalm, and Görtz 2005.
Reflecting the growing importance of CCS technology, a U.K.-based Carbon Capture and Storage Association (CCSA) was officially launched in March 2006, with most of its members being in the energy sector. Its goal is to promote technology that can store CO2 permanently underground and to investigate incentives that would encourage such development. CCSA envisages working with the U.K. government to resolve any regulatory issues that may cause delays in the deployment of such new technology (www.ccsassociation.org).
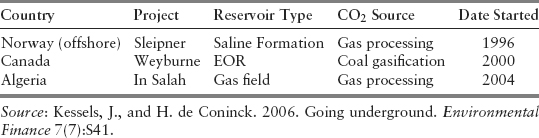
Three major geological CO2 storage projects are already in operation (Table 3.3). Each has the annual capacity to store approximately 1 million tons of CO2. Other companies, such as Shell and Statoil, have plans to capture CO2 in a new power plant in Norway and use up to 2.5 million metric tons per year of the CO2 for EOR in offshore fields near Norway. Two similar projects are proposed by BP in Scotland and California (Kessels and de Coninck 2006).
TABLE 3.3 Current Large-scale Carbon Dioxide Capture and Storage Projects
CCS has gained recent prominence, with the EU ETS and CDMs offering potential financial incentives for companies to implement more CCS power stations. Within the Kyoto Protocol framework, the application of CCS offers a great potential for carbon credit projects in China and India, as well as the possibility of developing markets for the export of clean coal technologies (Cook and Zakkour 2005). However, the two projects that have been submitted to be eligible under the CDM have provoked considerable debate.
At present, CCS technology is expensive, but further research and development could bring the costs down considerably. The EU ETS has set an incentive for the introduction of CCS on a large, commercial scale, but the economic viability of CCS will depend to a great extent on the price at which CO2 allowances are traded. A recent report by the Intergovernmental Panel on Climate Change (IPCC) (2005a) suggests that the use of such technology would only be economic when CO2 prices rise above $25 to $30 per metric ton. If technological costs remain high, new CCS technologies are not likely to be introduced commercially.
A further major challenge of making CCS commercially viable is the development of a legal framework for CO2 storage. At present, there are no regulations relating specifically to long-term responsibility for storage, although some global and regional environmental treaties on climate change and the marine environment may be relevant to the permissibility of CO2 storage (IPCC 2005a).
INTEGRATED OIL AND GAS INDUSTRY
At present, the oil and gas sector is undergoing profound structural changes. The globalization of the gas industry, the rise of new emerging market players, and the worldwide reach of investors’ involvement have all contributed to the creation of a more competitive and complicated industry. At the same time, companies within this sector are major emitters of GHGs, and as such are facing a number of challenges related to climate change risks. The industry is vulnerable to:
- Government mandates in areas such as gas flaring and facility abandonment.
- The direct impacts of adverse weather brought on by climate change (see Chapter 4).
- The shift away from oil toward natural gas in recent years, as natural gas is viewed as a cleaner fuel from a climate change perspective.
- The political and legal risks that confront companies within the sector as they seek new sources of reserves.
The major challenges in these areas are outlined below.
Government Mandates
- Gas flaring: Gas flaring is known to have a negative impact with respect to global warming and climate change. Nigeria and Angola, alone, account for approximately 15 percent of global gas flaring activity. To address this worldwide concern, West African governments have agreed to cease flaring activities in 2008. The rise in the global liquefied natural gas (LNG) industry has, however, allowed for an economically beneficial transition from flaring to exportation of LNG.
- Facility abandonment: The looming liability of decommissioning mature sites is expected to be significant as regulations governing the abandonment of facilities such as drilling platforms in the North Sea come into effect. However, such concerns have stimulated the industry to look at alternative uses for the platforms, such as offshore wind and wave power generation facilities (Ling et al. 2004).
Physical Capital
Volatile global weather conditions that are often associated with climate change have increasingly been found to interrupt activities in major oil and gas production in such areas as the Gulf of Mexico. The 2002 and 2004 hurricane seasons resulted in substantial losses of oil and gas production in this region. Then in 2005, Hurricanes Katrina and Rita wrought both physical loss and economic damage to the oil industry in the Gulf of Mexico, damaging oil rigs, temporarily knocking out 95 percent of its oil refining capacity and 88 percent of its natural gas production, and causing some production and refining capacity to be completely shut down (Laidlaw 2005). Indeed, the devastation is considered to be the world’s first “integrated energy shock,” which disrupted the flows of oil, natural gas, and electric power simultaneously (Yergin 2006).
Restricted Access to Oil and Gas Reserves
The oil and gas industry is also facing growing challenges in its attempts to gain access to new reserves. Political and legal risks have created uncertainty in the Middle East and in many potential new sources, such as Russia and Nigeria. In addition, increased energy prices have produced a resurgence of nationalist policies in oil-producing countries, with a return to a 1970s style of “resource nationalism.” Writing in the journal Foreign Policy, Thomas Friedman (2006) describes this inverse relationship between the price of oil and the pace of freedom as “the First Law of Petropolitics,” wherein the price of oil and the tempo of democratic reform always move in opposite directions in oil-rich states. This power shift has been observed recently in various forms:
- The Bolivian and Russian governments have taken outright control of oil and gas fields.
- Nigeria and Kazakhstan give highly preferential treatment to state companies over foreign installations.
- Ecuador seized the assets of Occidental Petroleum Corporation in May 2006 and raised taxes on oil companies to 50 percent when prices go above the levels stipulated in contracts.
- The Venezuelan government asserted its hold on 32 small oil fields developed by foreign companies and increased taxes from 56.6 percent to 83 percent.
There is concern that states, intent on taking over their oil industries, often cut back on exploration and production by diverting their newfound oil revenues to costly social, health, and education programs, as well as other necessary reforms. Lack of reinvestment in the industry erodes both exploration and production levels of the very resources that they are so eager to exploit. This effect has already been seen in Venezuela, where the government cut its oil export target for 2006 by 100,000 barrels a day.
In addition, these actions threaten to drive away foreign capital and future private investments in the oil industry, precisely when they need it most. Friedman (2006) expresses a further concern that such a swing in Petropolitics could have far reaching implications for global stability. Japan, for example, being the world’s third largest consumer of oil (after China and the United States) is heavily reliant on oil imports. With nearly 90 percent of its imports coming from the Middle East, Japan’s sources of supply becomes susceptible to Petropolitics, and may oblige Japan to overlook the actions of petro-authoritarians, such as Iran and the latter’s dedication to nuclear technology (Barta 2006).
Further constraints to development and production of oil and gas reserves are found in the difficulty of reaching their sources in technically remote regions such as the Arctic and Asia-Pacific. Goldman Sachs estimates that over 70 percent of future energy assets will come from non-OECD countries by 2012, up from 21 percent in 1970 and 42 percent in 2002 (Ling et al. 2004). Such projects will require not only traditional geological and technical skills, but also the ability to work with diverse partners, national oil companies, host governments, and nongovernmental organizations. This has certainly been the experience of Niko Resources Ltd., a Canadian company from Calgary, in its pursuit of gas reserves in Bangladesh. Niko has been involved in price disputes with the host government, and has had to meet angry villagers’ demands for compensation for gases that were leaking out in the marketplace. In the aftermath of a blowout, it suffered lawsuits, a frozen bank account, verbal attacks by citizens, and daily denunciations by the local media. Top executives at the company are quoted as saying that
it is of crucial importance to understand the political landscape when investing in a foreign country—and never to assume it is similar to Canada. (York 2006)
The oil and gas sector has encountered other challenges in gaining access to resources as communities in remote regions oppose increased production in their effort to protect pristine areas and fragile ecosystems. Past troubles encountered by Texaco in Ecuador, and Shell in Nigeria, herald future difficulties within the sector. Present-day constraints in this respect are seen in the Arctic National Wildlife debate within the United States and the Mackenzie River natural gas pipeline in Canada (Austin and Sauer 2002).
The transportation of oil and natural gas by tankers is also experiencing its own form of opposition. In Canada, Enbridge Inc.’s gateway pipeline project is encountering resistance to the prospect of its ships (bulk-liquid carriers) traveling through narrow channels off the coast of British Columbia, in order to export its oil sands crude to China (Ebner 2006). On the Canadian east coast, there is concern about the planned siting of an LNG terminal on the U.S. Passamquoddy tribal lands adjacent to Eastport, Maine. Proposals for LNG plants have been considered and rejected in other locations on the U.S. eastern seaboard because of their potential negative impacts on tourism. Now, the citizens of New Brunswick, Canada, are distressed about the choice of the St. Croix River as an LNG facility location, because of the effects of enormous tankers navigating through narrow Canadian territorial waters. Head Harbor and the Canadian side of Passamaquoddy Bay hold great importance for the region, with its aquaculture, lobster and fishing industries, and seasonal tourism (Norris 2005).
The Coming Age of Gas, and Beyond
Concerns over climate change and political instability in the Middle East, as well as advances in gas-to-liquid technologies, are seen to be driving the intensity of research and development in the gas sector. As previously discussed, about three-quarters of global proven gas reserves are in the former Soviet Union and the Middle East. Due to the political uncertainty in these regions, it is felt that potential political risk in these areas may not attract the massive investment needed to develop these industries. This may provide one explanation for the emergence of Qatar as the Middle Eastern kingpin of gas, while other areas such as Iran and Saudi Arabia remain largely untapped (Economist 2004b; Saunders 2006).
In the United States, demand for gas is growing at just below gross domestic product (GDP) levels, while oil demand growth is less than half of that. Consumption of gas in that country is predicted to overtake oil as early as 2015 as Americans seek a flexibility within their energy strategies to alleviate energy sourcing concerns. In addition, an increasing focus on climate change will accelerate this move to gas, since emissions from gas are 25 percent less than from oil, and 50 percent less than from coal (Ling et al. 2004).
To date, LNG has been the focus of the gas industry in the United States, with LNG imports projected to increase every year at an average rate of 8.6 percent. More recently, however, attention has been turning to gas-to-liquid (GTL) capacity (Box 3.2), notably in the Arabian emirate of Qatar, which has little oil but an abundance of natural gas. In 2006, Qatar Petroleum and South Africa’s Sasol opened a GTL facility that has the capacity to transform Qatar’s abundance of natural gas into a synthetic fuel similar to diesel. GTL diesel has a number of advantages over LNG: Vehicles can run on it, it does not require as much dedicated infrastructure as LNG, it is cheaper to ship than natural gas, and it can be shipped in normal tankers and unloaded at ordinary ports (Economist 2006d). Although the GTL industry is in its infancy, recent data regarding this middle-distillate process suggests that GTL could challenge traditional oil refinery production. In addition, GTL’s capability of producing nearly zero sulfur transportation diesel could accelerate the oil-to-gas transition. Thus, companies that dominate the global gas industry will have a distinct advantage in the markets in the near future (Ling et al. 2004).
BOX 3.2 GAS-TO-LIQUID TECHNOLOGIES AND STRATEGIC DIESEL FUEL
Gas-to-liquid (GTL) is a refinery process designed to convert natural gas or other gaseous hydrocarbons into longer-chain hydrocarbons. The GTL Fischer Tropsch process can produce a high-quality diesel fuel from natural gases, coal, and biomass. Using such processes, refineries can convert some of their waste products into valuable fuel oils, which can be sold as, or blended with, diesel fuel. This process is becoming increasingly significant as crude oil resources are depleted, while natural gas supplies are projected to last another 60 years. In addition, GTL fuel can be blended with noncompliant California Air Resources Board (CARB) diesel fuels to comply with more stringent diesel standards in regions such as California.
Source: Economist 2006d.
In the longer term, the focus of development in energy sources will be in the area of renewables from wind, solar power, wave, and biomass, as outlined in Chapter 2. At present, wind is the renewable source that is most economically viable. However, many energy companies have already made substantial investments in a variety of renewable energy projects, in response to both national and regional policy initiatives.
- In the EU, the United Kingdom requires 10 percent of U.K. electricity to be supplied by renewable sources by 2010.
- The sustainable energy industry in Australia is growing at about 25 percent per year (Innovest Strategic Value Advisors 2004).
- In the United States:
- Over 20 states have adopted Renewable Portfolio Standards, which mandate electricity suppliers to source a percentage of their power from renewables.
- Fifteen states have special “benefit funds” for renewable energy and energy efficiency.
- State policies for “net metering” have created markets for solar energy and other distributed generation.
- The Energy Policy Act (2005) renewed the Production Tax Credit for wind power and other renewables (Eckhart 2005).
- New policies have created a new status for fuel cell technologies. Connecticut, California, and Ohio, among others, have made significant financial commitments toward fuel cell development (Brooks and Barnett 2006).
Global Concerns Regarding Energy Security
The traditional interpretation of energy security had its beginnings during the 1973 oil crisis. Seen from energy-importing nations’ perspective, it was defined in terms of sufficient supplies at affordable prices, in the wake of the disruption of oil supplies from producing countries. Viewed from the energy-exporting countries’ standpoint, “energy security” focuses on “security of demand” for their exports, which generate the majority of their governments’ revenues. As discussed earlier in the chapter, political uncertainties have destabilized this confidence in some exporting countries, including Russia and Bolivia. More recently, power outages in North America and Europe, as well as chronic shortages of electricity in India and China, put a broader perspective on the meaning of energy security, both in terms of geographic range and the entire energy chain.
The destruction of infrastructure in the 2005 hurricane season in the United States presents another dimension of energy security, as large segments of its oil production (27 percent) and refining capacity (21 percent) were shut down. It also illustrates how fundamental the power grid is to the oil industry, as some refineries were unable to function, not because they were damaged, but because they lacked power to operate.
Thus, the definition of energy security must be expanded to acknowledge the globalization of the system and to recognize not only a dependence on secure and new sources of oil and gas, but also an understanding that the entire energy supply chain and its infrastructure needs to be protected (Yergin 2006).
Daniel Yergin of U.S.-based Cambridge Energy Research Associates suggests that, among other things, countries that are concerned about maintaining energy security must remain flexible and diversify their supply. In support of his thesis, Yergin quotes Churchill, who shifted the power source for British naval ships from coal to oil during World War I, while maintaining that “energy security lies in variety and variety alone” (Yurgin 2006, p. 1).
Despite the pessimism that exists in many countries regarding sources of energy and higher oil prices, the increase in cost does have the effect of making marginal opportunities for the development of alternate energy sources economically viable, thus attracting increased investments. As Table 3.4 illustrates, the feasibility of developing renewable energy sources is very much dependent on the price of oil. Unless the world experiences another price collapse, as occurred in 1985 and 1998, renewables such as cellulosic and corn-based ethanol, along with other alternative energy sources, will become economically viable.
TABLE 3.4 The Relationship of the Cost of Oil and the Development of Energy Sources
Source: Economist. 2006c. Steady as she goes: Why the world is not about to run out of oil. Economist, April 22–28, pp. 65–67.
| Cost of Fuel | Viability of Energy Source |
| $80 | Biodiesela |
| $60 | US corn-based ethanola |
| $50 | America’s shale oil |
| $40 | Canadian tar sands; Brazilian cane-based ethanol; gas-to- liquidsb; coal-to-liquidc |
| $20 | Conventional oil |
a Excluding the impact of tax credits.
b If gas feedstock price is $2.50 or less per m BTU.
cIf feedstock price is $15 per metric ton or less.
With changes in the economics of these energy sources, it appears that unconventional sources can become conventional over time.
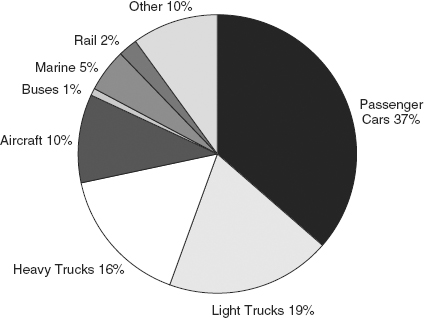
On a global scale, the transportation sector accounts for a major proportion of GHG emissions (see Figure 3.1). Within the sector, highway vehicles (passenger cars, light and heavy trucks) dominate both energy use and GHG emissions, with on-road transportation in the United States accounting for 72 percent of both measures (Figure 3.3). Air transport places a distant second with 10 percent, followed by rail, marine, and other forms of transportation.
FIGURE 3.3 Transportation GHG emissions by mode (2000)
Source: Greene, D., and A. Schafer. 2003. Reducing Greenhouse Gas Emissions from U.S. Transportation, Pew Center on Global Climate Change, www.pewclimate.org.
Automotive Industry
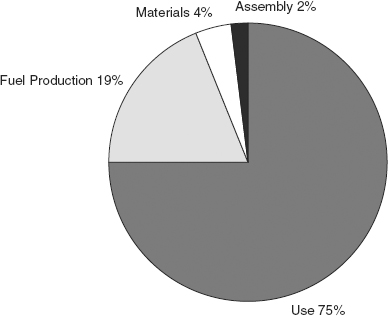
New regulatory pressures with respect to fuel economy and tailpipe emissions, along with rising consumer expectations for better fuel efficiency, have placed a competitive premium on auto manufacturers, who have developed strategies to address these challenges. Due to the carbon profile of a typical automotive vehicle (Figure 3.4), the primary force felt by the industry is to lower the carbon intensity of passenger cars (gCO2/ km) while increasing fuel economy during the use of their vehicles.
FIGURE 3.4 Emissions from life cycle of a typical vehicle
Source: Adapted from Weiss, M., J. Heywood, E. Drake, A. Shafer, and F. Au Yeung. 2000. On the Road in 2020: A Lifecycle Analysis of New Automobile Technologies, MIT Energy Laboratory Report #MIT L 00-003, Cambridge, MA, October.
Measures to encourage fuel efficiencies within the auto industry, seen in the form of regulations, standards, taxes, and fiscal incentives, are being felt in the EU, Canada, China, Japan, Australia, and some regional markets in the United States (see Table 3.5). In the European Union, the auto industry association ACEA1 signed a voluntary agreement with the government in 1998 to have manufacturers reduce CO2 emissions on new passenger cars by 25 percent by 2008, with a possible further 10 percent reduction by 2012. At the same time, all member states have imposed a tax on fossil fuels, creating an incentive for car buyers to choose lower consuming vehicles (Mettler, Wellington, and Hartmen 2005). Both the Korean (KAMA)2 and Japanese (JAMA)3 Manufacturers Associations have similar agreements with ACEA, which have been altered with respect to target ranges and time horizon, to meet different national capabilities.4 Together, the vehicles sold under the three separate agreements make up nearly 100 percent of total EU vehicle sales.
TABLE 3.5 Measures to Promote Fuel-efficient Vehicles around the World
Source: An, F., and A. Sauer. 2004. Comparison of Passenger Vehicle Fuel Economy and Greenhouse Gas Emission Standards around the World. Pew Center on Global Climate Change, www.pewclimate.org.
| Fuel Efficiency Approach | Country/Region | Measure |
| Fuel Economy Standards | U.S., Japan, Canada, Australia, China, Taiwan, South Korea | Numerical standards in mpg, km/L or L/100 km |
| GHG emissions standards | EU, California | g/km or gm/mile |
| High fuel taxes | EU, Japan | Tax 50%>crude oil base price |
| Fiscal incentives | EU, Japan | Tax relief based on engine size, efficiency, CO2 emissions |
| R&D Programs | US, EU, Japan | Incentives for technology and alternate fuels |
| Economic penalties | US | Gas-guzzling tax |
| Technology mandates and targets | California | Sales requirements for ZEVsa |
| Traffic control measures | Several U.S. states (hybrid HOV lanes) Paris (SUV ban) |
Hybrids allowed in HOVb lanes; ban on SUVsc |
aZEVs = California’s zero emission vehicles.
bHOVs = high occupancy vehicles.
cSUVs = sport utility vehicles.
In 2005, China introduced fuel economy standards for passenger vehicles that are considered to be more stringent than those in the United States. There are, however, important differences between these two countries regarding the maturity of their vehicle market and the likely success of their respective programs to dampen levels of vehicle gas consumption. The United States has a mature vehicle market that grew at only 3 percent a year from 1992 until 2002. China, by contrast, is an emerging market that experienced a vehicle sales growth rate of 50 percent in 2003, and is expected to grow at over 7 percent annually between 2005 and 2020. Included in the Chinese standards are encouragements to use more advanced vehicle technologies, and discouragements against heavier vehicles. Thus, China’s standards have the ability to bring about rapid changes and greater overall efficiency in their vehicle fleets than those in the United States (Sauer and Wellington 2004).
In North America, the United States uses CAFE5 standards that require each car manufacturer to meet specified fleet average fuel economy levels and CO2 emissions rates for cars and light trucks. In 2005, the state of California proposed its own set of GHG emissions standards for passenger cars, and in some cases, sports utility vehicles (SUVs) and large trucks. New motor vehicles sold in that state would be required to cut GHGs by about 30 percent by 2017 (Minerva 2005). California’s plan to reduce emissions from automobiles appears to be spreading across the United States as a number of other states6 followed suit. However, automakers in California have sued that state, alleging that the regulations on fuel efficiency fall under federal purview. They also claim that stringent regulations would impose unreasonable cost increases to car buyers and impede sales, because of the expensive technologies necessary to meet the mandate.
Further in the United States, the Pew Center on Global Climate Change (2006) has recommended that transportation be included in U.S. GHG reduction policies, since transportation is responsible for one-third of all that country’s CO2 emissions. In order to make the U.S. emission reduction program more comprehensive, the Center proposes the conversion of the existing vehicular mileage standards into CO2 standards that would measure the average CO2 emissions per mile for cars and light trucks. It suggests that manufacturers who “overachieve” would receive allowances that could be traded or banked. However, the report acknowledges that a system for tracking and reporting GHG emissions has to be established before such a plan would be viable.
Canada’s automobile industry has agreed to voluntarily follow the U.S. CAFE standards. However, the Canadian government has taken the standards one step further in announcing its goal of reducing CO2 emissions from all new passenger cars and light trucks by 25 percent by 2010 through decreased fuel consumption (Bustillo 2005).
It is difficult to make a direct comparison among different regions’ and countries’ vehicular standards, since they differ not only in form and structure, but also in terms of stringency, levels of measurement and implementation requirements (voluntary or mandatory) (see Table 3.6). Japanese and Chinese fuel economy standards are based on a weight classification system where vehicles must comply with the standards for their weight class. By contrast, the fuel economy standards in the United States depend on vehicle type, while in Taiwan and South Korea they are related to an engine classification system (An and Sauer 2004).
TABLE 3.6 Varying Global Vehicular Fuel Economy and GHG Standards
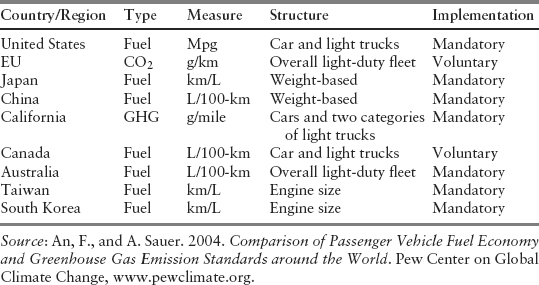
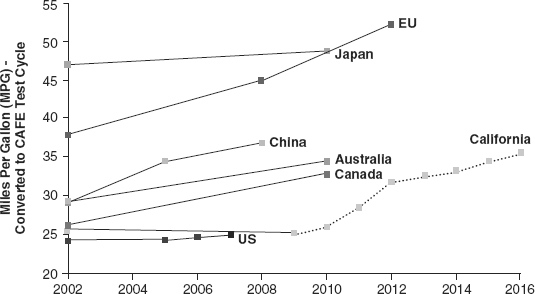
By normalizing the different fleet average fuel economy levels of these countries and regions by CAFE cycles, An and Sauer (2004) have, however, been able to demonstrate that the European Union and Japan have the most stringent standards, while the United States and Canada have the lowest standards, in terms of fleet-average fuel economy ratings. The new Chinese standards are more stringent than those in North America and Australia, but less so than the EU and Japan. It also shows that when the California GHG standards take effect, they would narrow the gap between the United States and the EU (Figure 3.5).
FIGURE 3.5 Comparison of fuel economy and GHG emission standards normalized by CAFE-converted mpg
Source: An, F., and A. Sauer. 2004. Comparison of Passenger Vehicle Fuel Economy and Greenhouse Gas Emission Standards around the World, www.pewclimate.org.
Factors Affecting Auto Manufacturers’ Carbon Profile
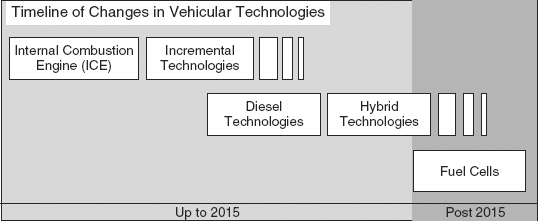
While a number of low-carbon technologies have been introduced into the traditional internal combustion engine (ICE), other technological advances are poised to challenge traditional gasoline vehicles and to improve an automaker’s carbon profile (Economist 2004a). The current popularity of diesel-fueled cars has resulted in some pollution reduction. Over the next decade, alterations in fuel mix and improved fuel efficiency, as well as some low-carbon innovations in diesel, hybrids, and fuel cell technology, have the potential to alter the competitive balance of the entire auto industry (Figure 3.6). With a view to the longer term, several auto manufacturers have established external partnerships and alliances that provide them with greater access to these new technologies.
FIGURE 3.6 Timeline of changes in vehicular technologies
Source: Minerva, L. 2005. Presentation at Climate change and Investment Conference, London, June 6–7.
From a fuel efficiency perspective, the use of biofuels (Box 3.3) holds some promise, having been already used for cars in countries in North and South America, as well as those within the European Union. The current surge in interest in biofuels is due to a number of governmental targets and incentives in the EU and North America that can be met by blending small amounts of biofuel with conventional fuels. In Europe, tax incentives were introduced for biofuels in 2003, in order to make them more competitive. The same year, the Biofuels Directive set targets for EU-wide biofuel use of 2 percent by December 2005 and 5.75 percent by December 2010, and called on member states to do the same. To date, France, Austria, and Slovenia have introduced mandatory requirements for fuel suppliers to sell a certain percentage of biofuels.
The U.S. 2005 Energy Bill included, for the first time, a set of mandatory national transportation targets, requiring fuels to include a certain percentage of biofuel. The Energy Bill also provides for a trading scheme, so that fuel suppliers can sell credits to firms that have not reached their required level. One advantage of such a mandatory system is that it can favor more environmentally friendly forms of biofuel production. The U.S. Energy Bill’s fuel standards, for instance, suggest that two and a half credits be awarded for every gallon of cellulose-based ethanol against one credit for the corn-based fuel. Within the United States, states such as Minnesota require E20 as a minimum (20 percent ethanol mixed with 80 percent gas).
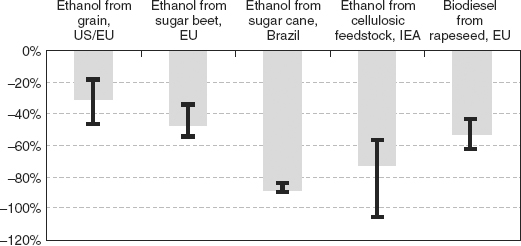
From an environmental perspective, not all biofuels have equal merit in reducing GHGs (see Figure 3.7) because the amount of energy required in its production varies with the feedstock used. Cellulosic feedstock, for instance, can produce ethanol with very low well-to-wheels7 GHG emissions, since it can use the noncellulose part of the plant (or lignan) as an energy source instead of fossil fuels.
FIGURE 3.7 Range of estimated greenhouse gas reductions from biofuels
Source: IEA. 2004. Biofuels for Transport: An International Perspective. International Energy Agency.
BOX 3.3 THE CONCEPT AND USE OF BIOFUELS
Bioethanol, which is chemically identical to other forms of ethanol, can be derived from sugar cane, grain, corn, and straw. More recently, biodiesel, which is derived mainly from vegetable oil, has also been developed. The use of these products, referred to collectively as biofuels, provide well-to-wheels7 GHG reductions on the order of 20 percent to 50 percent compared to petroleum fuels.
The concept of running cars on freshly harvested plant material rather than the fossilized version is not new. In fact, in the early part of the twentieth century, Henry Ford designed his Model T motor car to run on ethanol distilled from grain, as well as gasoline. In the 1970s, Brazil’s response to the oil crisis was to fuel cars with ethanol made from sugar cane.
One form of biofuel that is gaining increasing global attention is that of cellulosic ethanol, which is derived from waste products such as wood chips and agricultural debris, rather than from valuable crops such as corn. The production method for this type of feedstock uses powerful catalysts and enzymes to speed up the natural fermentation process of the cellulose. In his 2006 State of the Union address, U.S. President George W. Bush extolled the virtues of bioenergy, and promised to boost spending in support of new technology, which is designed to develop cellulosic ethanol to a commercial level within six years. Cellulosic biofuels are predicted to supply two-thirds of motor-fuel needs by the year 2050.
Source: Bulleid 2006; IEA 2004; Economist 2005a, 2006a, 2006b.
There is also a geographic disparity between regions of supply, where biofuels can be produced at the lowest cost, and regions of demand where the use of biofuels is increasing rapidly. The cost of producing bioethanol is less in tropical, developing countries where land and labor costs are lower, than in the more temperate, developed nations where energy requirements for production and refining are high. Within the EU, for example, there is a mix of sources of biofuel, with countries such as Spain depending on domestic production, while Sweden imports most of its ethanol from Brazil. The geographic and economic discrepancies for production do create opportunities for a potentially significant new source of international trade.
The economics of production in Brazil and other countries, such as India, are also becoming increasingly favorable. In Brazil ethanol is as much as 55 percent cheaper at the pump than regular gasoline. And thanks to Brazil’s auto revolution, flexfuel cars that run as readily on ethanol as on gasoline, have taken over the market since their introduction in 2003. Thus, Brazilians can fill up with ethanol, gasoline, or any combination of the two.
Biofuel production provides one opportunity to help diversify the agricultural sector away from subsidized food crops toward potential more useful energy crops, especially in tropical climates. Concern has been expressed in the EU, however, that the use of valuable agricultural land to produce biofuel feedstock would put pressure on the cost of food production.
A car manufacturer’s carbon profile is also affected by its product mix. Those that depend on greater sales and profits from carbon-intensive models such as SUVs and heavy, more powerful cars, are facing a greater challenge in responding to carbon constraints. Until recently, the automobile industry in the United States had relied principally on the sale of light trucks and SUVs to drive profitability. The sales of SUVs peaked, however, in 2000 due to consumer concerns about the environment, coupled with higher fuel prices (Economist 2005c; McKenna 2005).
In the EU, diesels accounted for 44 percent of all vehicles sold, a figure that is anticipated to reach 52 to 58 percent by the end of the decade (Austin et al. 2005). In the United States, the diesel market is quite a different story, where diesel-fueled cars are perceived as being dirty and noisy. A further disincentive to buying diesel is that the United States lacks the infrastructure to support this form of vehicular energy. Even in the United States, diesel does, however, have the potential to grow significantly.
Finally, taxes and fiscal incentives used in combination with fuel economy and GHG standards, as discussed above (Table 3.5), promoted an increase in fuel-efficient vehicles and have created a change in consumer preferences. Higher fuel taxes in the EU, for example, are considered to have contributed to the increase in small and fuel-efficient vehicle models in the EU market, as well as to fewer vehicle miles traveled. At the same time, the diesel market share increased significantly in the United Kingdom, after the car tax on CO2 emissions were raised from 18 percent to 27 percent in 2002. California’s zero-emission vehicle (ZEV) mandate is thought to have encouraged a large increase in research and development efforts in electric and hybrid cars, which switch between electric and conventional motors. New hybrid cars from Honda and Toyota are proving to be increasingly popular.
Aviation
In the last three decades of the twentieth century, a number of technological and operational efficiencies were made in commercial air travel that resulted in significant reduction in energy and carbon intensity within the industry. These gains, however, were offset by the rapid increase in air travel over the same period. Within the EU, overall CO2 emissions fell by 5.5 percent in the 1990s. What is notable, however, is that CO2 emissions from the international aviation sector of its 25 member states increased by 73 percent in the same period, and are projected to rise by 150 percent by 2012, according to the European environment commissioner. Domestic flights within the EU accounted for 0.8 percent of the total EU GHG inventory in 2003. If emissions from international flights were included, aviation’s share would increase to 3.3 percent (CE Delft 2005; Greene and Schafer 2003; IIGCC 2003; Lancaster 2005).
The aviation industry experiences a number of complexities with respect to carbon emissions, which are sector specific. One major complication arises from the fact that aviation’s contribution to total radiative forcing8 is proportionately greater than its actual emissions, due to the fact that airplanes’ emissions of GHG take place at higher altitudes than other industries that emit at surface level. A multiple of 2.7 is often used as a conversion factor for this effect (IIGCC 2003). A further issue for this industry is the effects of non-CO2 emissions on climate. In addition to CO2, emissions from flights also include nitrogen oxides (NOx) and vapor trails (contrails) all of which contribute to global warming. On the positive side, the industry has held one advantage, however, since it has been exempt from paying tax on fuel.9
To date, aviation has been excluded from the EU ETS. However, the European Parliament has been considering forms of fiscal measures to reduce emissions and manage increased demand over the next five years, and is currently examining ways of bringing this industry into the second phase (2008–2012) of its emissions trading scheme. Fuel and ticket taxation along with emissions trading and charges are among the policy options under consideration. In May 2006, the EU Environmental Committee proposed a stand-alone trading scheme for aviation that would run in parallel with, but be separate from, the EU ETS. Along with the allocation of allowances, the proposal calls for a tax on jet fuel, the ending of VAT exemptions for air transport, and for some policy instruments to cover the non-carbon dioxide components of aviation that also have climate impacts. The proposed scheme would coincide with Phase One of the Kyoto Protocol (2008–2012) and would cover all flights to and from EU airports (Carbon Finance 2006b).
The reasons for considering a separate ETS for aviation are fourfold:
1. Aviation is anticipated to be a net buyer of allowances which could have a significant impact on the price of carbon and trigger demands by other sectors for a looser cap on their emissions.
2. The Kyoto Protocol does not cover international aviation, so that any EU allowances allocated for it would not be backed by AAUs.
3. The 2008 date for starting the stand-alone scheme is earlier than current dates that are anticipated for aviation to join the EU ETS.
4. There are concerns over aviation’s non-CO2 contributions to global warming (vapor trails and nitrogen oxide emissions) not being taken into account by the EU ETS (Carbon Finance 2006b).
However, support for aviation joining the ETS is not unanimous. Although it was well received by some within the sector, such as British Airlines, it was slammed by aviation’s trade association, IATA10 (Lancaster 2005). Opinions also differ as to its impact on allowance prices. Industries outside the transportation sector fear that aviation would be net buyers of allowances, causing the price of carbon to rise, which in turn would have an effect on major energy consumers (European Commission 2005). A report from the Centre for European Policy Studies supports this concern and argues that the inclusion of aviation in the EU ETS could have a significant impact on allowance prices. It states that the sector would need to buy 1 to 2 percent of the total allowances available in the market, the same amount that this market is expected to be short in Phase One (2005–2007), thus affecting the price considerably (CEP 2006). Others anticipate that the cost of aviation joining the ETS will be modest, adding perhaps an additional €9 ($11) per return flight, depending on the strictness of the cap and on the individual airline’s emission levels, and that about 1 percent of the total allowances available in 2012 in the ETS would be bought by the aviation sector (CE Delft 2005; Lancaster 2005).
Unilateral action by the EU to include aviation in its ETS is seen as a problem for the industry. The first concern is that low cost carriers face the biggest financial risk. In addition, since the scheme would apply to domestic carriers whose flights are entirely within the EU, these airlines would also be disadvantaged, compared to carriers with more globally diversified routes. The nonequivalence of emissions at higher altitudes compared to those at ground level, as described above, is also seen to create a problem of fungibility within the trading scheme.
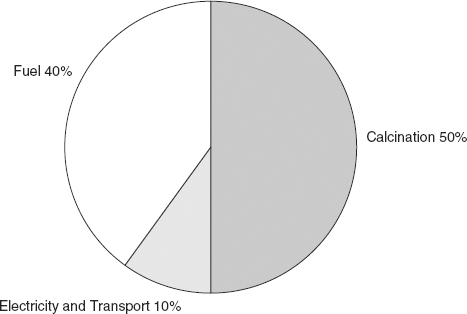
Building material manufacturers are feeling the pressure to adapt their processes and product characteristics to meet new and more stringent environmental demands. Within the broad spectrum of construction industries, cement production is estimated to contribute 5 percent of global man-made CO2 emissions (see Figure 3.1). Cement, and the concrete made from it, provides the basis for most infrastructures. Its use is growing rapidly in the developing world, and, indeed, after water, concrete is the planet’s second most used material globally (WBCSD 2005).
The manufacture of cement involves the quarrying of limestone, the use of energy to convert the limestone into clinker, and the emission of pollutants, principally CO2. Fifty percent of these emissions stem from chemical changes that take place in raw materials (as limestone is converted to clinker), and 40 percent from fuel combustion. The remaining 10 percent is divided between electricity use and transportation (see Figure 3.8).
FIGURE 3.8 CO2 production from the cement industry
Source: WBCSD 2005. The Cement Sustainability Progress Report. World Business Council for Sustainable Development, Geneva, www.wbcsd.org.
Since demand for cement is predicted to grow by 50 to 80 percent over the next two decades, cement manufacturers will have to reduce emissions by 30 to 40 percent per kilogram of cement in order to meet long-term Kyoto targets (WBCSD 2005). In 1999, the World Business Council on Sustainable Development (WBCSD), partnered with cement companies to initiate the Cement Sustainability Initiative (CSI). Its goal is to address a number of environmental and social issues, the foremost among these being emissions reductions, principally CO2.
Cement manufacturers can improve their carbon profile through both process and input changes. The process of making clinker as an intermediate product in cement production is highly carbon intensive. The amount of clinker content needed can be reduced if mineral rich by-products from other production processes, such as fly ash (from coal-fired power stations) and slag (from blast furnaces) are incorporated into the product. However, customers perceive this form of low-clinker cement as being of inferior quality, and have used it sparingly to date.
From a process perspective, there are currently two ways of making cement, each of which has a different energy requirement. The current, most widely used wet process consumes nearly twice as much fuel as the newer dry (precalciner) technology. However, changing the process is an expensive proposition, and scarcely justifiable if savings on fuel expenses are the only goal. Another opportunity exists from an energy recovery perspective, since cement kilns can use nonhazardous waste and biofuels as sources of energy. In Norway, cement kilns have been the preferred method of nonhazardous waste management for the past 10 years (WBCSD 2005).
Issues regarding the management of imports and exports in the cement industry depend very much on the price of carbon. Cement imports from production in non-EU countries hold a significant portion of the EU market and create a cap on cement sales price within the EU. This keeps the selling price of cement down and inhibits EU producers from recouping their rising costs attributed to the ETS. From an exporter’s perspective, EU seaborne cement exports become less economical with CO2 prices of €23/t as witnessed in the first phase of the EU ETS (2005–2007). A change in ratio of cement imports to exports has been suggested in order to improve cement producers’ financial positions. At this price of carbon, EU companies could reduce production and sell the CO2 allowances gained from the cutback. However, companies that hold excess capacity in operations outside the EU stand to benefit if the price of CO2 rises above €23/t (DrKW 2005).
COMPETITIVE IMPLICATIONS OF CLIMATE RISK IN REGULATED AND ENERGY-INTENSIVE SECTORS
Several institutions have explored the financial implications of carbon constraints on a selection of global industries. Table 3.7 summarizes the results of some of these studies. In all cases, the positive upper limits of financial impacts capture the opportunities that exist for companies to capitalize on proactive carbon management within each industry, while the lower negative limits reflect the risks for each sector within a carbon constrained economy.
TABLE 3.7 Financial Impacts of Carbon Constraint on Regulated and Energy-Intensive Sectors
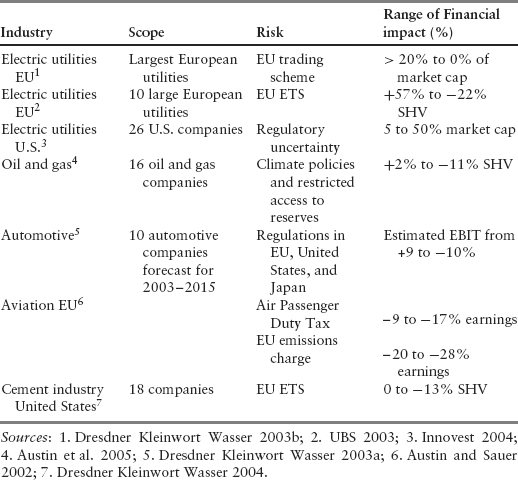
The impacts of carbon have been related to a variety of financial metrics, each of which highlights a different dimension of the carbon management challenge:
- Undisclosed environmental liability contributes to shareholder value risk.
- Examining a company’s carbon profile in terms of earnings before interest, tax, depreciation, and amortization (EBITDA) shows the company’s ability to withstand the impact of internalizing carbon costs, and thus is a commonly used measure of profit.
- The use of market capitalization allows investors to see how much carbon is associated with dollars invested (Henderson 2005b).
Policy impacts on the utility sector have been examined both in Europe and the United States. Within the European Union, the introduction of the ETS is seen to create a windfall for some utilities and to affect others adversely, depending on allocation of emissions permits and the cost of CO2 allowances. In the examination of different scenarios, researchers at Dresdner Kleinwort Wasser (2003b) consider that there will be little downside for utilities under the EU ETS, while analysts at UBS (2003) suggest some utilities will suffer under a tighter scenario, with positive equity valuations for others. Using a scenario approach to look at company prospects, UBS found that coal-based utilities, such as RWE, faced an uncertain future, with a spread of 70 percent in valuations. By contrast, British utility Scottish and Southern Energy (SSE) was stable with positive upside in all four scenarios, because it would receive a windfall benefit from free emissions allowances. In looking at the U.S. electricity sector, Innovest (2004) indicates that, even under a relatively conservative scenario, up to 5.1 percent of market capitalization could be at risk from the consequences of climate change without appropriate risk management. Under a higher, but still plausible, risk scenario, their calculations indicate that this risk figure could become 10 times greater.
An array of issues including regulations, energy demands, investor concerns, supply security, plus environmental and price pressures, are all placing demands on U.S. utility companies. Investment pressure on utility companies is increasing as investors express their concerns about regulatory uncertainty and price volatility facing the industry. Within the industry, concerns about security of supply are also spreading. Lack of investment in infrastructure has been identified as the leading cause of recent supply failures (blackouts) in the United States. At the same time, European companies become further involved within the Asia-Pacific region, Russia, and the former Soviet Union countries, in their hunt for gas and in their desire to build a presence in these emerging markets (PricewaterhouseCoopers 2005). The European Union, however, has renewed concerns regarding security of supply, as Russia’s Gazprom announced on January 1, 2006, that it was going to shut down the pipelines that supply Ukraine and western Europe with natural gas.
In study of the oil and gas sector, the World Resources Institute (2004) found systematic differences in earnings as companies responded to two major issues in the coming decade: first, the policies designed to combat climate change, which will have an impact on market demand and producer prices for crude oil, natural gas, and petroleum products; and secondly, the industries’ restricted access to oil and gas reserves, due to political instability or community opposition to industry development. The scenario study anticipated impacts on companies’ earnings in this sector to vary from marginally positive to a decline of −5 percent, depending on their oil-gas mix, their position in the value chain, and the location of operations and sales.
Using a scenario approach in a study of 10 companies in the automobile industry, the World Resources Institute (Austin et al. 2005) found significant differences of exposure. Honda emerged as having the smallest immediate risk from carbon constraint, due to its less carbon-intensive product mix (including hybrids). BMW had the largest risk. Toyota was ranked highest in its carbon management strategies, mainly because of its hybrid technology. The analysts concluded that the effect of carbon constraints on individual corporate earnings (EBIT) ranged from an increase of 9 percent to a decline of −10 percent. These findings reflect, not only the manufacturers’ response to regulations and consumer pressure, but also to energy price increases and market pressures in key emerging markets, such as in China. The report states further that a company such as Toyota, with its strong technological research in hybrid and other technologies, would have a distinct advantage in every scenario.
Also within the transportation sector, aviation is anticipated to incur financial challenges, with the degree of decline in earnings depending on increases in air passenger duties and the application of emission charges. These impacts are expected to vary depending on fleet size and whether companies are short- or long-distance operators (Austin and Sauer 2002). A DrKW study (2004) of the impact of EU ETS on the cement industry resulted in a reduced target share price on 8 out of 18 companies in the sector by up to 13 percent. Emissions from cement manufacture currently accounts for 5 percent of global emissions and are growing at 4 percent per year.
Sectors with high levels of carbon dioxide emissions are feeling the effects of climate change policy measures. Energy industries have been identified as “large final emitters” by Canadian, British, and European regulators. Although the United States is not a signatory to the Kyoto Protocol, many state-level initiatives have evolved that affect the energy sector. The transportation sector, which provides energy-consuming products, is also affected by measures that have been taken, or are being considered, by numerous governments. Recent studies indicate that there are winners and losers within each industry, where some companies have much larger financial exposures than others, either because of differences in asset base, voluntary measures they have undertaken, or other factors. The exposure of some companies is undoubtedly “material” within the meaning of the SEC disclosure rules (see Chapter 5). Carbon management strategies within carbon-regulated and energy intensive sectors do, then, influence the competitive balance within industries, and as such, hold significant implications for carbon finance.
1. ACEA (Association des Constructeurs Européens d’Automobiles) includes BMW, DaimlerChrysler, Fiat, Ford, GM, Porche, PSA Peugeot Citroen, Renault, and VW Group. The agreement commits the auto industry to reach an overall fleet average of 140 grams of CO2 per kilometer by 2008, with the possibility of extending the agreement to 120 gCO2/km by 2012.
2. KAMA (Korea Automobile Manufacturers Association) includes Daewoo, Hyundai, Kia, and Sangyong.
3. JAMA (Japan Automobile Manufacturers Association) includes Daihatsu, Honda, Isuzu, Mazda, Mitsubishi, Nissan, Subaru, Suzuki, and Toyota.
4. KAMA and JAMA had more lenient terms for reaching intermediate targets, and have an extra year to achieve the final goal of 140gCO2/km.
5. CAFE is the Corporate Average Fuel Economy standard.
6. The states that have adopted California’s standards for automobile carbon dioxide and other GHG emissions are Connecticut, Maine, Massachusetts, New Jersey, New York, Rhode Island, and Vermont.
7. Well-to-wheels refers to the complete chain of fuel production and use, including feedstock production, transport to the refinery, conversion to the final fuel, transport to refueling stations, and final vehicle tailpipe emissions.
8. Radiative forcing refers to the processes that alter earth’s atmospheric energy balance. These alterations can be caused by a change in the earth’s orbit, by volcanic activity, or by man-made emissions.
9. The Chicago Convention, which was established in 1947 by the International Civil Aviation Organization (ICAO), exempts the aviation sector from tax on fuel, either via a duty or a value-added tax (VAT).
10. IATA is the International Air Transport Association.