Appendices
APPENDIX 1: Chart of Numbered Days for a Calendar Year
|
Number for Each Day of the Year |
||||||||||||
|
Day |
Jan |
Feb |
Mar |
Apr |
May |
Jun |
Jul |
Aug |
Sep |
Oct |
Nov |
Dec |
|
1 |
1 |
32 |
60 |
91 |
121 |
152 |
182 |
213 |
244 |
274 |
305 |
335 |
|
2 |
2 |
33 |
61 |
92 |
122 |
153 |
183 |
214 |
245 |
275 |
306 |
336 |
|
3 |
3 |
34 |
62 |
93 |
123 |
154 |
184 |
215 |
246 |
276 |
307 |
337 |
|
4 |
4 |
35 |
63 |
94 |
124 |
155 |
185 |
216 |
247 |
277 |
308 |
338 |
|
5 |
5 |
36 |
64 |
95 |
125 |
156 |
186 |
217 |
248 |
278 |
309 |
339 |
|
6 |
6 |
37 |
65 |
96 |
126 |
157 |
187 |
218 |
249 |
279 |
310 |
340 |
|
7 |
7 |
38 |
66 |
97 |
127 |
158 |
188 |
219 |
250 |
280 |
311 |
341 |
|
8 |
8 |
39 |
67 |
98 |
128 |
159 |
189 |
220 |
251 |
281 |
312 |
342 |
|
9 |
9 |
40 |
68 |
99 |
129 |
160 |
190 |
221 |
252 |
282 |
313 |
343 |
|
10 |
10 |
41 |
69 |
100 |
130 |
161 |
191 |
222 |
253 |
283 |
314 |
344 |
|
11 |
11 |
42 |
70 |
101 |
131 |
162 |
192 |
223 |
254 |
284 |
315 |
345 |
|
12 |
12 |
43 |
71 |
102 |
132 |
163 |
193 |
224 |
255 |
285 |
316 |
346 |
|
13 |
13 |
44 |
72 |
103 |
133 |
164 |
194 |
225 |
256 |
286 |
317 |
347 |
|
14 |
14 |
45 |
73 |
104 |
134 |
165 |
195 |
226 |
257 |
287 |
318 |
348 |
|
15 |
15 |
46 |
74 |
105 |
135 |
166 |
196 |
227 |
258 |
288 |
319 |
349 |
|
16 |
16 |
47 |
75 |
106 |
136 |
167 |
197 |
228 |
259 |
289 |
320 |
350 |
|
17 |
17 |
48 |
76 |
107 |
137 |
168 |
198 |
229 |
260 |
290 |
321 |
351 |
|
18 |
18 |
49 |
77 |
108 |
138 |
169 |
199 |
230 |
261 |
291 |
322 |
352 |
|
19 |
19 |
50 |
78 |
109 |
139 |
170 |
200 |
231 |
262 |
292 |
323 |
353 |
|
20 |
20 |
51 |
79 |
110 |
140 |
171 |
201 |
232 |
263 |
293 |
324 |
354 |
|
21 |
21 |
52 |
80 |
111 |
141 |
172 |
202 |
233 |
264 |
294 |
325 |
355 |
|
22 |
22 |
53 |
81 |
112 |
142 |
173 |
203 |
234 |
265 |
295 |
326 |
356 |
|
23 |
23 |
54 |
82 |
113 |
143 |
174 |
204 |
235 |
266 |
296 |
327 |
357 |
|
24 |
24 |
55 |
83 |
114 |
144 |
175 |
205 |
236 |
267 |
297 |
328 |
358 |
|
25 |
25 |
56 |
84 |
115 |
145 |
176 |
206 |
237 |
268 |
298 |
329 |
359 |
|
26 |
26 |
57 |
85 |
116 |
146 |
177 |
207 |
238 |
269 |
299 |
330 |
360 |
|
27 |
27 |
58 |
86 |
117 |
147 |
178 |
208 |
239 |
270 |
300 |
331 |
361 |
|
28 |
28 |
59 |
87 |
118 |
148 |
179 |
209 |
240 |
271 |
301 |
332 |
362 |
|
29 |
29 |
88 |
119 |
149 |
180 |
210 |
241 |
272 |
302 |
333 |
363 |
|
|
30 |
30 |
89 |
120 |
150 |
181 |
211 |
242 |
273 |
303 |
334 |
364 |
|
|
31 |
31 |
90 |
151 |
212 |
243 |
304 |
365 |
|||||
|
Note: For leap years, the number of any day after February 28 is one plus the tabular number shown. |
||||||||||||
APPENDIX 2: State Real Estate Transfer Taxes
The following table presents information gathered by the Federation of Tax Administrators regarding state taxes levied on the sale or transfer of real property located in each state. Included in the chart are a description of the tax, the tax rate expressed as a percentage, and the amount of state revenues collected from state transfer taxes in 2004, expressed in dollars and as a per capita amount.
Key Findings of the FTA include:
• Thirty-five states plus D.C. impose a tax on the transfer of real property located in the state.
• Tax rates range from a low of 0.01% in Colorado to a high of 2.2% in D.C.
• In seven states and D.C., the state tax rate is 1.0% or greater.
• In about 2/3 of the states imposing the tax, the rate is below 0.5% of the value of the transfer.
• In California, Louisiana, and Ohio, real estate transfer taxes are imposed only at the local level.
• Some localities in Delaware, Maryland, Michigan, New Jersey, Pennsylvania, Washington, and West Virginia may impose a tax in addition to the state transfer tax.
Real estate transfer taxes (sometimes called deed recordation taxes) are imposed on the sale or transfer of real property located in the state. The tax is usually based on or measured by the consideration paid for or the fair market value of the real estate. The local official responsible for recording deeds to real estate commonly collects the tax, and it must be paid prior to the deed to the property being recorded. In a number of instances, the tax is paid and evidenced by the affixing of stamps to the deed. There is often a link between the real estate transfer tax and property tax administration. Information gathered in administering the real estate transfer tax is frequently used to ascertain the fair market value of parcels of property to assist in property appraisals and in conducting sales-assessment ratio studies.
In fiscal year 2004, real estate transfer taxes produced about $7 billion in state tax revenue, according to Census Bureau figures. In 15 states, the state transfer tax yielded less than $20 per capita in 2004. The yield at the state level, however, exceeded $100 per capita in Connecticut, Florida, New Hampshire, and Washington State, as well as the District of Columbia where the 2.2% rate generated nearly $500 per capita in 2004. The revenue yield is obviously determined by the tax rate, relative real estate prices, and in the case of D.C., the role of the commercial real estate market relative to the city as a whole.
The table presents state tax revenues as presented by the Bureau of the Census. Where a portion of the revenues is retained by local governments or where there are local transfer taxes, those revenues are not reflected here. Several states indicated their actual revenues differed somewhat from those reported by the Census Bureau. In the interest of consistency, Census Bureau figures were used. The figure reported by Census for Florida was reduced by 40% (as recommended by Florida) to reflect other stamp and document recordation taxes included in Census Bureau totals.
State Real Estate Transfer/Deed Recordation Taxes
|
State |
Description |
Rate in Percent |
2004 State Revenue ($000) |
2004 State Revenue Per Capita |
|
Alabama |
$.50 per $500 of property conveyed |
0.10% |
$45,080 |
$9.95 |
|
Arizona |
$2 per deed required to be recorded |
N/A |
N/A |
N/A |
|
Arkansas |
$3.30 per $1,000 of consideration in excess of $100 |
0.33% |
$25,972 |
$9.43 |
|
California |
Local taxes only |
N/A |
N/A |
|
|
Colorado |
$.01 per $100 of consideration in excess of $500 |
0.01% |
N/A |
N/A |
|
Connecticut |
1.25% of consideration paid if consideration exceeds $2,000; other rates for commercial transfers |
1.25% |
$175,816 |
$50.18 |
|
Delaware |
2 to 3% (depending on local tax) on transfers in excess of $100; 1% on contracts for improvements to realty in excess of $10,000 |
2.0 – 3.0% |
$98,566 |
$118.74 |
|
D.C. |
2.2% of consideration or fair market value |
2.20% |
$286,269 |
$485.20 |
|
Florida |
$.70 per $100 of consideration, except in Miami-Dade County where it is $.60 per $100 |
0.70% |
$1,950,402 |
$111.99* |
|
Georgia |
$1 for first $1,000 of consideration, plus $.10 per $100 of additional consideration |
0.10% |
$420 |
$0.05 |
|
Hawaii |
$.10 per $100 of consideration |
0.10% |
$18,426 |
$14.59 |
|
Illinois |
$.50 per each $500 of value or fraction of $50 |
0.10% |
N/A |
N/A |
|
Iowa |
$.80 per $500 paid for the real property transferred |
0.16% |
$13,869 |
$4.69 |
|
Kansas |
0.26% of debt or obligation secured by real estate |
0.26% |
$52,569 |
$14.59 |
|
Kentucky |
$.50 per $500 of value conveyed in deed |
0.10% |
$3,434 |
$0.83 |
|
Louisiana |
Local taxes only |
|||
|
Maine |
$2.20 per $500 of value conveyed – split between grantor and grantee |
0.44% |
$29,380 |
$22.31 |
|
Maryland |
0.5 percent of consideration paid for realty – also local deed recordation taxes ranging from $2.20 to $5.00 per $500 of value and local transfer taxes ranging up to 1.5% of consideration paid |
Variable depending on local rates |
$183,189 |
$32.96 |
|
Massachusetts |
$4.56 per $1,000 of consideration |
0.46% |
$245,906 |
$38.32 |
|
Michigan |
$3.75 per $500 of value for property being transferred plus local taxes of $.55 to $.75 per $500 of value |
0.75% |
$317,480 |
$31.39 |
|
Minnesota |
$1.65 plus .33% of value in excess of $500 plus .23% of debt secured by real estate for mortgage registry |
0.56% |
$352,354 |
$69.08 |
|
Nebraska |
$2.25 per $1,000 of value transferred |
0.23% |
$9,215 |
$5.27 |
|
Nevada |
$1.95 to $2.55 per $500 of consideration depending on population of county |
0.255% max. |
$96,704 |
$41.41 |
|
New Hampshire |
$1.50 per $100 of consideration split equally between buyer and seller |
1.50% |
$145,386 |
$111.82 |
|
New Jersey |
Four transfer fees – Basic is $1.25 state and $.50 county each $500 of consideration; additional fees range from $.25 to $4.30 per $500 of consideration; a fifth fee of 1% is imposed on buyers for an entire consideration in excess of $1 million for certain residential and farmland property |
1.21% max. if less than $1 million |
$246,503 |
$28.34 |
|
New York |
$2.00 per $500 of consideration. An additional 1% on transfers of a personal residence of more than $1 million |
0.4% on the basic tax, plus an additional 1.0% on residences over $1 million |
$510,443 |
$26.55 |
|
North Carolina |
$1 per $500 of consideration or value transferred with 51% of revenue retained at local level |
0.20% |
$54,940 |
$6.43 |
|
Ohio |
Local taxes only ranging from $.10 to $.40 per $100 of value |
0.4% max. |
||
|
Oklahoma |
$.75 per $500 of consideration |
0.15% |
$12,048 |
$3.42 |
|
Pennsylvania |
1% of consideration or fair market value with local transfer taxes of 1 to 3% |
4.0% max. |
$470,789 |
$37.95 |
|
Rhode Island |
$2 per $500 of consideration |
0.40% |
$12,645 |
$11.70 |
|
South Carolina |
$1.85 per $500 of value with $.55 per $500 retained at the local level |
0.37% |
$50,493 |
$12.03 |
|
South Dakota |
$.50 per $500 of consideration payable by grantor |
0.10% |
$141 |
$0.18 |
|
Tennessee |
$.37 per $100 of consideration, plus a mortgage tax of $.115 per $100 of indebtedness in excess of $2,000 |
0.49% |
$174,206 |
$29.52 |
|
Vermont |
1.25% of value of property transferred; lower rates on certain homes and farms |
1.25% max. |
$20,762 |
$33.43 |
|
Virginia |
$.25 per $100 of conveyance, plus $.50 per $500 of consideration for transfer of realty |
0.35% |
$340,591 |
$45.66 |
|
Washington |
1.28% of selling price, plus local tax of 0.3 to 0.5% |
1.33% max. |
$640,086 |
$103.17 |
|
West Virginia |
$1.10 per $500 of consideration, plus local taxes that may run to another $1.10 per $500 |
0.44% max. |
$10,129 |
$5.58 |
|
Wisconsin |
$.30 per $100 of value |
0.30% |
$66,325 |
$12.04 |
|
U.S. Total |
$6,615,458 |
25.33** |
||
|
* Revenue figures adjusted to eliminate taxes other than real estate transfers in the Census Bureau figures. ** U.S. Median Source: FTA compilation based on CCH, State Tax Handbook (2006), data from the U.S. Bureau of the Census, Governments Division, and information from individual states. |
||||
APPENDIX 3: Residential Property Tax Rates for the Largest City in Each State 2004
The real property tax is a function of housing values, real estate tax rates, assessment levels, homeowner exemptions, and credits. The effective rate is the amount each jurisdiction considers based on the assessment level used. The assessment level is a ratio of assessed value to assumed market value. Nominal rates represent the “announced” rates levied by the jurisdiction.
|
Effective tax rate per $100 |
Assessment |
Nominal |
||
|
City |
Rank |
Rate |
Level (percent) |
Rate /$100 |
|
Houston, TX |
1 |
2.99 |
100.0 |
2.99 |
|
Providence, RI |
2 |
2.97 |
100.0 |
2.97 |
|
Indianapolis, IN |
3 |
2.78 |
100.0 |
2.78 |
|
Bridgeport, CT |
4 |
2.73 |
70.0 |
3.90 |
|
Philadelphia, PA |
5 |
2.64 |
32.0 |
8.26 |
|
Manchester, NH |
6 |
2.64 |
100.0 |
2.64 |
|
Milwaukee, WI |
7 |
2.54 |
96.8 |
2.63 |
|
Baltimore, MD |
8 |
2.46 |
100.0 |
2.46 |
|
Newark, NJ |
9 |
2.30 |
94.7 |
2.43 |
|
Des Moines, IA |
10 |
2.21 |
48.5 |
4.56 |
|
Portland, ME |
11 |
2.20 |
82.0 |
2.68 |
|
Omaha, NE |
12 |
2.08 |
94.0 |
2.21 |
|
Jacksonville, FL |
13 |
1.98 |
98.0 |
2.02 |
|
Fargo, ND |
14 |
1.89 |
3.9 |
48.41 |
|
Detroit, MI |
15 |
1.86 |
27.8 |
6.71 |
|
Columbia, SC |
16 |
1.84 |
4.0 |
46.10 |
|
Chicago, IL |
17 |
1.74 |
22.1 |
7.88 |
|
New Orleans, LA |
18 |
1.74 |
10.0 |
17.40 |
|
Memphis, TN |
19 |
1.73 |
23.8 |
7.27 |
|
Boise, ID |
20 |
1.73 |
97.3 |
1.78 |
|
Atlanta, GA |
21 |
1.72 |
40.0 |
4.29 |
|
Jackson, MS |
22 |
1.71 |
10.0 |
17.09 |
|
Anchorage, AK |
23 |
1.63 |
100.0 |
1.63 |
|
Sioux Falls, SD |
24 |
1.56 |
85.0 |
1.84 |
|
Billings, MT |
25 |
1.55 |
80.0 |
1.94 |
|
Burlington, VT |
26 |
1.54 |
67.6 |
2.28 |
|
Salt Lake City, UT |
27 |
1.51 |
99.0 |
1.53 |
|
Columbus, OH |
28 |
1.49 |
30.3 |
4.91 |
|
Portland, OR |
29 |
1.43 |
64.2 |
2.23 |
|
Wilmington, DE |
30 |
1.39 |
51.2 |
2.71 |
|
Little Rock, AR |
31 |
1.38 |
20.0 |
6.90 |
|
Phoenix, AZ |
32 |
1.32 |
10.0 |
13.21 |
|
Wichita, KS |
33 |
1.31 |
11.5 |
11.43 |
|
Minneapolis, MN |
34 |
1.31 |
88.6 |
1.48 |
|
Albuquerque, NM |
35 |
1.27 |
33.3 |
3.80 |
|
Los Angeles, CA |
36 |
1.25 |
100.0 |
1.25 |
|
Boston, MA |
37 |
1.23 |
100.0 |
1.23 |
|
Oklahoma City, OK |
38 |
1.20 |
11.0 |
10.91 |
|
Kansas City, MO |
39 |
1.20 |
19.0 |
6.30 |
|
New York City, NY |
40 |
1.16 |
8.0 |
14.46 |
|
Charlotte, NC |
41 |
1.13 |
95.8 |
1.18 |
|
Louisville, KY |
42 |
1.10 |
90.0 |
1.23 |
|
Las Vegas, NV |
43 |
1.09 |
35.0 |
3.12 |
|
Virginia Beach, VA |
44 |
1.08 |
88.7 |
1.22 |
|
Seattle, WA |
45 |
1.03 |
94.1 |
1.09 |
|
Washington, D.C. |
46 |
0.96 |
100.0 |
0.96 |
|
Charleston, SC |
47 |
0.88 |
60.0 |
1.47 |
|
Birmingham, AL |
48 |
0.70 |
10.0 |
6.95 |
|
Cheyenne, WY |
49 |
0.68 |
9.5 |
7.11 |
|
Denver, CO |
50 |
0.53 |
8.0 |
6.69 |
|
Honolulu, HI |
51 |
0.38 |
100.0 |
0.38 |
|
Unweighted Average |
(X) |
1.62 |
59.3 |
6.29 |
|
Median |
(X) |
1.54 |
(X) |
(X) |
|
SYMBOL X implies not applicable |
||||
Source: Government of the District of Columbia, Office of the Chief Financial Officer, Tax Rates and Revenues, Tax Burden Comparisons, Nationwide Comparison, 2004. http://cfo.dc.gov/cfo/frames.asp?doc=/cfo/lib/cfo/services/studies/City04STUDY.pdf\
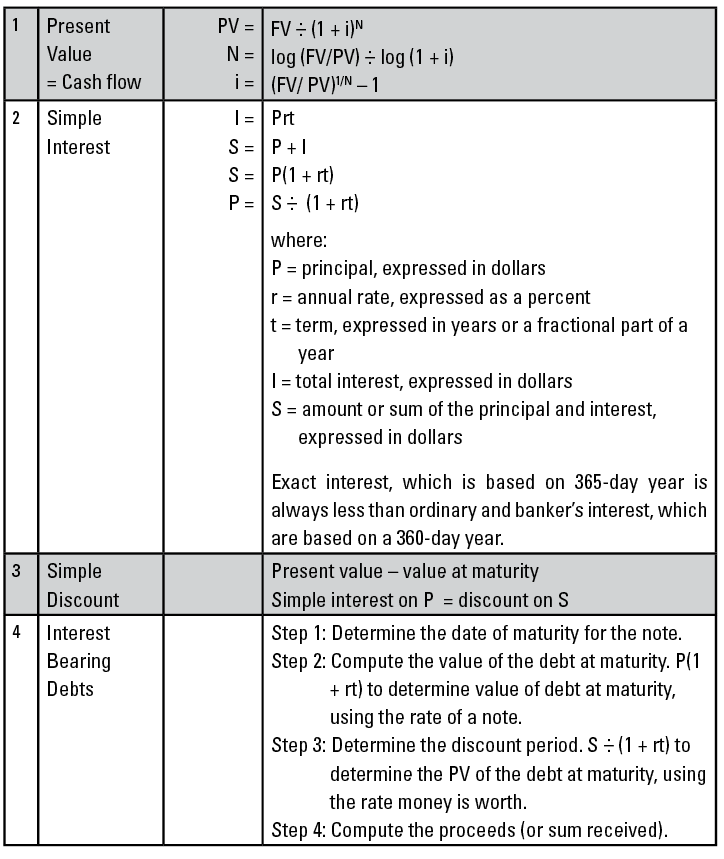
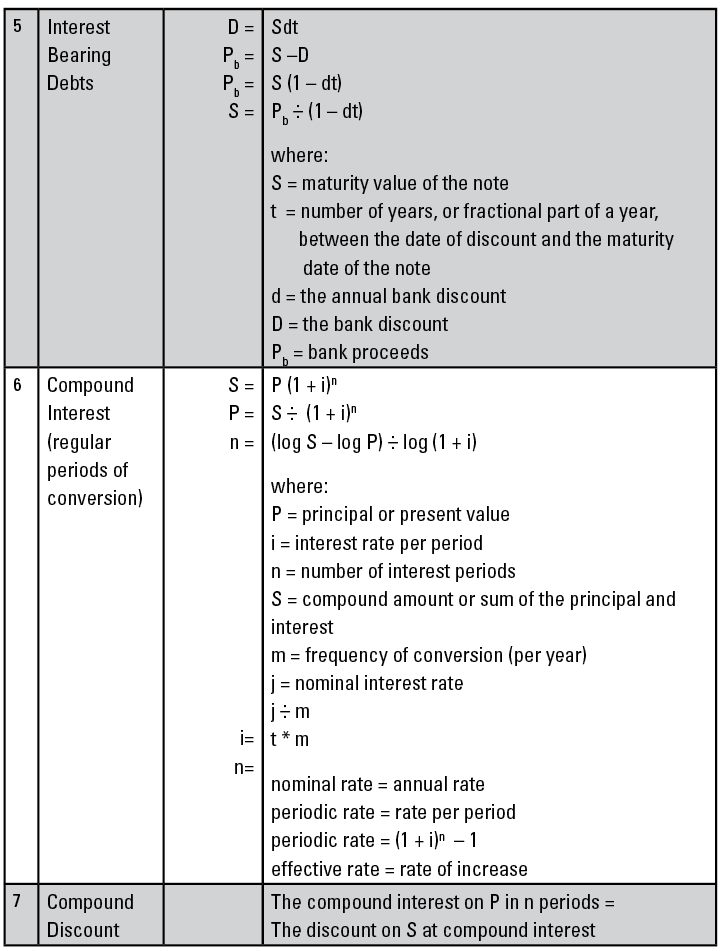
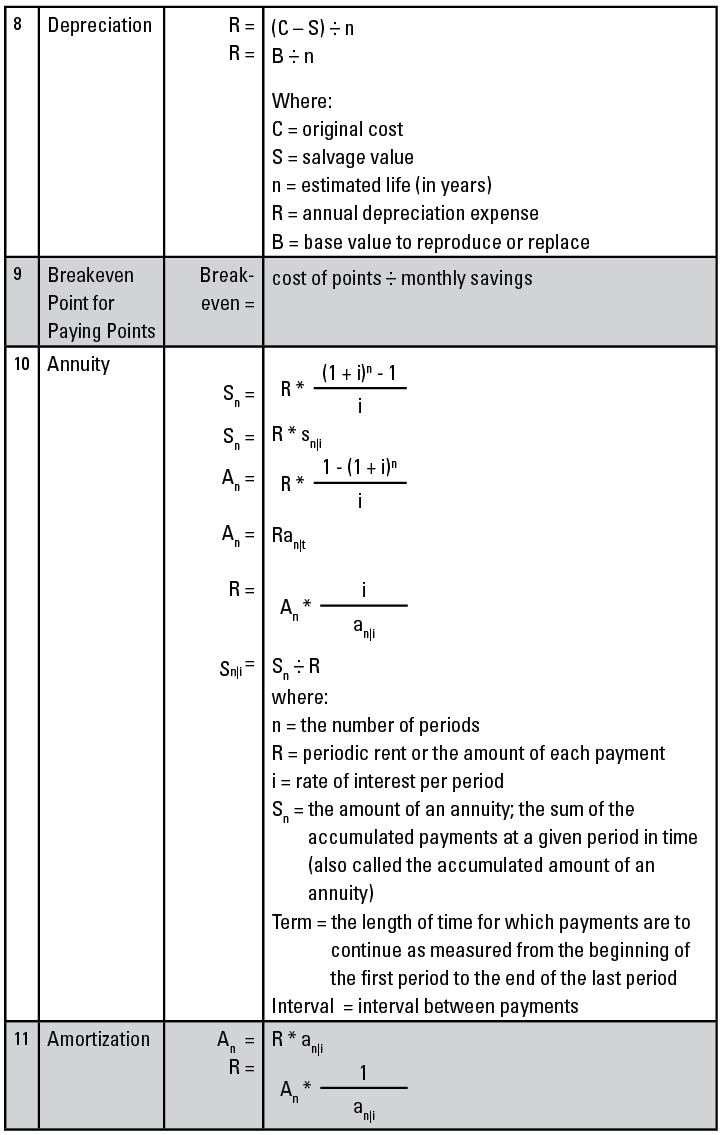
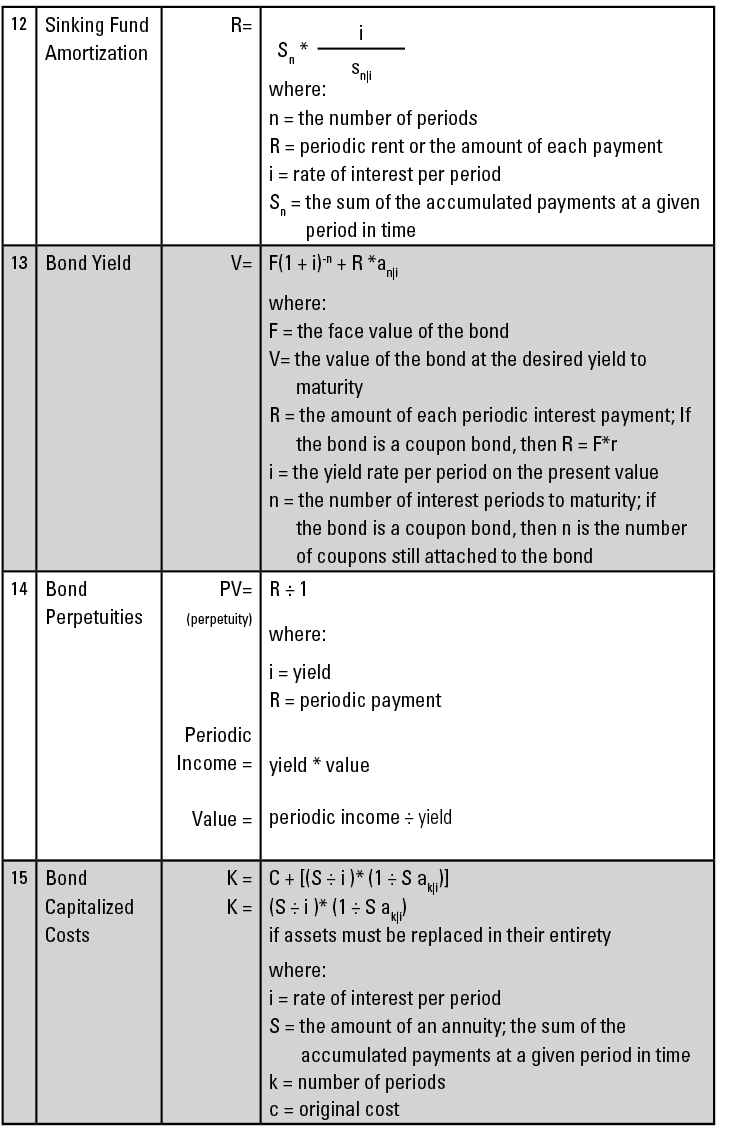
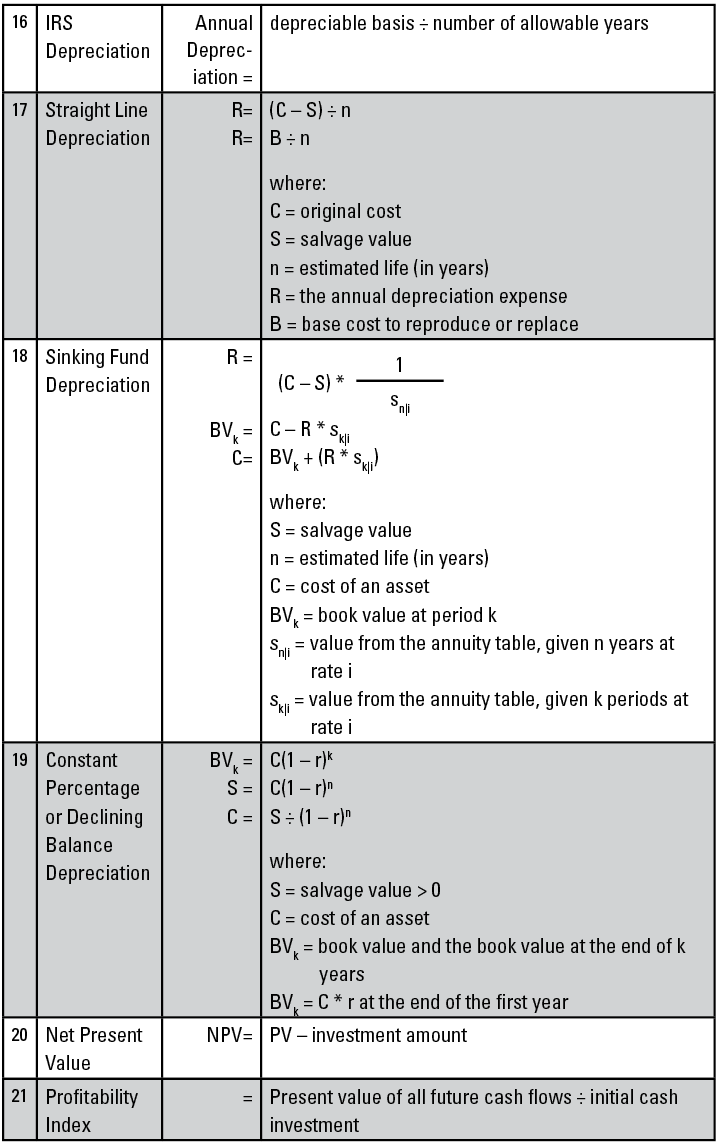
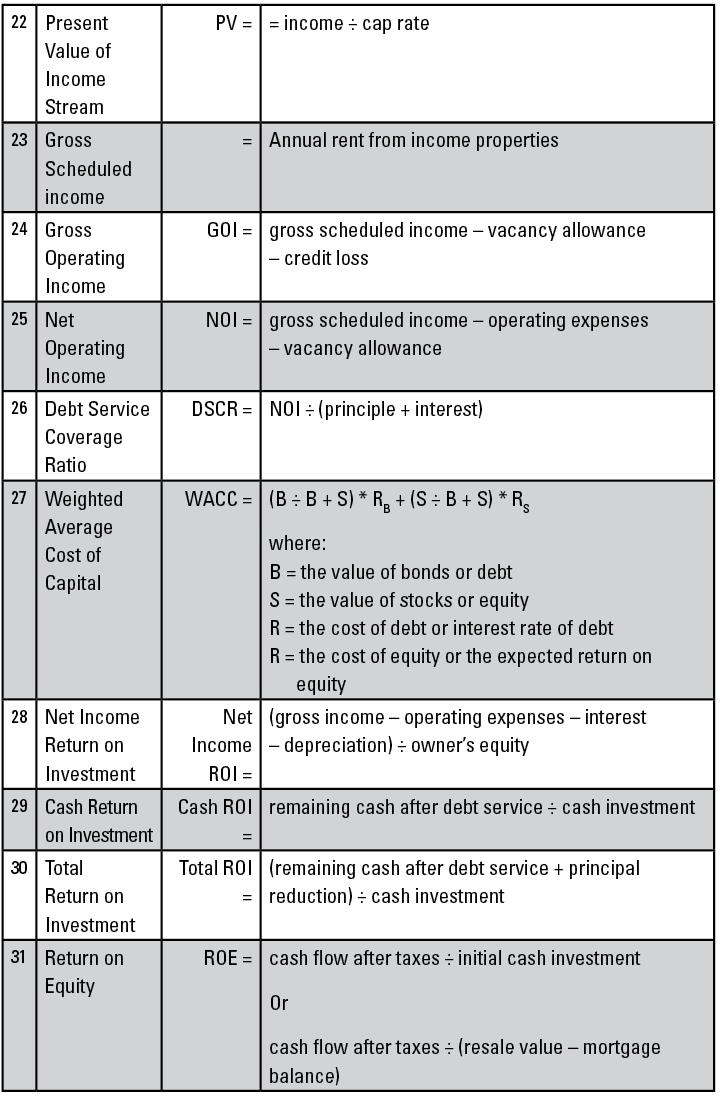
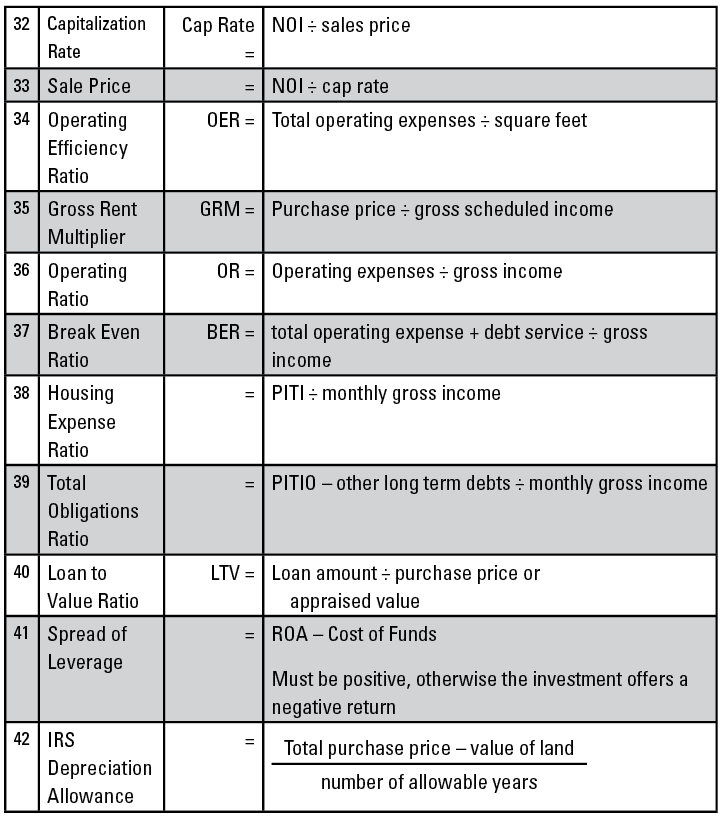
APPENDIX 4: Investment and Real Estate Formulas at a Glance