Chapter 7: Excel Functions
Many of the computations presented in this book may be performed using the Microsoft® Excel spreadsheet or some other familiar spreadsheet package. A spreadsheet may eliminate the sometimes time consuming task of performing computations by hand. Excel provides an array of built in functions that will assist the user in building a formula. A function is a predefined equation that operates on one or more variables and returns a single value. Excel includes several hundred functions in different categories.
Excel processes functions that are expressed with a specific syntax or structure. The syntax includes abbreviated words that serve as the function name and arguments to the function. For example, the syntax for the function that returns the number of periods for an investment is NPER. The syntax of the NPER function is as follows:
NPER(rate,pmt,pv,fv,type)
The inputs to the function are the variables enclosed in parentheses. These variables are called arguments of the function. The arguments are rate, payment amount, present value, future value, and type. A value must be specified for each argument, and a comma must separate those arguments. When an argument is zero, the zero need not be specified, but the comma must still be included. If the pmt argument, for example, is equal to zero, the syntax of the function would be as follows:
NPER(rate,,pv,fv,type)
Note that two commas are included in succession to represent the null argument. More advanced Excel users may input functions directly from the keyboard, but Excel provides a built in tool to build such functions.
To access Excel’s built in functions, choose “Functions” on the Insert menu pull–down box and a new widow will appear as shown in Figure 6. The left pane of the window will show the categories of functions available, and the right windowpane will show all available functions under a specific category of functions. Choosing the “Financial” category of functions on the left pane provides access to the functions listed in the table below:
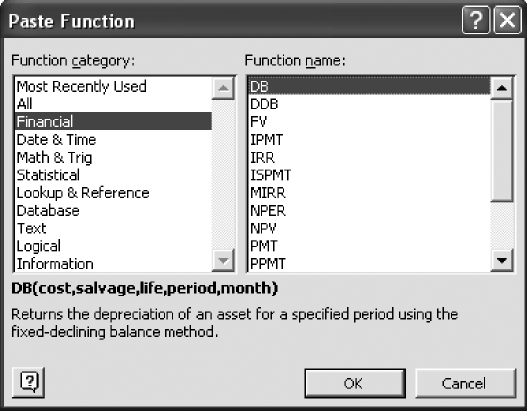
Figure 6: Excel Insert Functions Window
Once a particular function is chosen, a new window appears that allows the user to input variables to satisfy the function, as shown at Figure 6. The “tab” key is used to move from one input variable to another. Note that values are input without the use of dollar signs and commas. To assist users in inputting the proper values, Excel provides an explanation of each of the input variables in the lower pane of the window. The cursor must be in an input box before the explanation for that variable appears. In addition, the result of the function is visible in the lower pane so that the user may see the answer and make modifications, if necessary, before actually adding the result to the worksheet page. Users must click the “OK” button to have the result placed on the worksheet page. The result will be placed on the worksheet in the cell the cursor was occupying before inserting the function.
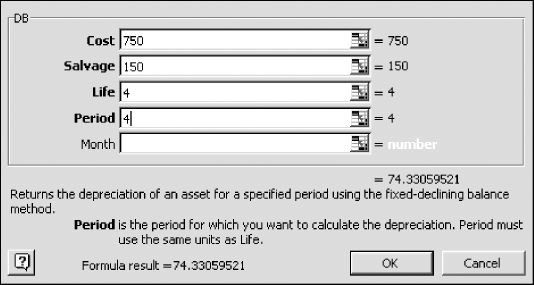
Figure 7: Excel DB Function Window
The DB function computation shown in Figure 7 indicates that an asset that cost $750 with a salvage value of $150 and a life of 4 years has a depreciation amount of $74.33 at the end of 4 years. No value is input for the Month variable since the default value is 12. The more experienced Excel user would be capable of inputting the formula directly into the worksheet cell. The formula created from Excel’s built in formula generator is:
=DB(750,150,4,4)
Example:
We will use the FV function to find the future value of an investment. The amount of $2,200 is compounded for 8 years at 5(1/2)%, converted semiannually, and entered into the formula at Figure 8. The input variables are rate, number of payments, payment amount, present value, and type. Not all the input values need to be defined to solve this particular problem. We have not established a payment amount. Note that Excel requires present value to be expressed as a negative number. From an investment perspective, PV represents outgoing money while FV represents incoming money. The future value of $2,250 is calculated as $3453.04. The equivalent formula is:
=FV(0.055,8,,-2250)
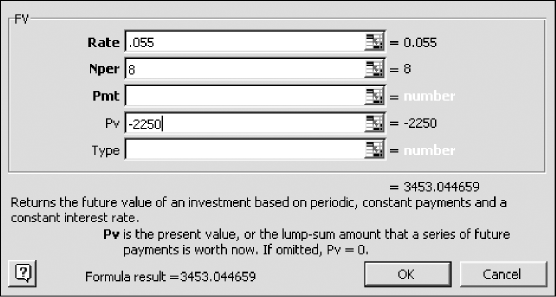
Figure 8: Excel FV Function Window
The input may be a single value or range of data. In Excel, data is arranged in columns or rows on a worksheet. These columns and rows of data may serve as the input range for computations. Columns and rows of data may be given names, called range names, which are used as arguments in Excel functions.
There are two ways to create a name range. The first is to select the range of cells to be named. Click the Name box, type in an unused range name, and press enter. Range names must begin with a letter and cannot include spaces.
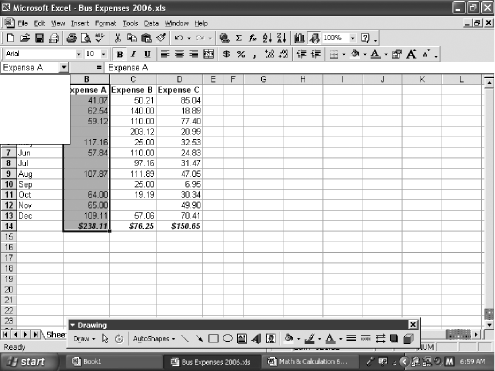
Figure 9: Create a Range Name Using the Name Box
The other way to create a range name is to use the Create command from the Insert pull down menu on the toolbar.
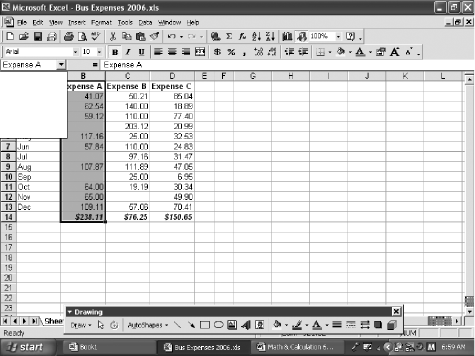
Figure 10: Create a Range Name Using the Insert Command
Microsoft® Excel provides the following financial functions. However, a number of Excel templates can be found online that provide functions specific to real estate analysis and other disciplines.
|
ACCRINT |
Returns the accrued interest for a security that pays periodic interest |
|
ACCRINTM |
Returns the accrued interest for a security that pays interest at maturity |
|
AMORDEGRC |
Returns the depreciation for each accounting period |
|
AMORLINC |
Returns the depreciation for each accounting period |
|
COUPDAYBS |
Returns the number of days from the beginning of the coupon period to the settlement date |
|
COUPDAYS |
Returns the number of days in the coupon period that contains the settlement date |
|
COUPDAYSNC |
Returns the number of days from the settlement date to the next coupon date |
|
COUPNCD |
Returns the next coupon date after the settlement date |
|
COUPNUM |
Returns the number of coupons payable between the settlement date and maturity date |
|
COUPPCD |
Returns the previous coupon date before the settlement date |
|
CUMIPMT |
Returns the cumulative interest paid between two periods |
|
CUMPRINC |
Returns the cumulative principal paid on a loan between two periods |
|
DB |
Returns the depreciation of an asset for a specified period using the fixed-declining balance method |
|
DDB |
Returns the depreciation of an asset for a specified period using the double-declining balance method or some other method you specify |
|
DISC |
Returns the discount rate for a security |
|
DOLLARDE |
Converts a dollar price, expressed as a fraction, into a dollar price, expressed as a decimal number |
|
DOLLARFR |
Converts a dollar price, expressed as a decimal number, into a dollar price, expressed as a fraction |
|
DURATION |
Returns the annual duration of a security with periodic interest payments |
|
EFFECT |
Returns the effective annual interest rate |
|
FV |
Returns the future value of an investment |
|
FVSCHEDULE |
Returns the future value of an initial principal after applying a series of compound interest rates |
|
INTRATE |
Returns the interest rate for a fully invested security |
|
IPMT |
Returns the interest rate for a fully invested security |
|
IRR |
Returns the internal rate of return for a series of cash flows |
|
ISPMT |
Calculates the interest paid during a specific period of an investment |
|
MDURATION |
Returns the Macauley modified duration for a security with an assumed par value of $100 |
|
MIRR |
Returns the internal rate of return where positive and negative cash flows are financed at different rates |
|
NOMINAL |
Returns the annual nominal interest rate |
|
NPER |
Returns the number of periods for an investment |
|
NPV |
Returns the net present value of an investment based on a series of periodic cash flows and a discount rate |
|
ODDFPRICE |
Returns the price per $100 face value of a security with an odd first period |
|
ODDFYIELD |
Returns the yield of a security with an odd first period |
|
ODDLPRICE |
Returns the price per $100 face value of a security with an odd last period |
|
ODDLYIELD |
Returns the yield of a security with an odd last period |
|
PMT |
Returns the periodic payment for an annuity |
|
PPMT |
Returns the payment on the principal for an investment for a given period |
|
PRICE |
Returns the price per $100 face value of a security that pays periodic interest |
|
PRICEDISC |
Returns the price per $100 face value of a discounted security |
|
PRICEMAT |
Returns the price per $100 face value of a security that pays interest at maturity |
|
PV |
Returns the present value of an investment |
|
RATE |
Returns the interest rate per period of an annuity |
|
RECEIVED |
Returns the amount received at maturity for a fully invested security |
|
SLN |
Returns the straight-line depreciation of an asset for one period |
|
SYD |
Returns the sum of years’ digits depreciation of an asset for a specified period |
|
TBILLEQ |
Returns the bond-equivalent yield for a Treasury bill |
|
TBILLPRICE |
Returns the price per $100 face value for a Treasury bill |
|
TBILLYIELD |
Returns the yield for a Treasury bill |
|
VDB |
Returns the depreciation of an asset for a specified or partial period using a declining balance method |
|
XIRR |
Returns the internal rate of return for a schedule of cash flows that is not necessarily periodic |
|
XNPV |
Returns the net present value for a schedule of cash flows that is not necessarily periodic |
|
YIELD |
Returns the yield on a security that pays periodic interest |
|
YIELDDISC |
Returns the annual yield for a discounted security; for example, a Treasury bill |
|
YIELDMAT |
Returns the annual yield of a security that pays interest at maturity |