The Perception of Consumers Vis-à-Vis Tracked Fish Measured via Electronic Instrument
* Federal University of Tocantins, Miracema do Tocantins, Tocantins, Brazil
** University of Sao Paulo, São Paulo, São Paulo, Brazil
† Federal University of Mato Grosso, Cuiabá, Mato Grosso, Brazil
‡ Embrapa Fishing and Aquaculture, Palmas, Tocantins, Brazil
§ Federal University of Tocantins, Palmas, Tocantins, Brazil
¶ Lutheran University Center of Palmas, Palmas, Tocantins, Brazil
†† University of Taubaté, São Paulo, São Paulo, Brazil
Abstract
Food traceability has been used to monitor production processes, and provide identification and information about sources and processes through computer technology. Technology also allows the recall of suspecting products identifying potential failures during their production. In this chapter, we discuss the impact of implementing the tracking technology into the Brazilian and Portuguese fish production chain and its impact on consumers’ attitudes using data collection through the Internet. The data collected allowed evaluating the initiative to track fish. The results showed that for 73.23% of participants, fish tracking was good and very good, and of this total, 82.19% are willing to pay more for a product with origin guarantee, which may indicate a market trend in search of a product with origin guarantee. The results also provided subsidies for the adoption of policies to implement a traceability system for fish to boost consumption.
Keywords
1. Introduction
Table 5.1
| Publications | Samples | Those Who Do Not Consume (%) | Reasons Not to Consume | Traceability |
|---|---|---|---|---|
| Similarities and distinctions of fish consumption in Brazil and Portugal measured through an electronic survey (Maciel et al., 2016) | Brazilians: 1295 Portuguese: 174 |
Brazilians: 1.8 Portuguese: 1.1 |
Taste/lack of habit/price/spines | Willing to pay more for a product with guarantee of origin: Brazil = 32.2% Portugal = 40.2% Of which, 23.4 and 29.9%, Brazil and Portugal, respectively, would pay up to 10% more |
| Fish quality attributes related to consumption in Corumbá, MS (Maciel et al., 2015) | 105 Brazilians, Mato Grosso | 1.9 | Price/taste | — |
| Comparison of fish consumption among students and its relation to indexes of health and life quality (Guimarães et al., 2015) | 31 Students; 14- to 17-year-old Brazilians, Tocantins | 12.9 | Price | — |
| Label designing for minimally processed tilapia aiming the traceability of the productive chain (Maciel et al., 2014b) | 162 Potential consumers | — | — | Acceptance by fish packaging with traceability code and acceptance of 97% of respondents |
| Relationship between the price of fish and its quality attributes: a study within a community at the University of São Paulo, Brazil (Maciel et al., 2013) | 1966 Brazilians of the university community | — | — | Significant association between prices paid for the fish and attributes related to product quality |
| Profile of respondents of a Brazilian university regarding fish consumption (Maciel et al., 2012b) | 1966 Brazilians of the university community | 5.13 | Habit/preparation/availability | — |
| Survey on fish consumption during commemorative festival Fish Week in a city in São Paulo state (Maciel et al., 2009) | 232 People | 7 | — | — |


2. Fish Consumption: Health Benefits
3. Fish: Production Chain Quality
4. Traceability: Concept/Definition
5. Quality and Traceability Systems in the Fish Production Chain
6. Assessment of Fish Consumption Regarding Tracked Fish
Table 5.2
| Constructs | Indicators |
|---|---|
| Consumption | How important is fish taste for you? |
| How important is fish smell for you? | |
| How important is fish color for you? | |
| How important is fish texture/consistency for you? | |
| Quality | When you purchase fish, how important is the packaging for you? |
| When you purchase fish, how important is the product brand for you? | |
| When you purchase fish, how important is the product origin for you? | |
| How important is it for fish to have the stamp of federal inspection for you? | |
| How important is it to have availability of fish at the usual sites of purchase for you? | |
| How important is it that the fish is tracked for you? | |
| Are you satisfied with the quality of fish available in the national market? | |
| Where do you usually purchase fish? | |
| General characteristics | When you purchase fish, what is your preference for packages? |
| Do you know what a tracked product is? | |
| Are you willing to pay more for a product a with guarantee of origin? |
Table 5.3
| Campuses | Cities in São Paulo State | Frequencies | ||||||
|---|---|---|---|---|---|---|---|---|
| Twice or More a Week | Once a Week | Twice or Thrice a Month | Once a Month | Rarely | Never | Total | ||
| 1 | Piracicaba | 37 (7.67) | 161 (33.40) | 139 (28.83) | 77 (15.97) | 53 (10.99) | 15 (3.11) | 482 [24.51] |
| 2 | São Paulo | 114 (11.40) | 241 (24.10) | 253 (25.30) | 171 (17.10) | 160 (16.00) | 61 (6.10) | 1000 [50.86] |
| 3 | São Carlos | 4 (6.77) | 12 (20.33) | 16 (27.11) | 16 (27.11) | 8 (13.55) | 3 (5.08) | 59 [3.00] |
| 4 | Ribeirão Preto | 19 (7.91) | 69 (28.75) | 56 (23.33) | 48 (20.00) | 38 (15.83) | 10 (4.16) | 240 [12.20] |
| 5 | Pirassununga | 7 (8.33) | 29 (34.52) | 23 (27.38) | 14 (16.66) | 9 (10.71) | 2 (2.38) | 84 [4.27] |
| 6 | Bauru | 4 (17.39) | 6 (26.08) | 8 (34.78) | 2 (8.69) | 2 (8.69) | 1 (4.34) | 23 [1.16] |
| 7 | Lorena | 1 (1.61) | 10 (16.12) | 14 (22.58) | 12 (19.35) | 19 (30.64) | 6 (9.67) | 62 [3.15] |
| 8 | Outros a | 1 (6.25) | 5 (31.25) | 1 (6.25) | 4 (25.00) | 2 (12.5) | 3 (18.75) | 16 [0.81] |
| Total | 187 [9.51] | 533 [27.11] | 510 [25.94] | 344 [17.49] | 291 [14.80] | 101 [5.13] | 1966 [100] | |

Values in parentheses represent the percentages in relation to the value of each campus. Values in brackets represent percentages in relation to total value of respondents (n = 1966).
a Other research centers located outside the campuses of the university studied.
Table 5.4
| Constructs | Categories | Means (AIQ) | Wilcoxon Groups (a = 0.05) |
|---|---|---|---|
| Consumption | Undergraduates | 16 (4) | B |
| KW: 52.5913 | Graduates | 17 (4) | A |
| P < 0.0001 | Employees | 17 (3) | A |
| Faculty | 17 (4) | A | |
| Others | 17 (4) | A | |
| Quality | Undergraduates | 8 (18) | C |
| KW: 177.0706 | Graduates | 8 (20) | B |
| P < 0.0001 | Employees | 27 (23) | A |
| Faculty | 26 (23) | A | |
| Others | 8 (21) | B |

Table 5.5
| Constructs | Sexes | Means (AIQ) | Wilcoxon Groups (a = 0.05) |
|---|---|---|---|
| Consumption | Male | 16(4) | B |
| KW: 43.4621 | Female | 17(4) | A |
| P < 0.0001 | |||
| General quality | Male | 8(20) | B |
| KW: 6.6162 | Female | 8(21) | A |
| P < 0.0101 |

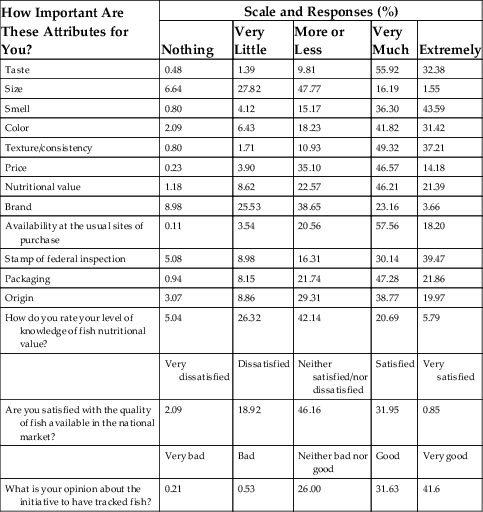
Table 5.6
| How Important Are These Attributes for You? | Scale and Responses (%) | ||||
|---|---|---|---|---|---|
| Nothing | Very Little | More or Less | Very Much | Extremely | |
| Taste | 0.48 | 1.39 | 9.81 | 55.92 | 32.38 |
| Size | 6.64 | 27.82 | 47.77 | 16.19 | 1.55 |
| Smell | 0.80 | 4.12 | 15.17 | 36.30 | 43.59 |
| Color | 2.09 | 6.43 | 18.23 | 41.82 | 31.42 |
| Texture/consistency | 0.80 | 1.71 | 10.93 | 49.32 | 37.21 |
| Price | 0.23 | 3.90 | 35.10 | 46.57 | 14.18 |
| Nutritional value | 1.18 | 8.62 | 22.57 | 46.21 | 21.39 |
| Brand | 8.98 | 25.53 | 38.65 | 23.16 | 3.66 |
| Availability at the usual sites of purchase | 0.11 | 3.54 | 20.56 | 57.56 | 18.20 |
| Stamp of federal inspection | 5.08 | 8.98 | 16.31 | 30.14 | 39.47 |
| Packaging | 0.94 | 8.15 | 21.74 | 47.28 | 21.86 |
| Origin | 3.07 | 8.86 | 29.31 | 38.77 | 19.97 |
| How do you rate your level of knowledge of fish nutritional value? | 5.04 | 26.32 | 42.14 | 20.69 | 5.79 |
| Very dissatisfied | Dissatisfied | Neither satisfied/nor dissatisfied | Satisfied | Very satisfied | |
| Are you satisfied with the quality of fish available in the national market? | 2.09 | 18.92 | 46.16 | 31.95 | 0.85 |
| Very bad | Bad | Neither bad nor good | Good | Very good | |
| What is your opinion about the initiative to have tracked fish? | 0.21 | 0.53 | 26.00 | 31.63 | 41.6 |