Chapter 11
Strategy for the Prediction, Control, and Optimization of the Functional Properties of Food Proteins: Using Statistical and Chemometric Tools
Héctor L. Sturniolo*
Laura Folguera†
Jorge F. Magallanes†
* Laboratorio de Bromatología, Facultad de Química, Bioquímica y Farmacia, Universidad Nacional de San Luis, Chacabuco y Pedernera, San Luis, Argentina
** Consejo Nacional de Investigaciones Científicas y Técnicas (CCT—San Luis—CONICET), Instituto de Física Aplicada (INFAP), San Luis, Argentina
† Comisión Nacional de Energía Atómica, Centro Atómico Constituyentes, San Martín, Provincia de Buenos Aires, Argentina
Abstract
Proteins have functional properties that govern their behavior in foods during processing, storage, and consumption. Proteins can have high nutritional quality and not have functional properties suitable for incorporation into determined food systems. Furthermore, a desirable functional attribute for an additive may be undesirable for everyone else. This chapter describes the design of a new strategy to predict, control, and optimize the functional parameters of food proteins hydrolyzed or not, using chemometrics tools. The starting material consists of proteins whose functional properties are desired to modify. Functional properties (e.g., emulsifying and foaming properties) can be simultaneously evaluated by an experimental statistical design, response surface graphics, and multiple linear regressions. This strategy expands the applications of food proteins and allows the following facilities: assess interactions between variables of multivariate systems, evaluate the dependence between functional parameters, and optimize the additive production with tailor-made functional properties for different food systems.
Keywords
food proteins
protein hydrolysis
functional properties
chemometrical analysis
Doehlert statistical design
response surface graphics
1. Introduction
Food proteins play critical roles in human nutrition and have physical–chemistry properties that govern their behavior in foods during processing, storage, and consumption, processes that are collectively termed functional properties. Limited or controlled enzymatic hydrolysis of food proteins could provide ingredients with desired or restored functionalities (Tavano, 2013).
Ingredients that give high viscosity and water absorption are preferred for use in minced meat products, some bakery products and gravies; while soups, cheesecakes, and infant food formulations require less viscous product mix and weaker water retention (Fineli, 2011). Proteins of hypoallergenic nutritional formulations are extensively hydrolyzed, 90% of their peptides have molecular weight lower than 500 Da. Protein hydrolysates intended for use as nutritional supplements undergo slight (about 90% peptides higher than 5000 Da) or moderate (about 46% peptides higher than 5000 Da) hydrolysis degree (Chr Hansen, 2012; Lamsal et al., 2007).
Protein enzymatic hydrolysis decreases the chain molecular weight and increases the product hydrophilicity (Drago and González, 2001). Low molecular mass protein compounds (<500 Da) are responsible for the basis taste and free amino acids are precursors of volatile flavor compounds (Alonso et al., 2013).
Extensive literature is available about the enzymatic modification of food proteins by proteolytic enzymes and its effects on hydrolysates functional properties (Del Mar Yust et al., 2013; Karaman et al., 2015; Kotlar et al., 2013; Li et al., 2013; Mune Mune, 2015; Wani et al., 2015; Yang and Foegeding, 2010). Nevertheless, each variable of the protein’s hydrolysis process has been individually studied in all cases.
Data analysis with multivariate statistical techniques has been successfully used on sensory parameters after proteolysis (Pripp et al., 2000). However, to the best of our knowledge, no successful attempt has been made to predict, control, and optimize the most adequate functional characteristics of foods proteins (hydrolyzed or not), using statistical and chemometrics tools.
In this study, a Doehlert statistical design (DOE) and response surface graphics (RSG) were applied to describe the effects of different factors (pH, temperature, time of hydrolysis, amount of added buffer and enzyme:substrate ratio [E:S]) on the following functional parameters (responses) of food proteins, which were hydrolyzed by a commercial proteolytic enzyme: free amine nitrogen (NA), total soluble nitrogen (NT), solubility (PSI), water-holding capacity (WHC), held water (HW), emulsifying activity index (EAI), emulsifying stability index (ESI), viscosity (η), surface hydrophobicity (So), foaming capacity (FC), and foam stability (FS).
The novelty of this strategy also lies in the evaluation of all the process variables (factors and responses) at the same time, using multiple linear regression (MLR) in order to get relationships that allow for the prediction, control, and optimization of each functional parameter based on the significant factors and on the interactive effects among them.
Finally, the set of functional parameters was optimized according to the desired application, using desirability functions. Thus, the production of several additives with tailor-made functional properties has been optimized in order to be added to different food systems, such as: sauces and soups, bakery products, cheesecake, and a product to accelerate the ripening of hard cheeses.
2. Materials and Methods
2.1. Sample Preparation
Soluble proteins of semi-hard goat cheese were taken as model in this study. Aqueous dispersions of goat cheese previously processed were prepared using a laboratory homogenizer during 2 min, 10 g of processed sample with different amounts of phosphate buffer (pH 5–9) were maintained under stirring at 200 rpm using a rotating orbital shaker (GFL, Germany). Temperatures and time of hydrolysis varied from 35 to 70°C during 30–270 min, respectively. Commercial papain from Carica papaya (Fluka, 3.11 U/mg, EC 3.4.22.2) was the proteolytic enzyme used in all trials.
2.2. Statistical Design of Experiments
A multilevel Doehlert’s design was performed using the following factor ranges, which were based on previous experimental trials: pH: 5–9 (7 levels); temperature: 35–70°C (7 levels); time of hydrolysis: 30–270 min (7 levels); amount of added buffer: 10–30 g of buffer/g of protein, (3 levels); enzyme: substrate ratio (E:S): 5.5.10−3 to 0.22 mg of papain/g of cheese casein (5 levels).
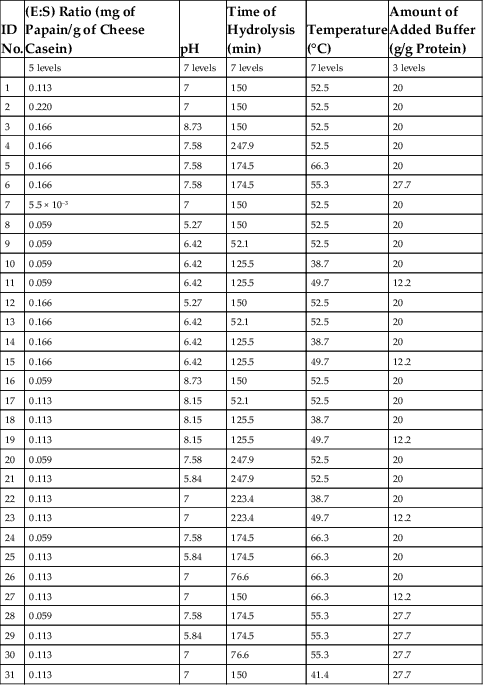
Table 11.1 shows the experimental levels used for obtaining statistical results of functional parameters of hydrolyzed proteins. According to Doehlert’s design shown in Table 11.1, 31 runs (by duplicate) were carried out, and the following responses were measured: NA, NT, PSI, WHC, HW, EAI, ESI, η, So, FC, and FS. Although Doehlert’s design is not blockable, a daily experimental order was followed to minimize biased results caused by blocking effects.
Table 11.1
| ID No. | (E:S) Ratio (mg of Papain/g of Cheese Casein) | pH | Time of Hydrolysis (min) | Temperature (°C) | Amount of Added Buffer (g/g Protein) |
|---|---|---|---|---|---|
| 5 levels | 7 levels | 7 levels | 7 levels | 3 levels | |
| 1 | 0.113 | 7 | 150 | 52.5 | 20 |
| 2 | 0.220 | 7 | 150 | 52.5 | 20 |
| 3 | 0.166 | 8.73 | 150 | 52.5 | 20 |
| 4 | 0.166 | 7.58 | 247.9 | 52.5 | 20 |
| 5 | 0.166 | 7.58 | 174.5 | 66.3 | 20 |
| 6 | 0.166 | 7.58 | 174.5 | 55.3 | 27.7 |
| 7 | 5.5 × 10⁻³ | 7 | 150 | 52.5 | 20 |
| 8 | 0.059 | 5.27 | 150 | 52.5 | 20 |
| 9 | 0.059 | 6.42 | 52.1 | 52.5 | 20 |
| 10 | 0.059 | 6.42 | 125.5 | 38.7 | 20 |
| 11 | 0.059 | 6.42 | 125.5 | 49.7 | 12.2 |
| 12 | 0.166 | 5.27 | 150 | 52.5 | 20 |
| 13 | 0.166 | 6.42 | 52.1 | 52.5 | 20 |
| 14 | 0.166 | 6.42 | 125.5 | 38.7 | 20 |
| 15 | 0.166 | 6.42 | 125.5 | 49.7 | 12.2 |
| 16 | 0.059 | 8.73 | 150 | 52.5 | 20 |
| 17 | 0.113 | 8.15 | 52.1 | 52.5 | 20 |
| 18 | 0.113 | 8.15 | 125.5 | 38.7 | 20 |
| 19 | 0.113 | 8.15 | 125.5 | 49.7 | 12.2 |
| 20 | 0.059 | 7.58 | 247.9 | 52.5 | 20 |
| 21 | 0.113 | 5.84 | 247.9 | 52.5 | 20 |
| 22 | 0.113 | 7 | 223.4 | 38.7 | 20 |
| 23 | 0.113 | 7 | 223.4 | 49.7 | 12.2 |
| 24 | 0.059 | 7.58 | 174.5 | 66.3 | 20 |
| 25 | 0.113 | 5.84 | 174.5 | 66.3 | 20 |
| 26 | 0.113 | 7 | 76.6 | 66.3 | 20 |
| 27 | 0.113 | 7 | 150 | 66.3 | 12.2 |
| 28 | 0.059 | 7.58 | 174.5 | 55.3 | 27.7 |
| 29 | 0.113 | 5.84 | 174.5 | 55.3 | 27.7 |
| 30 | 0.113 | 7 | 76.6 | 55.3 | 27.7 |
| 31 | 0.113 | 7 | 150 | 41.4 | 27.7 |
Original protein isolates (blanks) without enzyme were carried out for each experimental condition studied. All analytical grade chemicals used in this work were supplied by Sigma-Aldrich Co. (St. Louis, USA).
2.3. Free Amine Nitrogen and Total Soluble Nitrogen
After finishing each experimental run, samples and blanks were heated to boiling point so as to stop enzymatic activity. They were cooled at −4°C and centrifuged at 3000 g, during 15 min. NT and NA were determined by the Kjeldhal and phenol-hypocloride methods in the free fat supernatants after filtering them through filter paper Whatman No. 1 (AOAC, 2006; Fawcet and Scott, 1960).
2.4. SDS-Polyacrylamide Gel Electrophoresis (SDS-PAGE)
Supernatants of samples and blanks were separated by polyacrilamide gel electrophoresis under denaturant conditions with 0.2% SDS in a Mini Protean System II (BioRad) and dyed with blue bromophenol (Laemmli, 1977). Precision protein standards (BioRad) with known molecular masses from 10 to 250 kDa were also applied in gel.
2.5. Solubility
PSI describes the role of protein ingredients in solution and how they form colloidal structures (Foegeding and Davis, 2011). PSI is the percentage of supernatant soluble protein with respect to the total protein contents (Eq. 11.1) by Kjeldahl method (AOCS, 1997).
 (11.1)
2.6. Water-Holding Capacity
WHC has been estimated as the amount of water that original and hydrolyzed proteins can retain after the action of a centrifugal force under standardized conditions. The procedure developed by Piva et al. (1981) was applied according to Fig. 11.1.
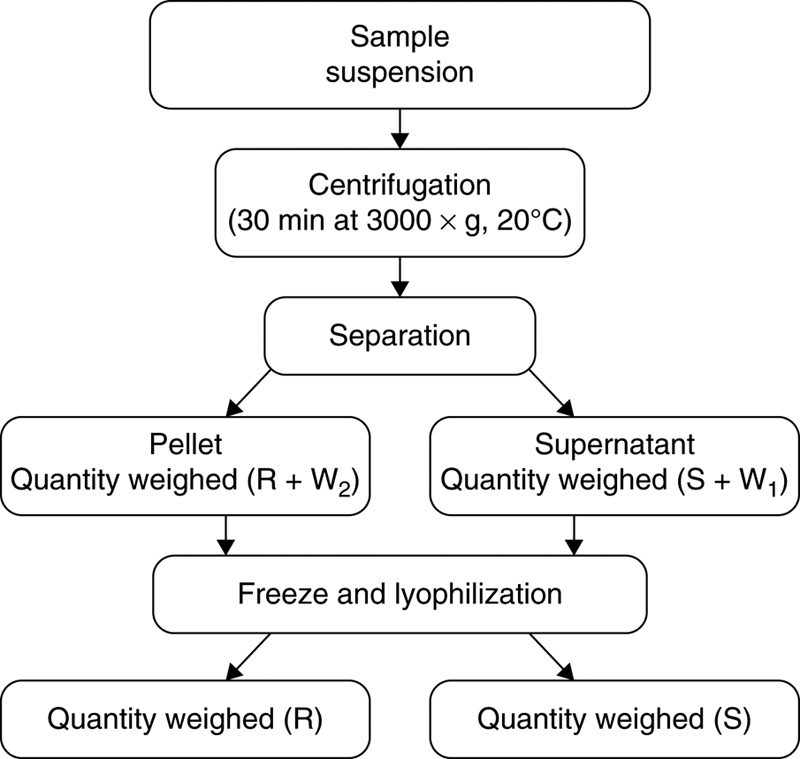
Figure 11.1 Diagram for the Water-holding Capacity Determination (WHC, g of H2O/g of Dry Pellet).
WHC was expressed as (g H2O/g of dry pellet) by Eq. (11.2):
 (11.2)
Where: W2, weight of water in the pellet; R, weight of dry pellet.
2.7. Held Water
HW was determined by means of a method developed by Piva et al. (1981), according to Fig. 11.1. HW was quantified as the ratio of the amount of water that original and hydrolyzed proteins can retain after the action of a centrifugal force under standardized conditions versus the total amount of water of the sample; and it was expressed as (%) (Eq. 11.3):
 (11.3)
2.8. Emulsifying Activity Index and Emulsifying Stability Index
The interface area that can be covered by a protein is related to its capacity to form and stabilize emulsions. EAI and ESI were measured by the turbidimetric method of Pearce and Kinsella (1978), modified by Tang et al. (2006). EAI (m2/g) and ESI (min) were calculated by Eqs. (11.4) and (11.5).
 (11.4)
 (11.5)
Where: A0, initial absorbance; A20, absorbance at 20 min; c, initial protein concentration (mg/mL); ϕ, optical way length (0.01 m); θ, fraction of oil (used to form the emulsion); DF, dilution factor.
2.9. Viscosity (η)
Apparent η of hydrolyzed samples and their blanks were determined by means of a programmable rheometer (Brand Brookfield, Model DV-III), according to the method described by Hermansson (1978, 1979). Apparent η was determined because in this type of sample there are a number of occurrences protein–protein interactions, which can produce flocculation, coagulation, and gelation (Surówka et al., 2004). Nine routine measurements were performed from 100 to 140 rpm, at 24°C, and the average apparent η was obtained.
2.10. FTIR Spectroscopy
Infrared spectra were measured at 25°C with a Nicolet Protegé 460 Fourier transform infrared spectrophotometer, provided with a CsI beam splitter between 4000 and 225 cm−1. The spectral resolution was 4 cm−1 between 4000 and 225 cm−1. Supernatants of the protein hydrolysates and their blanks were lyophilized, and approximately 1 mg of protein was combined with 300 mg of potassium bromide and annealed into a disc using a hydraulic press. This process has previously shown not to alter the IR spectra of proteins (Van der Weert et al., 2001). The instrument was purged with dry N2 to decrease atmospheric H2O vapor and the subtraction of residual vapor was also performed when necessary. The correction of the basis line and the second-derivative infrared spectrum were carried out using OMNIC spectrophotometer programme. The relative amounts of the different components from the band amide I was determined by means of the second-derivative analysis. Similarity analysis of FTIR spectra were carried out according to the method described by Prestrelski et al. (1993), and spectral similarity coefficients (similarity, r) were calculated using Eq. (11.6):
 (11.6)
Where, xi and yi are absorbance values of reference and sample spectra, respectively; at frequency i (cm−1) in the band amide I. This correlation value is equal to 1 when there is no conformational change in the protein, while if large conformational changes occur, spectral differences are also large, and r coefficient becomes small.
2.11. HPLC-MS Analysis
Protein hydrolysates and their blanks were analyzed and identified by HPLC-MS. Analyses were performed on VG-Quattro (Micromass Instruments S.A.), with a C-18 Nucleosil (120–5) (5 μm), 250 mm × 40 mm column (Scharlan). Electrospray technique was used with positive ion reading (100–1000 uma), nebulizer gas: N2 (flow: 10 L/h), drying gas: N2 (flow: 450 L/h), source temperature: 80°C, capillary voltage: 3.5 kV, voltage focus: 55 V, flow: 15 mL/min, elution: solvent A, H2O containing 1% formic acid and solvent B, acetonitrile; A: B = 50:50. Injection volume: 10–20 μL.
2.12. Surface Hydrophobicity
Surface Hydrophobicity (So) of original and hydrolyzed samples was performed with a probe of 1-anilino-8-naphthalene sulfonate (ANS), using Kato and Nakai’s method (Kato and Nakai, 1980). Supernatants of the hydrolysated protein were serially diluted with 0.01 M phosphate buffer (pH 7) for obtaining protein concentrations between 0.01 and 1 mg/mL. Protein concentrations in the supernatant were determined by Bradford’s method (Bradford, 1976). Then, 40 μl ANS 8 mM in 0.1 M phosphate buffer (pH:7) were added to 2 mL of the sample. Fluorescence intensity (FI) was measured with a fluorescence spectrophotometer (Perkin-Elmer, 2000) at 365 nm (excitation) and 484 nm (emission). FI versus protein concentration was plotted, and the initial slope of linear regression analysis was used as an index of protein So.
2.13. Foaming Capacity and Foam Stability (FS)
Foaming capacity (FC) was measured by using a graduated glass column with a porous glass disc (type G 4) at the bottom. Gas N2 (fr, mL/min) was insufflate at a flow of 180 mL/min through 30 mL of supernatant of hydrolyzed protein (containing 0.5–2 mg of protein/mL), until a final volume (Vf, mL) of 275 mL of foam was obtained. The time taken to obtain this volume (tf, min) was registered. FC was calculated as (Eq. 11.7):
 (11.7)
Where: Vf, final volume (mL); tf, time for obtaining final volume (min); fr, N2 gas flow (mL/min).
Simultaneously, the remaining liquid volume in the glass tube was registered at different times, until the end of the bubbling period. The volume of liquid that was taken up to the foam stage at the end of the bubbling period was determined as Vmax (mL). The time for drainage of the half of the entrapped liquid in the foam at the end of the bubbling period (t1/2, min) was also measured. The stability of the foam was measured as the specific constant of drainage rate (FS, mL/m) (Sorgentini and Wagner, 2002) (Eq. 11.8).
 (11.8)
Where: Vmax, volume of liquid that was taken up in the foam stage at the end of the bubbling period (mL); t1/2, the time for drainage of half of the entrapped liquid in the foam at the end of the bubbling period (min).
All determinations were carried out by duplicate and they were compared with the same amount of sample without hydrolysis (blank).
2.14. Chemometrical Analysis
Statistical analysis was carried out by multivariate techniques, such as MLR (Chatterjee and Simonoff, 2012). Several empirical-statistical linear models were obtained to each of the responses according to Eq. (11.9), and they were checked by Bayes-Gibbs probabilistic analysis (Bernardo, 2005). General system errors were estimated by repeating several measurements in the center of the design, that is to say, the mean of the ranges of all variables.
 (11.9)
Where: X1, ratio (E:S); X2, pH; X3, time of hydrolysis; X4, temperature; X5, amount of added buffer.
2.15. Desirability
Once the MLR models were obtained, the significant factor’s ranges were worked out by graphic representation of the responses as function of each couple of factors. Then, the definition of the factor’s ranges according to some expected specific products were established. The definitions of desirability were made according with Derringer and Suich (1980). For those products that are compounded from specific suitable characteristics, this methodology allows the simultaneous optimization of several response variables according with the factors’ ranges.
3. Results and Discussion
3.1. Effect of Protein Hydrolysis of Goat Cheese on Free Amine Nitrogen Content
Average maximal values of 1.365 g/mL at ID No. 27 and minimal of 0.41 g/mL at ID No. 10 were obtained. This means that the hydrolysis degree of soluble proteins into the supernatant was increased to 188%, regard to the original protein isolates, as a result of optimization of the hydrolysis process.
Statistical analysis of NA by means of the proposed linear model in Eq. (11.9) showed significant first-order results for temperature and the interactive effect between temperature and amount of added buffer, and of second order for pH, according to Eq. (11.10).
 (11.10)
Where: Y, NA β0:0.5171; X2, pH β4:0.3056; X4, temperature β2,2:0.6661; X5, amount of added buffer β4,5 −1.2768.
Fig. 11.2 shows the response surface of NA and the interactive effect between the temperature and amount of added buffer according to Eq. (11.10), using Statistica software (Statsoft Inc.). Circles in Fig. 11.2 show the experimental points on the response surface. NA variability at the same position of coordinates X4, X5 is due to the different remaining combinations of variables.
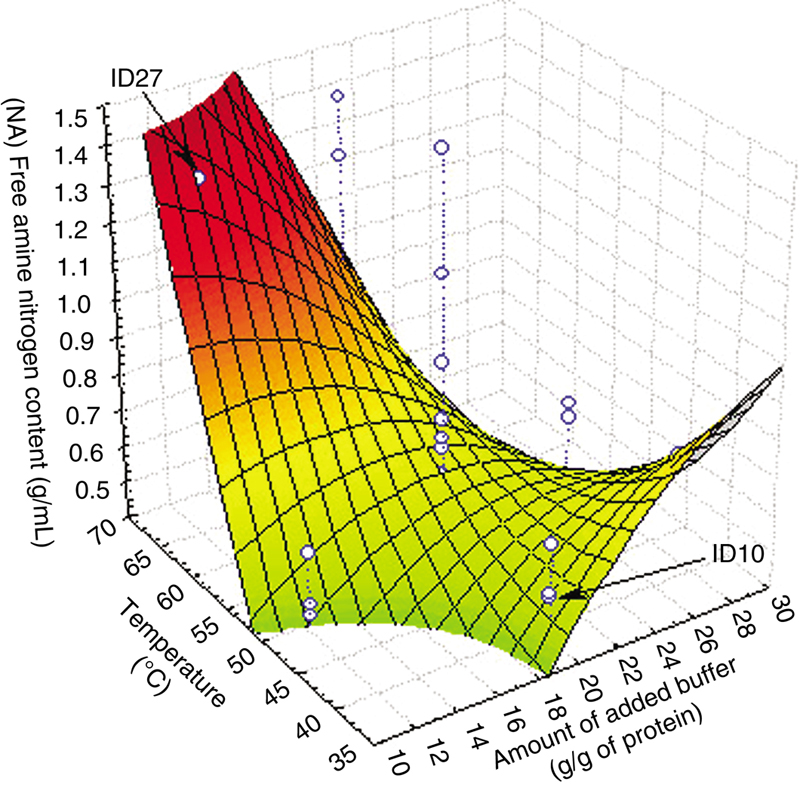
Figure 11.2 Response Surface Graphic of Free Amine Nitrogen content (NA) and the Interactive Effect Between the Temperature and Amount of Added Buffer for Hydrolyzed Goat Cheese Proteins.
High pH and temperature maximized the hydrolysis degree of goat cheese soluble proteins (NA) into the supernatant, at lowest amount of added buffer (10 g of buffer / g of protein). This behavior was due to the fact that papain is an active and stable enzyme up 80°C and has optimal pH 9 (Kim et al., 2012). However, the increase of NA with the temperature was compensated by the increase in the amount of added buffer due to the negative interactive effect of both factors. Furthermore, if a large amount of buffer were added, a decrease of NA with the increase of temperature would be observed (Fig. 11.2).
The percentage relative error of predicted values of NA versus the experimental values was calculated according to Eq. (11.11). Experimental values of NA above 0.7 g/mL showed a maximal percentage relative error of approximately ± 30%.
 (11.11)
3.2. Effect of Protein Hydrolysis of Goat Cheese on Total Soluble Nitrogen Content
Average maximal values of 7.025 g/L at ID No. 15 and minimal of 1.11 g/L at ID No. 7 were obtained. The release of soluble proteins from goat cheese to the supernatant was increased to 278%, regard to the original protein isolates, as a result of optimization of the hydrolysis process. Statistical analysis of NT showed significant first-order terms for ratio (E:S), pH, amount of added buffer, and the interactive effects of amount of added buffer with the ratio (E:S), and temperature, according to Eq. (11.12).
 (11.12)
Where: Y, NT β0:3.9684; X1, ratio (E:S) β1:0.6912; X2, pH β2:0.6162; X4, temperature β5:−0.9961; X5, amount of added buffer β1,5:−2.3322; β4,5:2.5061.
Figs. 11.3A and B shows the response surfaces of NT and the interactive effects between the amount of added buffer and the ratio (E:S) and temperature according to Eq. (11.12), using the Statistica software (Statsoft Inc.). Average maximal values of NT were obtained at the highest pH (9) and lowest amount of added buffer (10 g of buffer/g of protein). This effect was more evident at the highest ratio (E:S) (0.22 mg of papain/g of cheese casein) and lowest temperature (35°C), due to their interactive effects.

Figure 11.3 Response Surface Graphics of Total Soluble Nitrogen Content (NT).
Interactive effects between (A) temperature and amount of added buffer, (B) ratio (E:S) and amount of added buffer for hydrolyzed goat cheese proteins.
Interactive effects between (A) temperature and amount of added buffer, (B) ratio (E:S) and amount of added buffer for hydrolyzed goat cheese proteins.
Sign (–) of β5 coefficients in Eq. (11.12) indicates that the increase in the amount of added buffer decreased the release of NT from goat cheese to the supernatant, probably due to a simple dilution effect.
The first-order interactive effect between the amount of added buffer and temperature is negative for NA and positive for NT. According to Figs. 11.2 and 11.3A, the highest NA values were obtained at low amount of added buffer (10 g of buffer/g of protein) and highest temperature (70°C), but under these conditions NT did not reach maximal values. This means that there was not maximal release of peptides and soluble proteins from the goat cheese to the supernatant under these conditions; but the released proteins underwent greater cleavage into small peptides and amino acids (which increase the flavor of protein hydrolysates).
These phenomena were verified by SDS-PAGE of supernatants from samples ID No. 27 and ID No. 15, in which maxima values NA and NT were respectively obtained. Blanks of ID sample No. 27 showed several bands of 16, 18, 30, and 32 kDa that correspond to β-casein, β-lactoalbumin, α S1- and α S2-casein, respectively (Vairo Cavalli et al., 2008), and were hydrolyzed in the samples. Blanks of ID sample No. 15 showed a strong band at 32 kDa corresponding to α S2-casein, which was not hydrolyzed in the sample (data not shown).
Finally, ratios (E:S) influenced the release of peptides and proteins from goat cheese to the supernatant but did not affect their later hydrolysis into smaller fragments, within the studied range (Eqs. 11.10 and 11.12).
Experimental values of NT above 3 g/L showed a maximal percentage relative error of ± 20% (Eq 11.11).
3.3. Effect of Protein Hydrolysis of Goat Cheese on Protein Solubility Index
Average maximal values of 91% at ID No. 28 and minimal of 14% at ID No. 7 were obtained. Statistical analysis of PSI is shown in Eq. (11.13):
 (11.13)
Where: Y, PSI β0:50.35; X5, amount of added buffer β5:11.67.
As a result of optimization, PSI of the hydrolyzed goat cheese proteins was increased to 231% by adding buffer, compared to the original protein isolates.
Since peptides and amino acids are always required in the formulation of flavoring additives, because of they increase the flavor and are more reactive than proteins with other food components (Pires et al., 2013), the lowest value of amount of added buffer should be selected within the studied ranges. However, the amount of added buffer should be regulated according to the desired Solubility in the final product, because of it could be affected as it was previously mentioned.
Experimental values of PSI above 35% showed a maximal percentage relative error of ± 30% (Eq. 11.11).
3.4. Effect of Protein Hydrolysis of Goat Cheese on Water-Holding Capacity
Average maximal values of 3.08 g of water/g of dry pellet at ID No. 3 and minimal of 0.55 g of water/g of dry pellet at ID No. 9 were obtained. Statistical analysis of WHC is shown in Eq. (11.14):
 (11.14)
Where: Y, WHC β0:1.4325; X1, ratio (E:S) β1:0.5221; X2, pH β2:0.4556; X5, amount of added buffer β5:0.5905.
As result of optimization of the hydrolysis process an increase of 450% in the WHC (regard to the original protein isolates) was obtained at high pH (9), at a ratio (E:S) of 0.22 mg of papain/g of cheese casein, and an amount of added buffer of 30 g of buffer/g of protein.
Fig. 11.4A–C shows the dependency of WHC with the ratio (E:S), pH, and amount of added buffer. Besides, WHC of hydrolyzed goat cheese proteins showed a good correlation with PSI (data not shown).

Figure 11.4 Dependency of Water-Holding Capacity (WHC) on Different Factors.
(A) pH and ratio (E:S), (B) ratio (E:S) and amount of added buffer, (C) amount of added buffer and pH for hydrolyzed goat cheese proteins.
(A) pH and ratio (E:S), (B) ratio (E:S) and amount of added buffer, (C) amount of added buffer and pH for hydrolyzed goat cheese proteins.
Experimental values of WHC above of 1.2 g of water/g of dry pellet showed a maximal percentage relative error of approximately ± 30% (Eq. 11.11).
3.5. Effect of Protein Hydrolysis of Goat Cheese on Held Water
Average maximal values of 27% at ID No. 6, 28, 29, and minimal of 9.34% at ID No. 20 were obtained. This means that held water (HW) was increased to 190%, compared to the original protein isolates, as a result of optimization of the hydrolysis process.
Statistical analysis of HW showed significant first-order terms for the amount of added buffer and the interactive effect between temperature and amount of added buffer, and of second order for the amount of added buffer, according to Eq. (11.15):
 (11.15)
Where: Y, HW β0:0.144; X4, temperature β5:0.052; X5, amount of added buffer β4,5:0.172, β5,5:0.087.
Fig. 11.5 shows the response surface of HW and the interactive effect between the amount of added buffer and temperature according to Eq. (11.15), using the Statistica software (Statsoft Inc.). Average maximal values of HW were reached at the highest temperature (70°C) and amount of added buffer (30 g of buffer/g of protein).

Figure 11.5 Response Surface Graphic of Held Water (HW) and the Interactive Effect Between the Amount of Added Buffer and Temperature for Hydrolyzed Goat Cheese Proteins.
HW of hydrolyzed goat cheese proteins showed a good relationship with the protein solubility index (PSI), because both responses showed strong dependence on the amount of added buffer (data not shown).
The percentage relative errors of predicted values of HW versus the experimental values were calculated according to Eq. (11.11). Experimental values of HW showed good fit to the model in all the range of the variable and a maximal percentage relative error of approximately ± 30% was obtained.
3.6. Effect of Protein Hydrolysis of Goat Cheese on Emulsifying Activity Index
Average maximal values of 223.71 m2/g at ID No. 4 and minimal of 66.43 m2/g at ID No. 26 were obtained. EAI increased 235% compared to original protein isolates, as a result of optimization of the hydrolysis process. Statistical analysis of EAI is shown in Eq. (11.16):
 (11.16)
Where: Y, EAI β0:134.01; X1, ratio (E:S) β1,3:106.64; X3, time of hydrolysis.
Fig. 11.6A shows the response surface of EAI and the interactive effect between the ratio (E:S) and time of hydrolysis according to Eq. (11.16), using Statistica software (Statsoft Inc.).

Figure 11.6 Response Surface Graphics.
(A) Emulsifying activity index (EAI) and the interactive effect between the time of hydrolysis and ratio (E:S), (B) emulsifying stability index (ESI) and the interactive effect between the ratio (E:S) and temperature for hydrolyzed goat cheese proteins.
(A) Emulsifying activity index (EAI) and the interactive effect between the time of hydrolysis and ratio (E:S), (B) emulsifying stability index (ESI) and the interactive effect between the ratio (E:S) and temperature for hydrolyzed goat cheese proteins.
EAI significantly increases as time of hydrolysis and ratio (E:S) are increased. It is likely that the increase in hydrolysis time promotes the peptide’s diffusion and peptide–lipid interaction, thus helping to the anchoring of the peptide molecules at the oil–water interface and the increasing EAI. At low-soluble protein concentrations, the absorption of protein at oil–water interface is based on a diffusion-controlled kinetic and depend on the time until the steady state is reached (Seki et al., 2013).
The hydrolysis degree of proteins has modified the emulsifying properties of wheat gluten, rice, and soybean (Agyare et al., 2009; Li et al., 2013). However, this behavior has not been observed in this work.
Experimental values of EAI from 90 m2/g showed a maximal percentage relative error of ± 30% (Eq. 11.11).
3.7. Effect of Protein Hydrolysis of Goat Cheese on Emulsifying Stability Index
Average maximal values of 85.49 min at ID No. 14 and minimal of 27.34 min at ID No. 20 were obtained. ESI increased 210% regard to original protein isolates, by optimization of hydrolysis process. Statistical analysis of ESI is shown in Eq. (11.17):
 (11.17)
Where: Y, ESI β0:52.5; X2, pH β5:−13.5; X1, ratio (E:S) β 1,4:−41.5; X4, temperature β 2,2:−13.3; X5, amount of added buffer.
Fig. 11.6B shows the response surface of ESI and the interactive effect between ratio (E:S) and temperature according to Eq. (11.17), using the statistica software (Statsoft Inc.). Maximal values of ESI were reached under two conditions: at high temperatures (60–70°C) and with low enzyme concentration; and also at low temperatures (35–40°C), and with high enzyme concentration.
According to Eq. (11.17), ESI decreases as pH is increased due to high hydrolysis degree of soluble proteins (NA) under those conditions. Then, the excessive shortening of the soluble goat cheese proteins has caused a decrease of ESI, which was also reported for gluten hydrolysates (Lam and Nickerson, 2013).
On the other hand, a decrease on NT and an increase on PSI were observed at a high amount of added buffer. Probably, these conditions have decreased ESI due to the increase of electrostatic repulsion among peptide layers absorbed at oil droplet surface, limiting stabilization by steric repulsion of high molecular weight polypeptides. According to Damodaran (2005), the steric repulsion between polypeptides could prevent close contact between oil droplets, and the resulting flocculation and coalescence.
Experimental values of ESI from 30 min showed a maximal percentage relative error of approximately ± 30% (Eq. 11.11).
3.8. Effect of Protein Hydrolysis of Goat Cheese on Viscosity (η)
Average maximal values of 1.74 cP at ID No. 27 and minimal of 1.26 cP at ID No. 10 were obtained. This means that η was increased to 40%, compared to the original protein isolates, as a result of optimization of the hydrolysis process.
Statistical analysis of η by means of the proposed linear model in Eq. (11.9) showed significant first-order results for all the factors studied and for the interactive effect between amount of added buffer and temperature, according to Eq. (11.18).
 (11.18)
Where:Y, η β0:1.5044; X1, ratio (E:S) β1:0.0812; X2, pH β2:0.0710; X3, time of hydrolysis β3:0.0425; X4, temperature β4:0.1346; X5, amount of added buffer β5:−0.0762, β4,5:−0.1133.
Fig. 11.7 shows the response surface of η and the interactive effect between the amount of added buffer and temperature according to Eq. (11.18), using Statistica software (Statsoft Inc.).

Figure 11.7 Response Surface Graphic of Viscosity (η) and the Interactive Effect Between the Amount of Added Buffer and Temperature for Hydrolyzed Goat Cheese Proteins.
According to Eq. (11.18), η increases as pH, temperature, ratio (E:S), and time of hydrolysis are increased, and the amount of added buffer is decreased. Then, average maximal values of η of 1.74 cP were obtained at the highest ratio (E:S) (0.22 mg of papain/g of cheese casein), pH (9), time of hydrolysis (270 min), and temperature (70°C) and at the lowest amount of added buffer (10 g of buffer/g of protein).
However, the increase of η with temperature was compensated by the increase in the amount of added buffer due to the negative interactive effect of both factors, when they were of similar magnitude (β4 and β4,5 coefficients are approximately equal but with opposite signs). Furthermore, if a large amount of buffer were added, a decrease of η with the increase of temperature would be observed (Fig. 11.7).
According to other reports, although enzymatic treatments have been limited, they have always reduced η of hydrolyzed proteins (Lamsal et al., 2007). Contrary to those results, Eq. (11.18) predicts an increase of η due to an increase of hydrolysis degree, which was observed at high pH and temperature and at a low amount of added buffer (see Fig. 11.2 and Eq. 11.10).
In effect, a sharp increase of η of the hydrolyzed goat cheese proteins with the rise of temperature was observed, at the lowest amount of added buffer (10 g of buffer/g of protein) (Fig. 11.7). We hypothesized that this behavior could be due to the fact that the peptides and amino acids released from goat cheese could aggregate, or that new peptides could be synthesized by the papain catalysis under those conditions.
According to the literature, papain is capable of catalyzing in aqueous media: the cleavage of peptide bonds (proteolysis) and, the synthesis of new peptide bonds (amidolysis) (Barberis et al., 2008). The ability of the proteases to catalyze the synthesis of new peptide bonds has been shown by many authors, and gave rise to an intense research and development on the peptides synthesis in different media (Guzmán et al., 2007; Illanes et al., 2009).
Protein hydrolysates were analyzed by FTIR and HPLC-MS in order to confirm our hypothesis and determine whether the protein aggregates were formed, or whether new polymers were synthesized from the fragments obtained by hydrolysis.
Fig. 11.8 shows second derivative amide I FTIR spectra of hydrolyzed goat cheese proteins (ID No. 10 and 27), after the subtraction of blanks without papain.

Figure 11.8 Second Derivative Amide I FTIR Spectra of Hydrolyzed Goat Cheese Proteins.
Samples ID No. 10 and ID No. 27) after the subtraction of blanks without papain.
Samples ID No. 10 and ID No. 27) after the subtraction of blanks without papain.
The frequency assignment for amide I components of hydrolyzed goat cheese proteins (Table 11.2) were performed according to the literature (Barth, 2000; Dong et al., 1990, 1995a,b).
Table 11.2
| Bands | Frequency (± 2 cm−1) | Relative Areas | |
|---|---|---|---|
| ID 10 | ID 27 | ||
| β—Sheet | 1636 | 0.00485 | 0.00197 |
| 1689 | |||
| 1698 | |||
| α—Helix | 1660 | 0.00257 | 0.00058 |
| Random | 1647 | 0.0048 | 0.0019 |
| 1653 | |||
| β—Turn | 1669 | 0.00383 | 0.00263 |
| 1674 | |||
| 1683 | |||
| Side chains | 1622 | 0.00078 | 0.00291 |
| 1615 | |||
| 1608 | |||
| Total area | (1600–1700) | 0.01683 | 0.00999 |
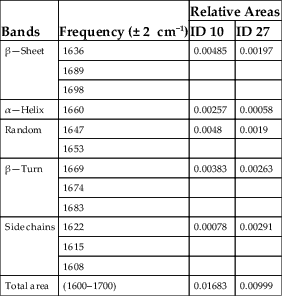
Most bands of the sample ID No. 27 showed a lower absorbance than ID No. 10, except for the side chains and β-sheet bands at the highest wave numbers (Fig. 11.8). Sample ID No. 10 has a maximal absorbance at 1653 cm−1 and 1659 cm−1, which corresponds to random structures and α-helix, respectively. Random components were defined by X-ray crystallographic studies as components that are not α-helix or β-sheet and β-turn (Richardson, 1991). Sample ID No. 27 has maximal absorbance at 1683 and 1698 cm−1, which corresponds to β-turn structures and β-sheet, respectively.
The reduction and even the disappearance of the β-sheet band at 1689 cm−1, and the appearance of the β-sheet band at the highest wave numbers (1698 cm−1) of the sample ID No. 27 are indicative of protein aggregation (Dong et al., 1995b). This fact indicates that the increase of η with temperature (Fig. 11.7) could be due to hydrolyzed proteins aggregation. Besides the widening and the slight shifting of bands at 1683 and 1698 cm−1 of sample ID No. 27 are indicative of protein unwinding (Dong et al., 1996).
Relative areas of amide I components of hydrolyzed goat cheese proteins (samples ID No. 10 and 27) after that baseline was corrected are shown in Table 11.2. The β-sheet/α-helix area for sample ID No. 10 was 1.887, and it was 3.396 for sample ID No. 27. A secondary structure with a higher β-sheet character indicates an increase of intermolecular hydrogen bridge bonds and protein aggregation, which justifies the increase of η for sample ID No. 27.
FTIR spectra similarity analysis between samples ID No. 10 and 27 were carried out according to the method described by Prestrelski et al. (1993), and spectral similarity coefficients (similarity, r) were calculated using Eq. (11.6). An r coefficient of 0.825 for the aforementioned spectra was obtained, thus confirming conformational changes in hydrolyzed goat cheese proteins under both conditions.
On the other hand, Fig. 11.9A and B shows HPLC chromatograms of hydrolyzed goat cheese proteins (samples ID No. 10 and 27) and their blanks without papain.

Figure 11.9 HPLC Chromatograms of Hydrolyzed Goat Cheese Proteins.
Sample ID No. 10 (A) and Sample ID No. 27 (B), and their blanks without papain.
Sample ID No. 10 (A) and Sample ID No. 27 (B), and their blanks without papain.
Several fractions that could correspond to polypeptides obtained by synthesis catalyzed by papain—from peptides and amino acids previously released by hydrolysis—were analyzed by MS to elucidate its structure. For instance, fractions at tR:3 and 62.5 min for sample ID No. 27. At tR:3 min, a Ser-Asp-Tyr-Phe-Cys peptide with the following M/Z was obtained: 69, 77, 79, 91, 105, 107, 115, 119, 121, 129, 133, 135, 143, 149, 173, 178, 189, 191, 259, 273, 279, 283, 313, 325, 329, 353, 355, and 367. At tR:62.5 min, a Cys-Cys-Ser-Lys-Phe peptide with the following M/Z was obtained: 69, 70, 79, 81, 84, 91, 105, 117, 121, 145, 147, 163, 241, 313, 327, 353, 368, 369, 381, and 395. However, this hypothesis could not be verified due to the complexity of protein hydrolysates of goat cheese.
Then, the atypical behavior of η of the hydrolyzed goat cheese proteins was attributed to the increase of intermolecular hydrogen bridge bonds of secondary structures with high β-sheet character, as well as to the soluble protein aggregations under those conditions, which were demonstrated by FTIR spectra.
Experimental values of η showed a good fit to the model and a maximal percentage relative error of approximately ± 6% was obtained (Eq. 11.11).
3.9. Effect of Protein Hydrolysis of Goat Cheese on Surface Hydrophobicity
Average maximal value of 15.65 FI/(mg of protein/mL) at ID No. 7 and minimal of 0.95 FI/(mg of protein/mL) at ID No. 29 were obtained. This means that So was decreased to 94%, regard to the original protein isolates, as a result of optimization of the hydrolysis process.
Statistical analysis of So showed significant first-order results for ratio (E:S) and for the amount of added buffer, and for the interactive effect of time of hydrolysis and temperature, according to Eq. (11.19).
 (11.19)
Where: Y, So β0:4.53; X1, ratio (E:S) β1:−4.67; X3, time of hydrolysis β5:−2.47; X4, temperature β3,4:−7.61; X5, amount of added buffer.
Fig. 11.10 shows the response surface of So and the interactive effect between time of hydrolysis and temperature according to Eq. (11.19), using the Statistica software (Statsoft Inc.). Under the conditions set for the study, the average minimal value of So was 0.95 FI/(mg of protein/mL). It is noteworthy that the lowest values of So are the most desirable ones, since this parameter is an indicator of the presence of bitter peptides in the hydrolysates (Børsting et al., 2012).

Figure 11.10 Response Surface Graphic of Surface Hydrophobicity (So) and the Interactive Effect Between Time of Hydrolysis and Temperature for Hydrolyzed Goat Cheese Proteins.
The highest temperature (70°C), time of hydrolysis (270 min), ratio (E:S) (0.22 mg of papain/g of cheese casein) and amount of added buffer (30 g of buffer/g of protein) have allowed for an optimized parameter. However, there is also an area of minimal So at the lowest temperature (35°C) and time of hydrolysis (30 min) due to the interactive effect of these factors (Fig. 11.10).
According to the literature, So correlates with hydrolysis degree, solubility, and emulsifying activity index of protein hydrolysates (Li-Chan et al., 2006). Nevertheless, no relationship was observed among those responses in this study.
Experimental values of So from 4 FI/(mg of protein/mL) showed a maximal percentage relative error of approximately ±40% at the borders of the experimental design (Eq. 11.11).
3.10. Effect of Protein Hydrolysis of Goat Cheese on Foaming Capacity
Average maximal values of 0.65 at ID No. 8 and 13 and minimal of 0.03 (in several samples) were obtained. These values were remarkably lower than others reported in the literature for several hydrolyzed proteins (Agyare et al., 2009; Mune Mune, 2015; Wani et al., 2015). Statistical analysis of FC did not show any significant relationship with the studied factors.
Several authors have observed that the solubility and the FC of hydrolyzed whey and soybean proteins have been significantly enhanced by means of an increase of the time of hydrolysis and ratio (E:S), but this effect has not been observed in this work (Sorgentini and Wagner, 2002; Surówka et al., 2004). Besides, it is known that pH modifies protein net charges, which usually affects not only the foam formation but also the film viscoelastic properties (Drago and González, 2001). Nonetheless, no effect of pH on the FC of hydrolyzed goat cheese proteins has been observed under the studied conditions.
These results suggest that some protein structures should be retained in order to have good foam and that the rupture of the polypeptide chains decreases the FC. In spite of the low papain concentrations that were used in this experimental design (DOE), it is likely that this protease (with broad specificity) has destroyed the cheese protein structure excessively. It is also evident that the FC of hydrolyzed proteins depends on the specificity of the proteolytic enzymes used, the physico-chemical nature of the parent protein, and the experimental conditions of the proteolysis.
3.11. Effect of Protein Hydrolysis of Goat Cheese on Foam Stability
Average maximal values of 1.48 mL/min at ID No. 9 and minimal of 0.1 mL/min (in several samples) were obtained.
Statistical analysis of FS showed only one significant term of first order for the time of hydrolysis, according to Eq. (11.20).
 (11.20)
Where: Y, FS β0: 0.756; X3, time of hydrolysis β3:−0.500.
Eq. (11.20) indicates that the increase in the time of hydrolysis resulted in a decrease in the FS. This effect was due to gravitational drainage and bubbles coalescence. Coalescence occurs because of the liquid draining from the lamella film while two gas bubbles approach each other, thus leading to the film thinning and its rupture (Damodaran, 2005; Yang and Foegeding, 2011). The addition of NaCl has decreased the gravitational drainage rate and improved the stability of soy isolated protein foams; however, ionic strength is a factor that was not included in this DOE experimental design (Agyare et al., 2009).
According to other authors, the FS of hydrolyzed proteins of soybean, cheese whey, and cowpea decreased as a result of an increase in the hydrolysis degree (Mune Mune, 2015). In spite of hydrolysis degree of the goat cheese, the FS was excessively low under the studied conditions in this work.
Experimental values of FS from 0.6 mL/min showed a maximal percentage relative error of approximately ± 50% (Eq. 11.11).
3.12. Desirability
The desirability technique consists of transforming each predicted response ŷ to a desirability value 0 ≤ d ≤ 1. The greater the desirability function d, the better the desirability of the corresponding response.
The individual desirabilities of each variable (di) allow us to calculate the desirability function as the geometrical mean of them. Thus, d = ( d 1 , d 2 … d m ) 1 / m  , i = 1 to m.
, i = 1 to m.A more general expression for d is d = ( d 1 w 1 , d 2 w 2 … d m w m ) 1 / m  , where 0 ≤ wi ≤ 1 are weights, which hold the condition Σwi = 1. The weights allow us to establish relative importance to the responses.
, where 0 ≤ wi ≤ 1 are weights, which hold the condition Σwi = 1. The weights allow us to establish relative importance to the responses.There are three classes of individual desirabilities according with the kind of desire: the-nominal-the-best, the-smaller-the-best, and the-larger-the-better.
The case of the-nominal-the-best assumes that the product is most desirable at ŷ = t and the unacceptable limits are ŷ < L and ŷ > U, then the range of t is L ≤ t ≤ U. The desirability di is then defined as (Eq. 11.21):
 (11.21)
The choice for α depends on preferences as an acute approach to t (α > 1) or a smooth approach to t (α < 1). This is valid for all classes of individual desirability.
The case of the-smaller-the-better supposes that a is the smallest desirable value for ŷ and U is the limit above which the response is considered to be unacceptable; then, the definition of di is (Eq. 11.22):
 (11.22)
The case of the-larger-the-better assumes that L is the limit below which the product is considered to be unacceptable and a is a finite maximum number to which the best response can be expected, then the definition of d is (Eq. 11.23):
 (11.23)
Table 11.3 shows the maximum U and minimum L values, as well as the low intermediate and high ranges for the responses considered in this study.
Table 11.3
| Responses | Minimum | Maximum | Low Range | Intermediate Range | High Range |
|---|---|---|---|---|---|
| NA | 0.41 | 1.364 | 0.41–0.645 | >0.645–1.129 | >1.129–1.364 |
| NT | 1.11 | 7.025 | 1.11–2.588 | >2.588–5.544 | >5.544–7.025 |
| PSI | 14.14 | 91.035 | 14.14–33.36 | >33.36–71.81 | >71.81–91.035 |
| WHC | 0.55 | 3.08 | 0.55–1.182 | >1.182–2.447 | >2.447–3.08 |
| HW | 9.34 | 27.33 | 9.34–13.84 | >13.84–22.73 | >22.73–27.33 |
| EAI | 66.435 | 223.71 | 66.435–105.75 | >105.75–184.4 | >184.39–223.7 |
| ESI | 27.33 | 85.45 | 27.33–41.86 | >41.86–70.9 | >70.9–85.45 |
| η | 1.265 | 1.74 | 1.265–1.384 | >1.384–1.62 | >1.62–1.74 |
| So | 0.955 | 15.64 | 0.955–4.626 | >4.626–11.97 | >11.97–15.64 |
| FC | 0.025 | 0.67 | 0.025–0.186 | >0.186–0.508 | >0.508–0.67 |
| FS | 0.14 | 1.48 | 0.14–0.475 | >0.475–1.145 | >1.145–1.48 |
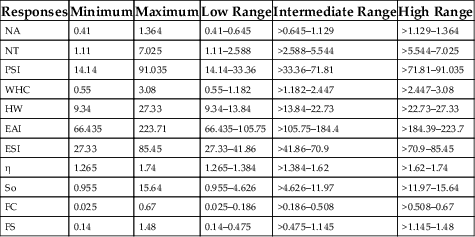
Desirability functions have been established as different combinations of the responses in order to obtain novel flavoring additives with tailor-made functional properties, according to desirable properties, based on hydrolyzed goat cheese proteins for being added to different food systems. They are:
- • Additive for sauces and soups.
- • Additive for bakery products.
- • Additive for accelerate the maturation of hard cheeses.
- • Additive for cheesecake.
Figs. 11.11–11.13 show the behavior of different couples of factors with reference to the desirability function depending on the class of the final product. From them it is possible to work out the ranges of factors presented in Table 11.4.

Figure 11.11 Case of Additive for Sauces and Soups.
Desirability functions as the result of factors (A) E:S ratio and amount of added buffer, (B) pH and time of hydrolysis, and (C) temperature and time of hydrolysis.
Desirability functions as the result of factors (A) E:S ratio and amount of added buffer, (B) pH and time of hydrolysis, and (C) temperature and time of hydrolysis.

Figure 11.12 Case of Additive for Bakery Products.
Desirability functions as the result of factors (A) E:S ratio and amount of added buffer, (B) pH and time of hydrolysis, and (C) temperature and time of hydrolysis.
Desirability functions as the result of factors (A) E:S ratio and amount of added buffer, (B) pH and time of hydrolysis, and (C) temperature and time of hydrolysis.
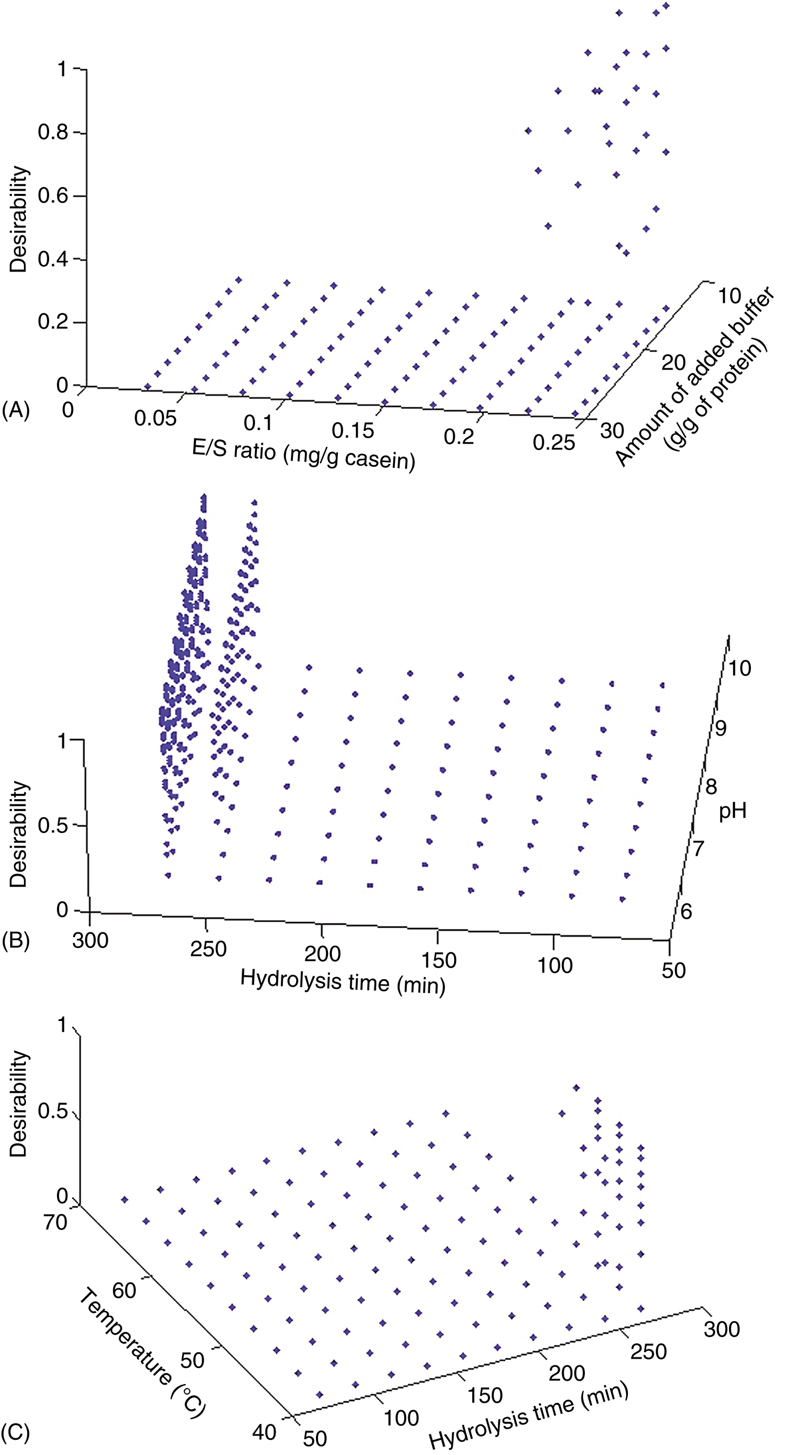
Figure 11.13 Case of Additive to Accelerate the Maturation of Hard Cheeses.
Desirability functions as the result of factors (A) E:S ratio and amount of added buffer, (B) pH and time of hydrolysis, and (C) temperature and time of hydrolysis.
Desirability functions as the result of factors (A) E:S ratio and amount of added buffer, (B) pH and time of hydrolysis, and (C) temperature and time of hydrolysis.
Table 11.4
| Product | pH | Temperature (°C) | Time of Hydrolysis (min) | Enzyme: Substrate Ratio (mg/g of Cheese Casein) | Amount of Added Buffer (g/g Protein) |
|---|---|---|---|---|---|
| Additive for sauces and soups | 5–9 | 50–70 | 75–270 | Full range | 13–22 |
| Additive for bakery products | 8–9 | 40–50 or 60–70 | 50–100 or 175–270 | 0.12–0.22 | 20–30 |
| Additive to accelerate the maturation of hard cheeses | 6–9 | 45–52 | 270 | 0.20–0.25 | 10–20 |

Table 11.4 shows the optimal ranges of factors for producing novel flavoring additives with tailor-made functional properties, based on hydrolyzed goat cheese proteins, for adding to different food systems.
The optimization of factors related to a product for using it as an ingredient in cheesecake could not be addressed because the optimal range for foaming capacity (1.748–2.285) fell off the experimental range (see Table 11.3).
4. Conclusions
This strategy has focused on the study and modeling of key functional parameters of hydrolyzed goat cheese proteins, using chemometric methodologies. All the variables, factors, and responses were taken together by multiple linear regression and good correlations between experimental and predicted values were found. The results allowed easy understanding about the prediction, control, and optimization of each functional parameter based on the significant factors and the interactive effects among them for obtaining the maximal efficiency in the desirable functional characteristics of the protein hydrolysates.
In brief, to enhance the flavoring power of the goat cheese by means of protein hydrolysis, the conditions that maximized NA and NT should be selected, that is, the highest values of pH (9) and ratio (E:S) (0.22 mg of papain/g of cheese casein), and the lowest amount of added buffer (10 g of buffer/g of protein). Temperature showed a compromised situation, since maximal NA and NT were obtained at 70 and 35°C, respectively.
Besides, if high EAI and ESI were required in the formulation of flavoring additives, the following conditions should be selected: the lowest values of pH (5), of amount of added buffer (10 g of buffer/g of protein) and of temperature (35°C), and the highest values of ratio (E:S) (0.22 mg of papain/g of cheese casein) and of time of hydrolysis (270 min).
However, high amount of added buffer was required to obtain high PSI and WHC. Then, that factor should be regulated according to the desired PSI and WHC in the final product. Similarly, pH should be regulated according to the desired ESI in the final product.
Since a low concentration of bitter peptides is always required in the formulation of flavoring additives, the highest values of all factors should be selected within the studied range. These conditions will also favor the ability to retain water and the solubility of the goat cheese hydrolyzed proteins. However, the amount of added buffer should be regulated according to the desired viscosity in the final product, since it could be affected as it was previously mentioned.
After optimization, the release of soluble proteins from goat cheese to the supernatant (NT) and the hydrolysis degree of proteins into the supernatant (NA) were increased to 278 and 188%, respectively. PSI, WHC, EAI, and ESI were increased to 231, 450, 235, and 210%, respectively. η and HW were increased to 40 and 190%, respectively. The So was decreased to 94% in regard to the original protein isolates. FC and FS were extremely low or null under the studied conditions.
Predicted values were experimentally confirmed and compared with those of the original protein isolates.
Desirability designs have allowed us to find the right combination of particular factor ranges in order to obtain several products, with optimal functional properties, for being added to selected food systems. This procedure can facilitate the manufacture of different protein products starting always with the same group of ingredients. The starting material can be one or more proteins (hydrolyzed or not), whose functional properties are desired to be modified.
Consequently, the results obtained in this work contributed to establish the best conditions for designing and producing of novel tailor-made flavoring additives, with desirable functional properties, based on hydrolyzed goat cheese proteins, for addition to different food systems.
Acknowledgments
The authors wish to thank the generous and valuable collaboration of Dr. Gerardo Enrique Camí (Area of Inorganic Chemistry, Faculty of Chemistry, Biochemistry, and Pharmacy, National University of San Luis, San Luis, Argentina), by performing FTIR spectra.