Chapter 11
Best Practice #10
Implement Insights with Data Storytelling and Change Management
“Those who tell the stories rule society.”
Plato
The previous nine best practices focused mainly on deriving insights. But all the hard work involved in deriving insights from data should be communicated well to the stakeholders so that appropriate business actions can be derived using the insights. Unless the insights are communicated and presented effectively for consumption, the data used for analytics, or the sophistication of the analytics models or the complexity of statistical analysis doesn’t really matter. So, how can one effectively present the insights? One effective best practice technique is data storytelling.
Data storytelling has been an integral part of humanity for thousands of years. Analysis of the most popular 500 TED talk presentations found that stories made up at least 65% of their content [Dykes, 2016]. Telling stories is more effective because it is more memorable and persuasive than reporting statistics. Chip Heath, a professor at Stanford University, found that when students are asked to recall speeches, 63% remembered the stories, and only 5% remembered any individual statistic. Therefore, the insights gleaned from data should be presented in the form of stories so that those insights can be consumed appropriately.
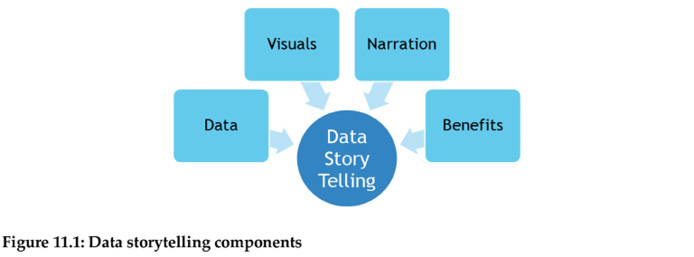
Fundamentally data storytelling is communicating the insights from data in a structured manner. Based on the work of data visualization expert Stephen Few, storytelling is a combination of four key elements: data, visuals, narrative, and benefits [Few, 2013], and this can help in explaining, enlightening, and engaging the audience. Narrative, when coupled with data helps to explain to the audience what is happening in the data and why an insight is important. When visuals (charts and graphs) are applied to data, they can enlighten the audience to insights. When narrative and visuals are merged, they can engage the audience. Finally, the insights should communicate the benefits in a financial manner as the primary goal of a business enterprise is to offer financial returns to its stakeholders.
So, when the right visuals, narrative, data is presented in a manner that offers financial benefits to the business, you have a compelling data story that can drive change. So, when it comes time to change and deploy analytics, good change management helps so that the resulting solutions are accepted within the business. The data storytelling framework is as illustrated below.
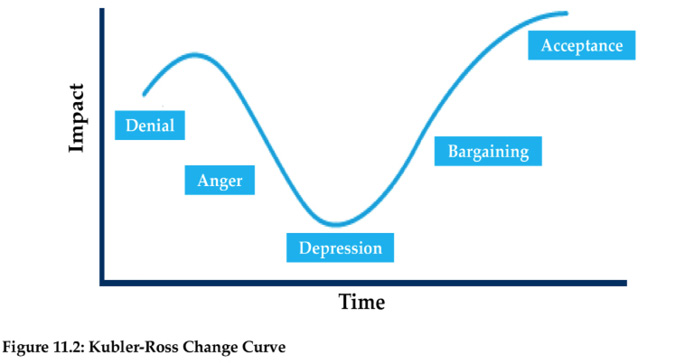
Data storytelling needs to be integrated with change management in managing and transitioning individuals, teams, and organizations to a desired future state. Fundamentally, making decisions and taking actions from insights is a combination of data storytelling and change management. According to Robert Schaffer, a world-renowned management consultant, all management is change management [Schaffer, 2017]. Change management happens at the individual level, and the Kubler-Ross change curve helps in understanding how people will respond to change while communicating insights. The five stages of change are shown in Figure 11.2 [Kubler-Ross and Kessler, 2005].
Why is this a best practice?
Today, an unprecedented amount of data is used for generating insights. These insights must be communicated in a clear way to the business stakeholders so that decisions can be taken. According to Google’s Chief Economist, Dr. Hal Varian stated, “The ability to take data, understand it, process it, extract value from it, visualize it, and communicate it—is going to be a hugely important skill in the next decades” [Dykes, 2016]. However, as business data gets bigger and more complex, the ability to tell a compelling story on the insights derived to the business stakeholders becomes more important than ever. According to Tom Davenport, Fellow of the MIT Center for Digital Business, there are four key reasons why data storytelling is important to organizations [Davenport, 2015].
- Data stories supply context, insight, interpretation—all the things that make data meaningful and analytics more relevant and interesting.
- No matter how impressive the analysis is, or how high the data quality is, one is not going to compel change unless the stakeholders understand the insights. That may require a visual story or a narrative one, but they require a story.
- Most people cannot understand the details of analytics, but they do want evidence of analysis and data. Stories that incorporate data and analytics are more convincing than those based on anecdotes.
- Businesses need the salient findings from an analysis in a brief, snappy way. Stories fit the bill.
While a data story is the first dimension of implementing the insights, change management is the second dimension. Change management is important if the insights need to be consumed for taking action. Change is unsettling for almost every human being. According to Prosci, a well-known change management company, companies with excellent change management are six times more likely to reach their objectives than those with poor change management [Prosci, 2019]. It is, therefore, important for companies to manage change as effectively as possible during the process of data storytelling because managing a successful change can positively affect business productivity.
Realizing the best practice
As discussed earlier, this best practice of implementing insights has two key elements – data storytelling and change management. We will start first on realizing the elements behind data storytelling.
The closer you are to your business, the more insight intensive you become.
Data storytelling
The first best practice in implementing insights is with data storytelling. Data storytelling is communicating the insights from data in a structured way, using a combination of four key elements: data, visuals, narrative, and benefits.
Data in data storytelling
We have discussed the role of data in analytics in the previous chapters. But when telling an effective data story, the business stakeholders need to know three main aspects of data.
- Relation or the association of data to the problem. For example, if the business objective is on improving the sales performance of the retail store, then the expectation is that key data objects like store data, product data, customer demographic data, and PoS (Point of sale) data were used for analytics.
- A data source is where the data was extracted and used for deriving insights. The source where the data will be sourced for deriving insights should ideally be the data capture system, that is, the transactional IT system or the data warehouse or data lake system. As discussed in the data governance best practices section – the chances of getting good quality data increased if you are source data from the initial stages of the data lifecycle. Hence it is better to source data from IT systems that are in the initial stages of the DLC.
- Key data quality dimensions, such as accuracy, timeliness, security, and privacy. While in Chapter 5, we discussed the 12 data quality dimensions, the important data quality dimensions that matter from the data storytelling perspective are:
- Accuracy. This is the degree to which the data correctly describes the “real world” entities and events.
- Timeliness is the freshness in data. If the analytics is on the sales performance of the retail store, it is imperative that the analytics is done with the most recent data set like the last 12 months or 18 months.
- Security and privacy. This is how the data is extracted and kept secure for analytics. For example, if the data on the sales performance of the retail store includes product margins, it should be secured so that vendors do not get access to the list price of their products.
Visuals in data storytelling
They say that a picture is worth a thousand words. This is because the way the human brain processes information, using charts or graphs is easier than reviewing details over spreadsheets or reports. Data Visuals or Visual Analytics is the pictorial or graphical representation of data. It enables decision-makers to see data and insights visually, so they can grasp difficult concepts or identify new patterns and trends. If the visuals are interactive, one can drill down into charts and graphs for more detail, changing what data to see and how it is processed. Given that analytics is fundamentally using data to answer business questions, data visuals like bar graphs, pie-charts, and scatter charts, can be categorized into four sections: comparison, relationship, distribution, and trends. These four main question categories were mapped to the 13 visuals in the discussion on dashboards in chapter 7.
Persuasive narration in data storytelling
The third key element in data storytelling is persuasive narration. Narration turns a story into the information or knowledge for the recipient. Technically a narrative has five basic elements: the characters, the setting, the plot, the conflict, and the resolution.
- In business analytics, the characters are the consumers of insights who will convert the insights into actions.
- The setting is the location or the environment of the story. In business analytics, this includes the business and analytics drivers, concerns, and threats of the business and its stakeholders.
- The plot is the sequence of events that make up the story. In analytics, it is the methodology on how the goal, problem, and questions were formulated, data selected, algorithms picked, and the insights derived. In this phase, identify emotional drivers as it will help determine what your business stakeholders truly care about. According to Seth Godin, entrepreneur and author, “People do not buy goods and services. They buy relations, stories, and magic.” Harvard Business School professor Gerald Zaltman says that 95% of our purchase decision making takes place in the subconscious mind [Zaltman, 2003]. Renowned psychologists Daniel Kahneman and Amos Tversky have shown that humans often make choices that defy clear logic [Tversky and Kahneman, 1974].
- The fourth dimension in persuasive narration is conflict. Every story has a conflict or problem to solve, and in analytics, the conflict is the value proposition of doing analytics for business insights and results. Value proposition defines the call-to-action—the prompt for immediate response or action based on insights.
- Finally, the fifth element of narration, resolution, is the solution to the problem. It is on how the insights can be used to derive actions for better business performance and results.
Benefits in data storytelling
Finally, the fourth aspect of data storytelling is the financial aspects. That means the value of insights should be presented in financial benefits using three key metrics - NPV (net present value), WACC (weighted average cost of capital), and Return on Invested Capital (ROIC).
- NPV is the difference between the present value of cash inflows and the present value of cash outflows over a period.
- The WACC is the rate that a company is expected to pay its investors. WACC is a metric a company can use to make better decisions on how to allocate their capital. WACC is the average cost of raising capital – equity and debt.
- Lastly, ROIC is the measure of return that investors are earning from the capital invested in the business. The term ROIC and ROI can be used interchangeably.
The NPV is used to calculate ROIC. So, if the ROIC on the analytics initiative is more than the company’s WACC, then there is a better chance of getting stakeholder’s approval. Below is an example where ROIC is calculated using the cash flow of US$ 5.6, US$ 5.9, and US$ 6.2 million for each of the three years against an investment of US$12.2 million and compared against the WACC of 7.8% to assess the financial viability of the analytics initiative. In this case, the ROIC is 25.4 % indicating that the proposed analytics initiative is highly profitable for the business.

Change management in analytics
The second key element in implementing insights after data storytelling is effective change management. Successful analytics initiatives require good change management so that the insights are consumed by business stakeholders. The most cited reason for the failure of any business initiatives is the problems with the people side of change. Change management is the discipline that guides how we prepare, equip, and support individuals to successfully adopt change in order to drive organizational outcomes. It includes methods that redirect or redefine the use of resources, business processes, budget allocations, or other modes of operation that significantly change a company or organization.
According to Gartner, the cultural challenges to accept change are the main reason why analytics projects fail [Gartner, 2019]. While many of the change management practices like training and communication are applicable to analytics initiatives, the key change management aspects specific to analytics are linking the insights to the goal, the prevailing KPIs, and the impact of insights on the existing business process. The ADKAR model, which is a goal-oriented change management model, looks at change as a process and not as an event. ADKAR is an acronym that represents the five milestones or outcomes necessary for change to be successful: awareness, desire, knowledge, ability, and reinforcement. The three states of change—current state, transition state, and future state—provide a powerful framework for the process-oriented approach of the ADKAR Model.
Conclusion
Analytics initiatives often face confusion and resistance when communicating insights. By adopting the right change management strategies and the four key data storytelling tactics, analytics initiatives can turn resistance into engagement and business results. Unless the data sets and insights are presented well, no one will act on it, and no change will occur. At the same time, data storytelling is not just about communicating insights; sometimes, it is what not to communicate and this requires an understanding of the market, business, and the insight consumers. Ultimately data per se is just a collection of numbers; it must be turned into a story such that data and insights are consumed appropriately.
References
- Abela, V, “Chart Suggestions—A Thought-Starter,” https://bit.ly/2WZKpFM, 2009.
- Davenport, Tom, https://bit.ly/2wQZC1k, Jan 2015.
- Dykes, Brent, “Data Storytelling: The Essential Data Science Skill Everyone Needs,” https://bit.ly/2WZuzem, Mar 2016.
- Few, Stephen, “Information Dashboard Design: Displaying Data for At-a-Glance Monitoring,” Analytics Press, 2013.
- Kubler-Ross, Elisabeth and David Kessler, “On Grief and Grieving: Finding the Meaning of Grief through the Five Stages of Loss,” Scribner’s & Company, 2005.
- Prosci, https://bit.ly/3atmVNc, 2019.
- Schaffer, Robert, “All Management Is Change Management,” Harvard Business Review, Oct 2017.
- Tversky, Amos and Kahneman, Daniel, “Judgment under Uncertainty: Heuristics and Biases,” Science, Sep 1974.
- Zaltman, Gerald, “How Customers Think: Essential Insights into the Mind of the Market,” Harvard Business School Press, 2003.