Chapter 4
Best Practice #3
Understand the Data from the Analytics View
“Not everything that counts can be counted, and not everything that can be counted counts.”
Attributed to Albert Einstein
Data is the fundamental building block of analytics; there is practically no analytics without data. In business enterprises, both big and small data are used in leading, planning, controlling, and operating a business organization that provides goods and/or services to their customers. Specifically, enterprise or business data has three key characteristics.
- Enterprise data has multiple stakeholders or consumers. Enterprise data is typically shared and used in business operations across various LoBs (lines of business). As the goals of the LoB vary, the same enterprise data is viewed and consumed differently by different types of stakeholders. For example, the vendor payment terms, which are the established conditions between the vendor and the client organization to settle the payment of invoices, can be Net30, Net60, and so on. For example, Net30 specifies that the net amount to be paid in full by the buyer within 30 days of the date when the goods are received or when the service is completed. These payment terms are usually viewed by the finance department from a cost perspective, while the procurement views the same vendor payment term from a service perspective.
- Enterprise data is purpose and context-driven. Fundamentally, the three main purposes of the data are to help businesses in operations, compliance, and decision making. In other words, the purpose of enterprise data is to connect business processes on operations, compliance, and decision making. For example, the vendor payment-term data say Net30 is captured based on the business process established between the vendors and the client. Once the payment-term data is populated and used in the purchase order, the client is committed to honoring those terms in the payment process.
- Enterprise data has compliance implications. Enterprise data is subject to compliance requirements – regulatory, industry standards, and internal business rules. Enterprise data has legal implications due to regulations such as SOX (Sarbanes-Oxley), PCI-DSS (Payment Card Industry Data Security Standard), HIPAA (Health Insurance Portability and Accountability Act) and GAPP/IFRS and hence the data has to be securely protected against unauthenticated and unauthorized access. Apart from security, enterprise data is subject to privacy laws such as PIPEDA, GDPR, CCPA, and so on, industry standards like UNSPSC, UPC, PIDX, NACS, etc., and the internal policies of the company. (Refer to appendix 2 for the abbreviations.)
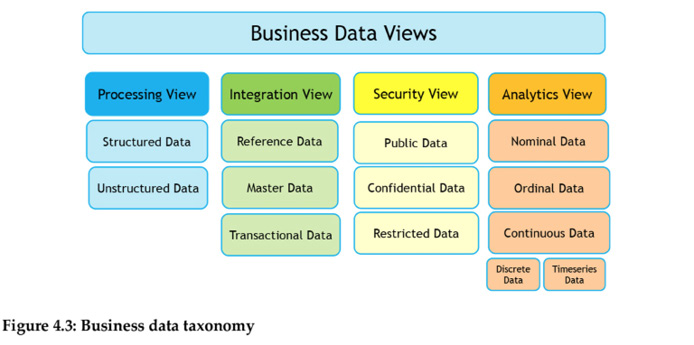
Today businesses are creating huge volumes of data at an astonishing pace. While this offers numerous opportunities for the business, it also presents significant challenges in deriving good insights. One way for businesses to better manage data is to organize or classify the data into appropriate categories, given that classification is an important management function. In this backdrop, from the business perspective, enterprise or business data can be broadly classified into four stakeholder views as shown below.
- Storage
- Integration
- Compliance
- Analytics
The data classification based on these four views is as shown in the figure below. The storage, integration, and compliance views are usually based on the native or unprocessed state of data. This native data type should be transformed or processed into the fourth view, the analytics view, so that appropriate insights can be derived for decision making.

Classification based on storage

Enterprise data is physically stored in IT systems. There are two main kinds of data storage: primary and secondary. Primary data storage refers to the memory storage that is directly accessible to the processor, such as registers, cache, and RAM (Random Access Memory). Data in the primary data storage is volatile. Secondary storage involves storing data for long-term use. Common examples of secondary storage devices are magnetic disks, optical disks, hard disks, flash drives, and magnetic tapes. However, from the business perspective, storing enterprise data refers to the data stored in the secondary storage devices. The data storage can happen in two main forms - structured and unstructured.
- Structured Data. Data that resides in a fixed format or structure within a database record or file is structured data. Examples are data stored in the database and spreadsheets.
- Unstructured Data. Unstructured data is the data in its native state. That is, data that doesn’t have a predefined data structure or format when created. Examples are data in documents, videos, voice, images, etc.
Incidentally, the majority of the data that is stored in enterprises is unstructured data. Experts estimate that 80% to 90% of the data in any organization is unstructured, and the amount of unstructured data in enterprises is growing significantly — often many times faster than structured databases [Davis, 2019].
Classification based on integration
The second classification view is based on data integration. Businesses serve the needs of the customers by executing business processes. These pertinent business processes, when executed, result in the capture of data as entities, events, and categories. These types of enterprise data reside in different IT systems in different LoB and create a need for an integrated or unified view of the business processes in the enterprise. From the integration point of view, enterprise data can be of three types – reference data, master data, and transactional data.
- Reference data represents business categories such as manufacturing units, currency, stores, and so on. From the software application perspective, reference data is also known as configuration data.
- Master data is a representation of critical business entities such as products, suppliers, assets, and customers. Master data is considered the backbone of the enterprise and is often called the “golden record” or the “single version of the truth.” In its truest sense, master data is the single and authoritative source of business data.
Master Data is the foundation for quality data. MDM (Master Data Management) is the process that manages master data in the entire DLC.
Master data generally falls into three types:
- People such as customers, employees, suppliers, and agencies
- Things to capture products, parts, devices, equipment, and assets
- Concepts, including contracts, warranties, General Ledger (GL) accounts, profit centers, and licenses
Transactional data record business events or actions such as purchase orders, invoices, and sales orders. While master data is about business entities (typically nouns), transactional data is about business events (usually verbs).
These three types of data based on integration, reference data, master data, and transactional data, have different levels of reusability. Reference data has high reusability in the company, while transactional data, which is highly contextual to the location, purpose, and time, has low reusability. All three types of data are tied to metadata, which holds technical attributes of the data like type and length. The relationship between the three types of data from the integration point of view is as shown.

Classification based on compliance
The third classification view is on data compliance. Inappropriate handling of the business data will have adverse consequences for the business. Hence enterprise data is assigned a level of sensitivity based on the adverse impacts to the business if the data is compromised. Also, the classification of data based on compliance helps determine what baseline security controls are appropriate for safeguarding that data. From the compliance point of view, enterprise data are of three main types: restricted, confidential, and public.
- Restricted data includes statutory, regulated, and personal data. These data types have the highest level of sensitivity and cover data elements such as SINs, credit card numbers, bank accounts, and health information. Today, data privacy especially is very important in the functioning of the business. Many countries have privacy-related laws and regulations, and examples include the Canadian Personal Information Protection and Electronic Documents Act (PIPEDA), General Data Protection Regulation (GDPR), and the California Consumer Privacy Act (CCPA). These privacy laws recognize the rights of users and address the dangers of the commercial use of personally identifiable data.
- Confidential data will have medium sensitivity and covers data used for internal business operations such as personnel information, product designs, customer and supplier contracts, sales and purchase orders, and salary slips. Access to confidential data is only to those who have a legitimate business purpose.
- Public data will have a low level of sensitivity, which makes them easily accessible to anyone. Examples include the company’s annual reports, location address, and web and social media pages. This type of data has no restriction on access or usage from copyright, patents, or other mechanisms of control. For example, Open data in Canada provides online access to everyone to the data collected by the Canadian governments.
Classification based on analytics
As said earlier, the above three views of data, storage, integration, and compliance, are usually based on the native state of data. This native data type should be transformed into the fourth view, the analytics view, so insights can be derived for decision making using statistical tools. From the analytics point of view, there are four types of data – Nominal, Ordinal, Interval, and Ratio types.
- Nominal data are used for labeling or categorizing data. It does not involve a numerical value, and hence no calculations can be done. Examples of nominal data are gender, product description, customer address, and the like.
- Ordinal data is the order of the values, but the differences between each one is not really known. Common examples here are companies based on market capitalization, vendor payment terms, customer satisfaction scores, goods delivery priority, date/time, and so on.
- Interval data is about finite numerical values with no zero values. In interval data, if there are zero values, the entity will not exist. For example, the number of employees in a company is interval data. If the number of employees in a company is zero, that means the entity (the company) practically doesn’t exist.
- A ratio scale has all the properties of an interval scale with a meaningful zero. For example, the zero in the company’s profit means the company did not make any money, but the company still exists.
Interval and ratio level data types represent numeric or quantitative values. They are amenable to statistical techniques, and these two data types can be grouped together as continuous data – which again could be classified as discrete data or time-series data.
- Discrete data is capturing events that are infrequent or irregular. This is typically created by people based on discrete business events like purchase orders, work orders, invoices, field tickets, PoS (Point of Sale) transactions, and so on.

- Time-series collect data in a regular and more granular manner. A time series is a sequence taken at successive and equally spaced points in time. This data is usually created automatically and have no clear association with business events. In addition, time-series data accumulates very quickly. Examples of time series data are capturing GPS coordinates of a truck every five seconds, capturing machine vibrations every second using the IoT (Internet of Things) infrastructure, and so on.
So, from the analytics view, data can be of three main types – nominal, ordinal, and continuous. The business data taxonomy based on four classification views is shown below.
Regardless of the four types of views, all the data types are tied to the metadata. Metadata is used to describe another data element’s characteristics or attributes; metadata is simply “data about data,” and not the data that is used by the business. Metadata is further is classified into three types:
- Technical metadata is used to describe data structures or technical aspects. Examples are field length, type, size, and so on.
- Business metadata is used to describe the non-technical aspects of the data and their usage. Examples are report name, document name, class, document type, and others.
- Log metadata, which describes details on how, when, and by whom the data object was created, updated, or deleted. Examples are timestamp, created date, created by, changed date, and so on.
Metadata alone has no real business utility and is always married to one or more of the above four views of data. But from a data management perspective, metadata is very useful, especially during data integration and is the foundation of digital asset management (DAM), a mechanism to store, share, and organize digital assets in a central location. Figure 4.4 shows an example from the SAP ERP system where the log metadata is on the sales orders.

Figure 4.5 contains another example, where a Retail tech start-up in Silicon Valley - Glisten has a solution to automatically translate a product image into detailed metadata with advanced computer vision techniques.

Why is this a best practice?
As mentioned in the earlier sections of this chapter, the three ways of viewing or classifying data based on storage, integration, and compliance are usually done when the data is captured in the native or inherent state. But if the data needs to be consumed for analytics in decision-making, it should be transformed or mapped into the analytics view so insights can be derived using statistical analysis.
But why should one transform the data into an analytics view, that is, nominal, ordinal, and continuous data types? For example, if the data in the native format is qualitative in nature, that is, in the nominal data or categorical data format, that data will not be subject to statistical analysis. Continuous data types, such as interval and ratio data types, offer capabilities for statistical analysis using statistical tools such as averages, standard deviations, t-tests, regression, and ANOVA (Analysis of variance). This helps in deriving precise, objective, and accurate insights.
So the nominal data type is simply used to classify data, ordinal data types are used to order data, and continuous data types, such as interval data and ratio data types, provide capabilities for statistical analysis. Fundamentally, continuous data types are much more definite and precise. This objectivity from the continuous data type improves the legitimacy of the insights derived. Hence, statistical analysis is popular in almost all areas of the business, including strategy, marketing, finance, production, supply chain, costing, IT, legal, and human resources (HR). The table below is the mapping of the three analytics data types, nominal, ordinal, or continuous data types, to the key statistical operations.
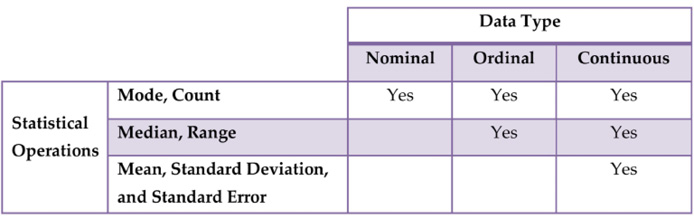
NOTE: Standard Deviation and Standard Error are two key measures of data variation. Standard Deviation is a measure of data accuracy, while Standard Error is a measure of precision in data.
Realizing the best practice
How does one realize this best practice? Transforming the native data to the consumption view, that is, the analytics view, has three main steps.
- Profiling the enterprise data
- Transforming the native data to the analytics view
- Balancing the cost and business value in the different analytics data types
Profiling the enterprise data
According to Ralph Kimball, a world-renowned BI expert, data profiling is a systematic analysis of the data [Kimball 2008]. In the business context, data profiling is the process of reviewing the data source, and understanding the data structure, type, content, and interrelationships between attributes, volume, the ingestion mechanism. Data profiling is important as it provides useful insights for understanding the data well. In addition, data profiling insights can be used to improve the quality of data so that the insights derived from analytics are reliable.
Data profiling is not a one-time activity; it is an ongoing exercise as part of continuous improvement.
Broadly there are three key steps in profiling business data.
- Column profiling counts the number of times every value appears within each column or attribute of the database table.
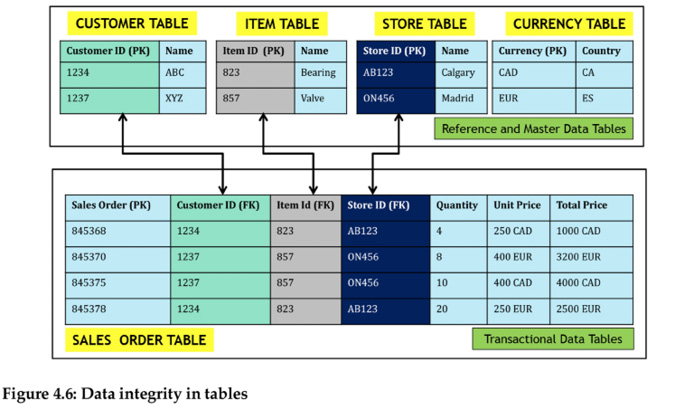
- Cross-column profiling looks across columns in the table to perform primary key (PK) and foreign key (FK) dependency analysis and to determine the dependent relationships within a data set. The PK uniquely identifies a record in the table, while the FK is a field in the table that is the PK in another table. A simple PK-FK relationship in the context of reference, master and transactional data is in Figure 4.6.
- Cross-table profiling looks across tables to identify potential foreign keys. It also attempts to determine the similarities and differences between the database tables to determine which data might be redundant and which could be mapped together.
The outcome of data profiling is the data catalog. A data catalog is an inventory of data assets in the organization. The catalog provides the context to understand relevant datasets for extracting business value efficiently.
Transforming the data into the analytics view
As data profiling gives a good understanding of the data, the second capability is on the mechanics of transforming the data into the analytics view. Functionally, data, when it is originated and captured, is mainly for compliance and operational activities. This is the native state of the data; data is rarely originated and captured for analytics. Analytics in business is usually a by-product of compliance and operational activities.
For example, the KYC (Know Your Customer) feature in the Indian Banking industry was started for financial compliance, that is, to address financial fraud and money laundering. But today, the same customer data from KYC is used extensively for customer analytics by the Indian banks. Another example is on vendor purchase orders, which is an operational contract between the company and the supplier. But solid spend analytics depends on a good number of “operational” purchase data records. If the data needs to be used effectively for analytics, the data should be transformed from compliance or operational views into the analytics view.
Analytics data types, that is, nominal, ordinal, or continuous data types, which are subject to statistical analysis, derive precise and accurate insights. For example, a text-based or qualitative data in a purchase order might be good for compliance and operations, but the text-based purchase order data is not effective for analytics. The qualitative or text-centric description will not provide insights as effectively compared to numeric or quantitative data. But if the purchase order is structured with the item code (nominal data), payment terms (ordinal data), and price (continuous data), then much more insights can be derived. Text-based unstructured data is quite common in business enterprises as inspection reports, contracts, emails, social media comments, and customer complaints are all text-based unstructured data. Figure 4.7 is an example where an invoice is in an unstructured or document format, that is, a native view, is transformed into a structured data or analytics view.

So, what are the techniques to transform unstructured or text data into structured data? This process of deriving insights from text-based content is known as text analytics or text mining. There are six key techniques in text analytics, and Figure 4.8 is the flowchart for applying these six concepts.
- Information Retrieval and Extraction - Analyze unstructured text and find out the keywords, and phrases
- Categorization/Classification - Classify text under one or more categories.
- Clustering - Group text content with similar contents
- Natural Language Processing (NLP) - Enabling computers to analyze and understand human language.
- Summarization - Reduce the length of the document and summarize the details
- Visualization - Simplify the process of finding/displaying relevant information.

Balancing cost and business value in deriving analytics data type
The third capability deals with balancing the cost and business value in deriving analytics data types as realizing any best practice capability comes with the efficient utilization of business resources. In this backdrop, transforming the native data, especially the unstructured data to the analytics type of data, is a trade-off between the cost of data transformation to the analytics data type and the business value. While the continuous data type provides computational or statistical capabilities due to their inherent numeric features, they also demand a commitment of organizational resources.
Improving the data quality demands a thorough understanding of the company’s products, services, customers, and the market the company is operating in.
To explain this concept, let us take a simple example in the supply chain where the delivery priority has options like urgent, priority, and standard. This delivery priority field is ordinal or ordered data where the urgent deliveries are delivered sooner than priority, and the priority deliveries are delivered sooner than the standard deliveries. If the ordinal data in the delivery type field is to be mapped and converted to continuous data, say one day for urgent orders, three days for priority orders, and seven days standard, it means there is a commitment on the resource utilization from the organization to deliver the goods to the customer within the stipulated or agreed time. While the continuous type of data gives options for statistical analysis, ultimately resulting in more objective and precise insights, it demands the commitment of the business resources to deliver those objective business outcomes.
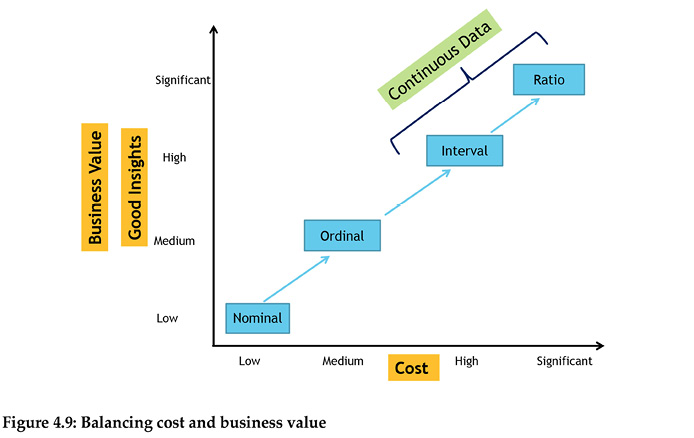
Overall, transforming the data from the native state, especially the unstructured data format, to the analytics classification state (nominal, ordinal, and continuous) is balancing the business value of the insights derived to the cost of enabling business resources to provide that capability. This relationship is illustrated in Figure 4.9. The data transformation from native state to analytics state is not a purely technical endeavor; it is an exercise of business resource optimization. The best way to optimize business resources depends on the nature of the resources, that is, the decision variables, the business constraints at hand, and the organization’s objectives. Technically, this means maximizing or minimizing, as appropriate, the performance objective by assigning values to the decision variables that satisfy the constraints. We will revisit this optimization topic again in chapter 8.
Conclusion
The origination of business data is mainly for compliance and operations, and in the process, the data is stored, integrated, and secured. However, this native state of data doesn’t necessarily mean that the data is ready for analytics. If the data is needed for insights, then the data should be made available in an analytics format. While the analytics data types, that is, nominal, ordinal, and continuous data types, provide opportunities for statistical analytics and better insights, they also demand the commitment of the valuable resources of the organization. Business management is all about optimal utilization of the resources, and transforming the data to the analytics view demands different levels of resource consumption. Hence, if the business is looking at becoming a data-driven enterprise, data management, classification, and transformation to analytics view should be treated as a trade-off between cost and business value.
References
- Davis, Dwight, “AI Unleashes the Power of Unstructured Data,” https://bit.ly/3bD9QkC, Jul 2019.
- Kimball, Ralph, “The Data Warehouse Lifecycle Toolkit,” Wiley, 2008.
- Loshin, David, “Master Data Management,” Morgan Kaufmann, 2009.
- Southekal, Prashanth, “Data for Business Performance,” Technics Publications, 2017.