Chapter 8
Best Practice #7
Use Continuous Refinement and Validation as the Mainstay of Advanced Analytics
“Prediction is very difficult, especially if it’s about the future.”
Niels Bohr
Predictive and prescriptive analytics together form advanced analytics. Predictive analytics is making predictions about the future based on historical data to identify risks and opportunities. Given that planning is one of the key functions of management on the future direction of the company, predictive analytics enables business enterprises to proactively anticipate business outcomes, behaviors, and events to better plan, influence, and respond. While predictive analytics is predicting the future event, prescriptive analytics is finding the best course of action for a given situation using optimization techniques to address constraints and trade-offs. Predictive and prescriptive analytics are used in almost every industry. Examples include asset failure (Oil & Gas), fraud detection (Banking), customer churn (Retail), predicting epidemics (HealthCare), prediction of weather patterns (Agriculture), to name few.
Let us first discuss the first element of advanced analytics - predictive analytics. Technically, predictive analytics is predicting one targeted or dependent variable based on several independent predictors or variables. Predictive analytics can broadly be grouped into two areas:
- Analyst-driven or Regression techniques
- Data-driven or Machine Learning (ML) techniques.

With analyst driven or regression techniques, the focus is on establishing an analytics model to represent the relationships between the independent and the dependent variables. Depending on the question and the data type, there are a wide variety of regression models such as linear regression, logistic regression, polynomial regression, and so on that can be applied while performing predictive analytics.
Machine learning (ML), employs techniques to enable computers to learn from data without being explicitly programmed. ML works out the predictions and recalibrates models in near real-time automatically, while the analyst-driven predictive analytics models work strictly on “cause” data and must be refreshed with “changed” data. There are two main types of ML techniques: Supervised ML and Unsupervised ML.
- In Supervised ML, the data scientist guides the algorithm on the outputs the algorithm should come up with. Supervised ML requires that the algorithm’s possible outputs are already known and that the data used to train the algorithm is already labeled with the correct answers. For example, in the retail industry context, a classification algorithm, which is a type of Supervised ML, will be used to identify products after being trained on a dataset of images that are properly labeled with the product type and some identifying characteristics.
- Unsupervised ML is more closely aligned with true artificial intelligence (AI) — the idea that a computer can learn to identify complex processes and patterns without a data scientist to provide guidance along the way. For example, unsupervised ML can be used for customer segmentation because it will return groups based on parameters that a data scientist may not consider due to his/her pre-existing biases on the past sales performance, economic factors, competition, and other factors.
The second element of advanced analytics is prescriptive analytics. Prescriptive analysis works on the independent variables to achieve the best possible outcome and then prescribes the best course of action using optimization techniques. Optimization techniques enable minimizing or maximizing the objectives or performance criteria. There are two different types of optimization methods:
- Exact optimization methods
- Heuristic optimization methods.
Exact optimization methods determine an optimal solution by maximizing or minimizing the performance criteria. Exact optimization techniques include the Simplex and Gauss-Newton methods. In Heuristic optimization methods, there is no guarantee that an optimal solution will be found. It gives sub-optimal solutions. Common heuristic optimization techniques are Genetic algorithms and Ant-colony algorithms.
Predictive and prescriptive analytics are co-dependent disciplines; they are NOT mutually exclusive. IBM says - predictive and prescriptive analytics go together like birds of a feather [Kuttappa, 2019]. Predictive analytics helps in identifying the variables that impact the future, while prescriptive analytics provides options where one can weigh the variables against one another. Predictive analytics forecasts what might happen in the future with an acceptable level of reliability, while prescriptive analytics will help in identifying the optimal set of variables. In business management, these variables are often business resources like time, money, and labor.
For example, in multiple linear regression (MLR), the model reliability and the independent variable selection is based on threshold levels set for metrics like r-square, P-value, F-value, standard error, and standard deviation. The variables selected using the above criteria to form the MLR regression model meet the statistical criteria, but they are not the optimal list of variables that can maximize or minimize the outcome. The optimal set of independent variables can be selected with what-if scenarios in prescriptive analytics such that the business resources are optimized.
Let us take an example of applying predictive and prescriptive analytics in the trucking or the freight industry. Predictive analytics can be used to make availability forecasts of when the shipping containers would become available for pickup at terminals. But the next step is dispatching and scheduling the fleet of truckers for the actual pickup, and this is where prescriptive analytics come into the picture. Another example where the predictive and prescriptive analytics are often used together is in the oil industry. Oil refineries apply predictive analytics techniques to predict the price of crude oil and refined oil products like gasoline and diesel. Based on the predicted prices, refineries apply prescriptive analytics techniques to determine the best way to blend the crude oil feed to maximize revenue under constraints like environmental regulations, contractual demands of the gas stations, and so on.
Why is this a best practice?
As predictive and prescriptive analytics is about predicting the future and optimizing the variables; the insights or output always have a degree of likelihood or probabilities and not absolute certainties. Hence the insights in both predictive and prescriptive analytics have some degree of uncertainty, that is, measurement of variability in the data. This uncertainty usually comes from two key sources: Systematic error and Random error
The systematic error occurs because of the imperfections in the data analytics value chain such as goal formulation, data collection, data integration, statistical analysis, to name a few. Random error, on the other hand, occurs because of the unknown, uncontrollable, and unpredictable reasons. While the systematic error can be reduced and controlled, random error is often difficult to reduce or eliminate as it is unpredictable.
But businesses despise uncertainty, especially the uncertainty that is associated with the systematic error. Given that both predictive and prescriptive analytics are inherently probabilistic, businesses look for capabilities or practices where the uncertainty in the process can be reduced or even eliminated. A best practice to deal with uncertainty is to go for the continuous refinement and validation of the output values coming out from predictive and prescriptive analytics.
Realizing the best practice
As the real or the actual values in both predictive and prescriptive analytics will be available only in the future, we need options to often validate the solution. So what strategies are available for continuously refining and validating the advanced analytics models? There are three main strategies here:
- Cross-validation of data
- Validation of output from multiple algorithms
- What-if scenarios on the variables.
Cross-validation of data
Cross-validation is a statistical technique of splitting or partitioning or folding the data into subsets – training and test. The training data is used to train and build the prediction model, while the test data is used to evaluate the performance of the prediction model. To reduce variability in the output, multiple rounds of cross-validation are performed with different combinations of data subsets. The fundamental idea of cross-validation is to hide one part of the data, learn on the rest, and then check or validate the “knowledge” on what was hidden.
Let us look at the above process in more detail. As mentioned above, the available dataset is randomly partitioned into two sets: training data sets and test data sets. The training data set is the larger data set, which is about 80% of the data, and the testing data set is a smaller data set, which is the remaining 20% of the data. The training data is again randomly divided into “N” smaller blocks. Each time “N-1” training subsets are chosen, and the one remaining data subset becomes the test data subset. The output derived using (N-1) training subset data is validated against the test subset data. On the next run, the former test subset becomes one of the training subsets for deriving the output, and one of the former training subsets becomes the test data subset to validate the output. The process continues until all the data subsets are utilized either as training or test subsets to have a robust “trained” analytics model.
Once there is a “trained” analytics model, we come back to the initial state where the data was divided into 80% training dataset and 20% test data set. The data in the testing data set already contains known values for the Y (dependent or the target variable). The analytics model is executed and validated against the 20% test data to determine whether the model’s prediction or output is valid. The cross-validation process is as shown in Figure 8.1.
Output validation from multiple algorithms
While cross-validation deals with input, that is, the data to feed the analytics model, the second-best practice deals with algorithms. To have a robust analytics model, one must confirm the output from multiple algorithms or statistical models. For example, even though simple and multiple linear regression algorithms are the most popular prediction analytics algorithms, there are other prediction algorithms like Logistic Regression, ARIMA (AutoRegressive Integrated Moving Average), CART (Classification and Regression Trees), SVM (Support vector machines), and so on. As discussed in the first chapter, analytics is using data to answer business questions to get insights. Getting insights is dependent on the algorithms selected, and the selection of the algorithm is largely dependent on the question formulated and the data type.

How the question is formulated, and the type of data, determines the algorithm selected? Say the business question is – will my retail store in Denver, Colorado, make a profit in January of 2022? As the business question is a binary classification question, profit or loss, logistic regression is the recommended algorithm. However, along with logistic regression, SVM (Support vector machine) algorithm can also be used to get insights and classify the store as a profitable one or not. In this way, we can have multiple algorithms confirming the same result. Here is an example, where SAS Viya, a leading analytics software used multiple algorithms and suggested that gradient boosting, a type of regression and classification algorithm is the recommended algorithm for a particular use case of customer churn in a retail chain.

What-if scenarios
The third strategy of realizing this best practice is in applying the what-if scenarios. Predictive analytics predicts the output of the dependent variable using independent variables. As mentioned before, in businesses, these independent variables are often resources like money, time, energy, products, materials, and land. Given that business management is about optimal resource management, these variables or resources selected must be optimized. Basically, there are two steps here: variable selection and variable optimization.
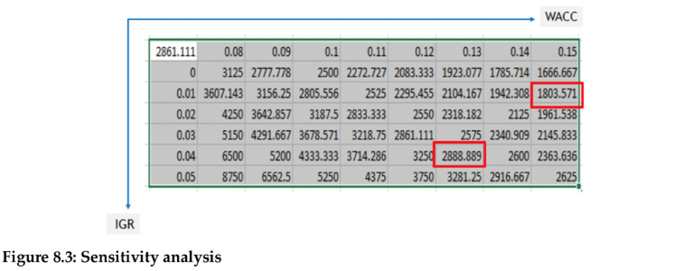
On the variable selection step, multi-collinearity and overfitting techniques ensure that the independent variables selected in the prediction model are valid and can be considered for optimization. Multicollinearity is a state of very high inter-associations among the independent variables resulting in one or more independent variables being redundant. Overfitting is a phenomenon when the analytics model has “learned” too much from the training data and does not perform well in practice as a result. Overfitting is usually caused by the model having too much exposure to the training data. The second step is to get an optimized variable set. Once we have the list of independent variables selected, different ‘what if’ scenarios can help in identifying the best or optimized future scenarios. ‘What-if’ scenarios, also known as sensitivity analysis, is basically asking questions on the most likely future situations businesses need to manage. Technically, ‘What- if’ scenarios analyze how the different values of independent variables affect the dependent variable or output under certain specific conditions or constraints. The sensitivity analysis estimates how sensitive the dependent variable is to a change in an independent variable(s). As the independent variables are resources and resources are typically constrained in business, what-if analysis provides insights on how the resources can be optimally managed.
Below is an example of the application of what-if analysis in the calculation of the firm valuation, that is, terminal valuation (TV). The TV is calculated using two input variables, IGR (industry growth rate) and WACC (weighted average cost of capital). For example, if the IGR is 4% and if the WACC is 13%, then the TV of the firm is US$ 2888.89 million. On the other hand, if the IGR is 1% and if the WACC is 15%, then the TV of the firm will be US$ 1803.57 million.
Conclusion
Advanced analytics, which is a combination of predictive analytics and prescriptive analytics, is inherently probabilistic in nature. This means there is subjectivity and uncertainty in the output, or the insights derived. This uncertainty can be minimized by continuously validating and refining the analytics model. In addition, there is an increasing emphasis on monetizing data these days by optimizing business resource consumption. While there are many approaches, one of the ways to monetize data is to leverage advanced analytics, that is, predictive and prescriptive analytics techniques, and use the business resources optimally. The next chapter will cover more on data monetization. But the fundamentals of the advanced analytics remain the same as basic or descriptive analytics; the data quality needs to be good, and the outputs must be constantly refined and validated before the insights can be consumed in the most optimal manner.
References
- Bean, Randy and Davenport, Thomas, “Companies Are Failing in Their Efforts to Become Data-Driven,” Harvard Business Review, Feb 2019.
- Uthappa, Sajan “Why prescriptive analytics and decision optimization are crucial,” https://ibm.co/2wQvrY5, Apr 2019.