CHAPTER FIVE
Basic Bond Yield Calculations
Bonds have numerous yield measures. Calculating the various yields is not difficult, but using the right yield measure at the right time is often confusing. In this chapter, we’ll look at the basic yield measures and the correct circumstance in which to use them.
COUPON YIELD
The coupon yield equals the number of dollars of interest per year divided by the bond’s face value. If the bond pays $70 per year, then the coupon is $70/$1,000 = 7%. A coupon yield is only used to describe a bond such as the IBM 7% of June 15, 2043.
Aside from identifying the bond, the current yield has no useful application. The calculation doesn’t accurately measure the client’s real return because the calculation doesn’t include any provision for:
- Buying the bond at a price other than par
- Amortizing any premium or discount
- Assessing the impact of any embedded options
- Reinvesting the interest payments at different rates
- Assessing the impact of taxes
- Assessing the impact of inflation
CURRENT YIELD
The current yield equals the number of dollars in interest per year divided by the current value of the bond. It is sometimes referred to as the cash-on-cash return.
If the 7% IBM bond mentioned in the “Coupon Yield” section was priced at $800, the current return would be 70/800 = 8.75%. If that same 7% bond was priced at $1,150, the current return would be 70/1150 = 6.09%.
This yield calculation makes a provision for the investor buying the bond at a discount or premium—but excludes any provision for:
- Amortizing any premium or discount
- Assessing the impact of any embedded options
- Reinvesting the interest payments at different rates
- Assessing the impact of taxes
- Assessing the impact of inflation
The only investors who are concerned with current return are retirees. Consider the following: A welder retires after 30 years of service. He receives a check for $400,000 and goes to a local brokerage office. He wants the highest yield he can get while only taking a reasonable amount of risk.
Family history suggests a projected longevity of 75 years. His broker builds a portfolio of A rated bonds that have a long maturity (25–30 years) because they offer the highest yield. Typically, the broker would choose bonds that pay interest in each month, so the retiree would get a monthly interest check. Since the bonds will mature long after the welder is dead, the amortization toward par is of little significance to the welder. The retiree simply wants to know what his or her income will be without touching the principal.
YIELD TO MATURITY
The yield to maturity is the internal rate of return of a bond’s cash flows including any accretion or amortization toward par. It is the one yield that, when used to discount the future cash flows, results in the sum of those cash flows equaling the price or PV of the bond.
In other words, the YTM incorporates the bond’s interest payments as well as any accretion or amortization to par at maturity, as shown in Figure 5.1.
FIGURE 5.1
YTM Calculation of PV

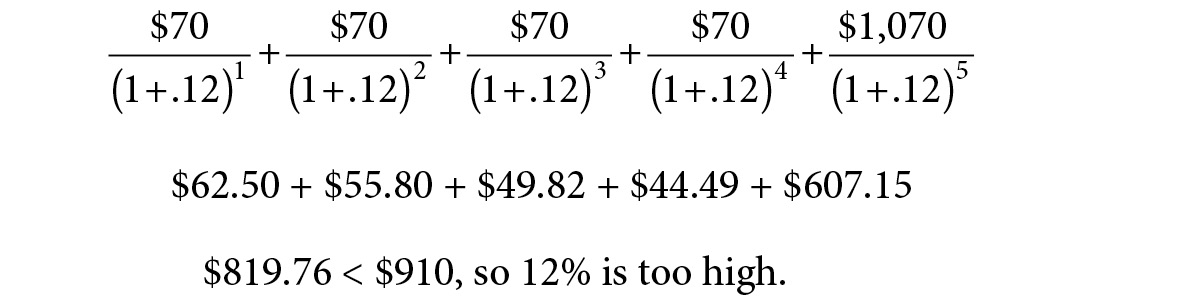
To illustrate, let’s look at a 5-year 7% eurobond, which is selling in the secondary market for $910. An investor buying this bond and holding it to maturity would receive $70 per year in interest and $90 in capital accretion spread over 5 years. Entering the data on this bond into the formula depicted in Figure 5.1 would result in the equation shown in Figure 5.2.
FIGURE 5.2
YTM Calculation of a 5-Year 7% Eurobond

Solving this equation for y (where y represents the yield used to discount the future cash flows) requires an iterative process, which means we try a number, see if the result is too big or too small, and then try another number until we get it right. Suppose we start with 12%, as shown in Figure 5.3.
FIGURE 5.3
12% Yield Used to Discount the Future Cash Flows
With the knowledge that 12% is too high, we try 8%, as shown in Figure 5.4.
8% Yield Used to Discount the Future Cash Flows

With 8% too low and 12% too high, we try 10%, 9%, 9.5%, 9.25%, etc., until we arrive at 9.33%, as shown in Figure 5.5.
FIGURE 5.5
9.33% Yield Used to Discount the Future Cash Flows

The YTM is the most commonly quoted return. It’s the return that’s quoted in the Wall Street Journal and on the brokers’ pricing screens. It’s the yield that’s discussed by the analysts on all the TV shows. However, buying bonds with the highest YTM for a given rating and maturity is rarely the best strategy for investors. This is because YTM makes no provision for:
- Assessing the impact of any embedded options
- Reinvesting the interest payments at different rates
- Assessing the impact of taxes
- Assessing the impact of inflation
Therefore, just because a bond has a YTM of 8.925% does not mean the investor’s wealth will increase by 8.925%. Consider the following two bonds:
- ABC—A rated non-call 2% 25-year bond priced at $577.18 to offer a 5% YTM
- DEF—A rated non-call 10% 25-year bond priced at $1,726.50 to offer a 4.9% YTM
Both bonds have the same maturity and credit rating, but ABC offers an extra 10 basis points of YTM. However, this isn’t the whole story. Suppose you thought interest rates were going to rise! Which bond would you prefer?
ABC generates only $20 per bond to reinvest at the higher rates as rates rise. On the other hand, DEF generates $100 per bond to reinvest at the higher rate! In order to make a fair comparison, an equal amount of money has to be invested in both bonds. Assuming you do reinvest at 10%, three ABC bonds would grow to be $8,900.82, while one DEF bond would grow to $10,834.71. The higher coupon is more valuable over time than the extra 10 basis points of YTM.
In general, if rates are expected to rise, investors should buy bonds with high coupons. Using this strategy, they can quickly reinvest at the higher rates and drag the average return of their portfolios up. If they expect rates to decline, they should buy zero coupon bonds so they don’t have to reinvest interest payments at progressively lower rates. From 1982 to 2012, interest rates in the United States declined. Investors who bought 30-year zeros in 1982 enjoyed 30 years of not having to reinvest at progressively lower rates.
Consider the return difference between a 16% 30-year eurobond and a 30-year euro ZCB priced to offer a 16% return over a 30-year period in which rates decline by .5% a year. (Assume a tax-free account.) The ZCB, with no interest payments to reinvest at the lower rates, returns 16%. It costs $11.65 and returns $1,000 in 30 years. Figure 5.6 shows the coupon bond return.
FIGURE 5.6
The 16% Coupon Bond Return
|
Time |
Payment |
Reinvestment Rate |
Payments + Interest Earned on Interest Paid |
|
0 |
-$1,000 |
||
|
1 |
$160 |
15% |
$184 |
|
2 |
$160 |
14.5% |
$393.88 |
|
3 |
$160 |
14% |
$631.42 |
|
4 |
$160 |
13.5% |
$898.27 |
|
5 |
$160 |
13% |
$1,195.84 |
|
6 |
$160 |
12.5% |
$1,525.32 |
|
7 |
$160 |
12% |
$1,887.56 |
|
8 |
$160 |
11.5% |
$2,283.03 |
|
9 |
$160 |
11% |
$2,711.76 |
|
10 |
$160 |
10.5% |
$3,173.30 |
|
11 |
$160 |
10% |
$3,666.62 |
|
12 |
$160 |
9.5% |
$4,190.15 |
|
13 |
$160 |
9% |
$4,741.67 |
|
14 |
$160 |
8.5% |
$5,318.31 |
|
15 |
$160 |
8% |
$5,916.57 |
|
16 |
$160 |
7.5% |
$6,532.32 |
|
17 |
$160 |
7% |
$7,160.78 |
|
18 |
$160 |
6.5% |
$7,796.63 |
|
19 |
$160 |
6% |
$8,434.03 |
|
20 |
$160 |
5.5% |
$9,066.70 |
|
21 |
$160 |
5% |
$9,688.03 |
|
22 |
$160 |
4.5% |
$10,291.20 |
|
23 |
$160 |
4% |
$10,869.24 |
|
24 |
$160 |
3.5% |
$11,415.27 |
|
25 |
$160 |
3% |
$11,922.53 |
|
26 |
$160 |
2.5% |
$12,384.59 |
|
27 |
$160 |
2% |
$12,795.48 |
|
28 |
$160 |
1.5% |
$13,149.81 |
|
29 |
$160 |
1% |
$13,442.91 |
|
30 |
$160 |
0% |
$14,602.91 |
|
Overall Rate |
9.349% |
||
The ZCB outperformed the coupon bond by 6.651% before the extra transaction costs of reinvesting were imposed.
In addition, suppose you did some research and discovered that while both bonds have the same “A” credit rating today, last year ABC was rated AA, while DEF was rated BBB. In other words, the credit quality of ABC is declining while the credit quality of DEF is increasing. If these trends continue, then in a few years ABC could be rated BB, while DEF could be rated AA.
Very often the bonds that offer the highest YTMs have the wrong coupon for the market environment (low in a rising rate environment and high in a declining rate environment) and a negative credit trajectory. Be very cautious when selecting bonds based on their YTMs.
Embedded Options
The yield-to-call calculation is identical to the YTM calculation—with the exception that the call price and call date are substituted for the maturity value and maturity date.
The yield-to-put calculation is also is identical to the YTM calculation—with the exception that the put price and put date are substituted for the maturity value and maturity date.
The yield-to-maturity of a sinking fund bond is the weighted average of the various YTMs on the bond’s various retirement dates.
The yield-to-worst is the lowest of all the yields.
The flaw in the YTM calculation (and all its associated calculations) is that it looks at the return at a moment in time. Investors have to look at the return over an investment horizon if they are to be successful. Over an investment horizon, the following factors are all quite relevant:
- Rate(s) at which payments are reinvested
- Taxes, and changes in tax rates
- Inflation, and changes in inflation rate
Let’s look at some yield measures that incorporate the above variables.
REALIZED COMPOUND YIELD (RCY)
In the YTM calculation, one of two assumptions is made. Either the interest payments:
- Are spent as soon as they are received, so there is no reinvestment issue.
- Are assumed to be reinvested at the same YTM as the bond offered on the day it was bought.
For example, if an investor bought a 20-year 8% bond at par, the YTM calculation assumes that the:
- First interest payment in 6 months will be reinvested for 19.5 years at 8%
- Mid-term interest payment in 10 years will be reinvested for 10 years at 8%
- Last payment before maturity in 19.5 years will be reinvested for 6 months at 8%
For the reinvestment YTM assumption to be true, the yield curve would have to be both fixed and flat. The yield curve is neither flat nor fixed; therefore, this is a stupid assumption.
Instead of assuming that the interest payments are reinvested at the YTM, the RCY calculation assumes different reinvestment rate(s). If, when interest payments come in, they are reinvested in a money market fund, the assumed reinvestment rate should be the money market fund rate. If the investor expects hyperinflation with rates hitting 20%, then 20% should be used for projections. Some investors assume each cash flow will be reinvested at the implied forward rate.
To calculate the RCY, assuming one reinvestment rate, first calculate the T$R which equals P + I + IOI. For this example, since the bond is held to maturity, the P is $1,000. I + IOI can be calculated as a simple PV / FV problem. Looking at a 25-year 7% eurobond priced at par, and assuming a 3% reinvestment rate, the T$R is calculated using the data shown in Figure 5.7.
In the First Part of RCY Calculation, Calculate the Total “Interest” Plus “Interest on Interest” Earned Over the Entire Investment Time Frame by Using the FV Key
|
Variable |
Definition |
Example |
|
n |
Number of periods |
25 |
|
I |
Reinvestment rate (per Period) |
3% |
|
PV |
$0—there is no I or IOI at the start |
$0 |
|
PMT |
Periodic payment |
$70 |
|
FV |
What we are solving for |
? = $2,552.15 |
In other words, 25 payments of $70 compounded at 3% is equal to $2,552.15. Since the interest is $1,750 (25 × $70), the IOI must be $802.15 ($2,552.15 − $1,750). Thus the T$R will be:
T$R = P + I + IOI
T$R = $1,000 + $1,750 + $802.15
T$R = $3,225.15
Now that we know the T$R, we can calculate the RCY as a second PV / FV problem, using the data shown in Figure 5.8.
FIGURE 5.8
In the 2nd Part of RCY Calculation, the Bond Is Reduced to a Zero Coupon Bond and the Overall Return Is Determined
|
Variable |
Definition |
Example |
|
n |
Number of periods |
25 |
|
I |
What we are solving for |
? = 4.80% |
|
PV |
$1,000—price of bond |
-$1,000 |
|
PMT |
$0 All payment are in the FV |
$0 |
|
FV |
The T$R |
$3,225.15 |
This passes the reasonable test. With the original principal earning 7% and the reinvestment earning 3%, the overall return has to be somewhere in between the two returns. In this example, only one reinvestment rate was assumed. Of course, a different rate can be assumed for each reinvestment period.
While the RCY calculation accounts for a hopefully realistic assumption about reinvestment risk, it still makes no provision for taxes or inflation. What type of investor has to reinvest but is exempt from taxes and inflation? Qualified retirement accounts are exempt from current taxation. However, in order to be exempt from inflation, the liabilities have to be fixed. Certain defined benefit plans have fixed liabilities. For example, suppose a defined benefit plan promises to pay an employee $1MM after 25 years of employment. In this case, the company has to accumulate the $1MM over the 25 years of the employee’s employment. If the investment performance is good, the employer’s costs are low; if the performance is poor, the costs are higher. The employer assumes the investment risk.
However, since the liability is fixed the employer isn’t worried about inflation. The employer’s obligation ends with the payment of $1MM. That sum may allow the employer to enjoy a rich and long retirement or may be enough for a single meal, but that is the employee’s problem. Depending upon the assumed reinvestment rate, the choice of which bond to buy may be the one with the highest YTM. Consider the two bonds depicted in Figure 5.9.
High YTM Doesn’t Equal Higher RCY
|
YTM |
RCY |
|
|
A |
7% |
4.5% |
|
B |
7.2% |
4.3% |
Since the RCYs are lower than the YTMs, we can conclude that the assumed reinvestment rate is lower than the YTM. Bond B offers a higher YTM, but a lower RCY. The reason Bond B offers a lower RCY is that it has a higher coupon and, therefore, more of its cash flow money is reinvested at the lower rate. Again, if rates are expected to fall, you want to select low coupon bonds; if rates rise, you want to select high coupon bonds.
NET REALIZED COMPOUND YIELD
The RCY calculation can also be performed on an after-tax basis. The after-tax RCY is referred to as the net realized compound yield (NRCY). The investment’s after-tax return could be calculated as the overall return from the amount invested to the total number of after-tax dollars accumulated at the end of the investment horizon—the so-called after-tax total dollar return (T$RT).
Tax-Free vs. Taxable Investments
Most investors underestimate the impact of taxes. For example, suppose an investor in the 50% tax bracket buys a 10% eurobond at par. The traditional way in which the after-tax yield of investments is calculated is only valid when the assumption is made that the interest payments are not reinvested. Here is the traditional formula:
Pre-Tax Yield × (1 − Tax Rate) = After-Tax Return
What is the after-tax return if you reinvest? It is not 5%. It is less than 5%. The reason is depicted in Figure 5.10.
FIGURE 5.10
After-Tax Return Comparison for a Tax-Free Investor and a 50% Tax Rate Investor

After 2 years:
- A tax-free investor has $210 ($200 of I and $10 of IOI)
- A taxable investor has $102.50 ($100 of I and $2.50 of IOI)
While a 50% tax rate reduces the interest component by 50%, it reduces the interest-on-interest by 75%. It causes a 75% reduction because the I is dropped by 50%. This reduces the amount reinvested by 50%, which reduces the IOI by 50%. Then, the lower IOI is itself subject to a 50% tax. If I is reduced by 50% and IOI is reduced by 75%, the overall impact of a 50% tax rate is greater than 50%.
Calculating NRCY
Figures 5.11 and 5.12 show examples of NRCY calculation data.
FIGURE 5.11
Calculating the I + IOI on an After-Tax Basis
|
Variable |
Definition |
Example |
|
n |
Number of periods |
25 |
|
I |
After-tax reinvestment rate |
1.5% |
|
PV |
$0—there is no I or IOI at the start |
$0 |
|
PMT |
After-tax periodic payment |
$35 |
|
FV |
What we are solving for |
$1,052.21 |
Thus, T$RT is PT + IT + IOIT = $1,000 + $875 + $177.21 = $2,052.21
FIGURE 5.12
Calculating the Overall Rate
|
Variable |
Definition |
Example |
|
n |
Number of periods |
25 |
|
I |
What we are solving for |
2.92% |
|
PV |
$1,000—price of bond |
-$1,000 |
|
PMT |
$0 All payment are in the FV |
$0 |
|
FV |
The T$R |
$2,052.21 |
The NRCY is appropriate for certain types of investors, such as some life insurance companies. Life insurance companies have to reinvest and pay taxes, but because of the laws of statistics, the company’s liabilities are effectively fixed. The company may not know which of its policy holders will die, but it knows how many will die and what it will have to pay out. That effectively fixes the company’s liabilities and shields it from the impact of inflation.
Consider these two bonds:
- Bond A—8% 20-year eurobond priced at par
- Bond B—2% 20-year eurobond priced to offer a 7.9% YTM
If we assume that the reinvestment rate is 6%, the income tax rate is 40%, and the capital gains rate is 20%, let’s compare the NRCYs.
Bond A
|
After-Tax I + IOI |
||
|
n |
20 |
|
|
I |
After-tax rate (6% × .6) |
3.6% |
|
PV |
0 |
|
|
PMT |
After-tax payment ($80 × .6) |
$48 |
|
FV |
I + IOI After Tax |
? = $1,371.46 |
|
NRCY |
||
|
n |
20 |
|
|
I |
? = 4.412% |
|
|
PV |
Price |
-$1,000 |
|
PMT |
0 |
|
|
FV |
T$R ($1,000 + I + IOI) |
$2,371.46 |
|
After-Tax I + IOI |
||
|
n |
20 |
|
|
i |
After-tax rate (2% × .6) |
1.2% |
|
PV |
0 |
|
|
PMT |
After-tax payment ($20 × .6) |
$12 |
|
FV |
After-tax I + IOI |
$269.43 |
|
NRCY |
||
|
N |
20 |
|
|
I |
5.22% |
|
|
PV |
Price of bond @ 7.9% YTM |
-416.39 |
|
PMT |
0 |
|
|
FV |
IT + IOIT + PT $269.43 + [$1,000 − (($1,000 − $416.39) × .2)] |
$1,152.71 |
Even though Bond B has a lower YTM, it has a higher NRCY because it has a lower coupon and is selling at a discount. A significant part of Bond B’s return is taxed at the lower capital gains rate (20%) vs. the higher income tax rate (40%).
NET-NET REALIZED COMPOUND YIELD
The net-net realized compound yield (NNRCY) incorporates different reinvestment rates, taxes, and the impact of inflation. If the investor is subject to inflation, the NRCY must also be reduced by the inflation rate. If the NRCY and the inflation rate are expressed using the same compounding frequency and calendar convention, the inflation rate can simply be subtracted from the yield in order to determine the after-inflation yield. For example, if the inflation rate was 3% An/An 30/360, the NNRCY would be calculated as follows:
2.92% − 3% = –.08% or –8 basis points
If the bond’s yield and the inflation are not expressed using the same calendar convention and compounding frequency, one rate or the other has to be converted before the inflation rate is subtracted.
For example, if the inflation rate was quoted Q 30/360, the NNRCY would be calculated like this:
(1 + .03/4)4 = 3.03%
2.92% − 3.03% = –.11% or –11 basis points
Note that depending upon the investor’s assumptions regarding the reinvestment rate, the tax rate, and inflation rate, the NNRCY can often be negative. When this happens, don’t buy bonds. It is ridiculous to buy bonds when their projected after-tax real return is negative. Instead buy equities, real estate, antiques—anything but bonds.