CHAPTER SEVEN
Valuing Bonds Using the Zero Curve
The value of any investment is the PV of the future cash flows. Consider the following example where you buy a bond in the secondary market that will generate the following five cash flows spaced 1 year apart.

Since the five cash flows occur at different times, they should be discounted at different rates, as shown in Figure 7.1. In fact, the best way to conceptualize a bond is just that: It is a collection of zero coupon bonds.
Valuing Bond Using Spot Rates
|
Bond Cash Flow # |
Future Face Value |
Appropriate ZCB Rates |
Present Value |
|
1 |
$80 |
3% |
$77.67 |
|
2 |
$80 |
4% |
$73.96 |
|
3 |
$80 |
4.75% |
$69.60 |
|
4 |
$80 |
5.25% |
$65.19 |
|
5 |
$1,080 |
5.50% |
$826.35 |
|
Total |
$1,112.78 |
Each cash flow should be discounted at the appropriate discount rate for when the cash flow occurs. The discount rate would equal the current yield of zero coupon bonds with the same maturity and credit quality. After all, it doesn’t make any difference if an AA rated cash flow that comes due in 5 years is sold:
- By itself, as in the case of a zero coupon bond
- As part of a collection of cash flows, as depicted in Figure 7.1
Its present value should be the same.
The present values of the five cash flows were shown in the last column of Figure 7.1. Put simply, the value of the bond is equal to the sum of the present value of the cash flows the investor receives. In this example, the PV equals $1,112.78.


Now, while each cash flow is discounted at a different rate, we need a way to express the overall return. The overall return (YTM) is the weighted average of the individual spot rates.

|
Variable |
Input |
|
n |
5 |
|
I |
? |
|
PV |
–$1,112.78 |
|
PMT |
80 |
|
FV |
1,000 |
|
Answer |
5.37% |
Since the yield of the individual cash flows ranges from 3% to 5.5%, the weighted average has to be between those two values. Since the last cash flow at 5.5% is so much larger than the others, it should slant the average toward the high end of 5.5%. Thus, the yield to maturity is 5.37%. While the YTM is 5.37%, it is important that no single cash flow in the bond is offering a return of 5.37%; that is simply the weighted average of the individual spot rates.
Thus, the key to valuing any risk-free bond is to start with the AAA spot curve to find the right discount rates for the future cash flows. Interpolation can be used to fill in any blank spaces in the zero curve. For example, consider the spot yields depicted in Figure 7.2.
Current Spot Rates
|
ZCB Maturity |
AAA Yields |
|
1 |
2.20% |
|
3 |
3.41% |
|
6 |
4.17% |
|
12 |
4.93% |
|
24 |
5.70% |
|
36 |
6.14% |
|
60 |
6.80% |
|
120 |
7.47% |
|
240 |
8.19% |
|
360 |
8.67% |
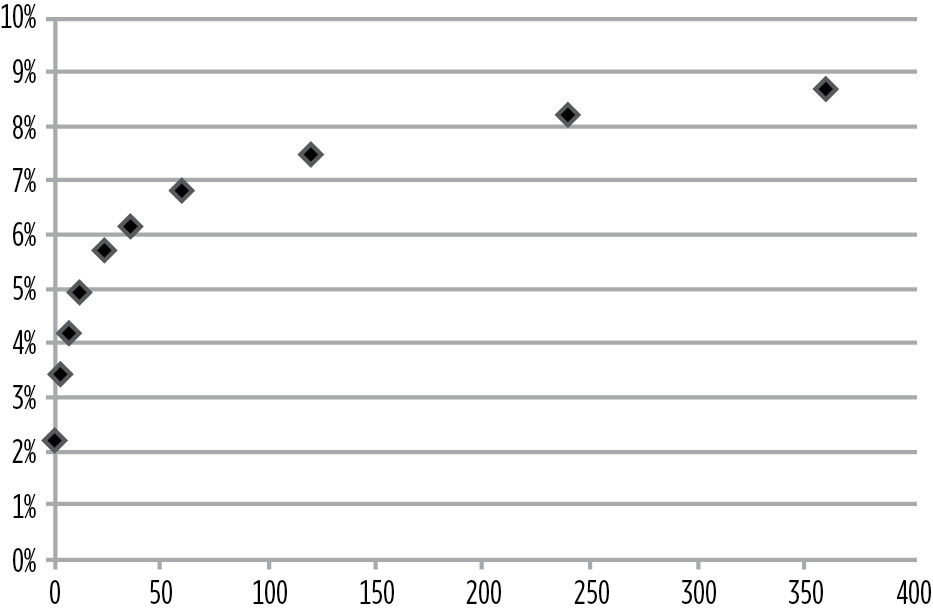
Enter the data from Figure 7.2 into Excel, and select “insert chart,” “scatter,” and then select the chart that plots only the data points. A graph like the one shown in Figure 7.3 should appear.
FIGURE 7.3
X:Y Chart of Data Points

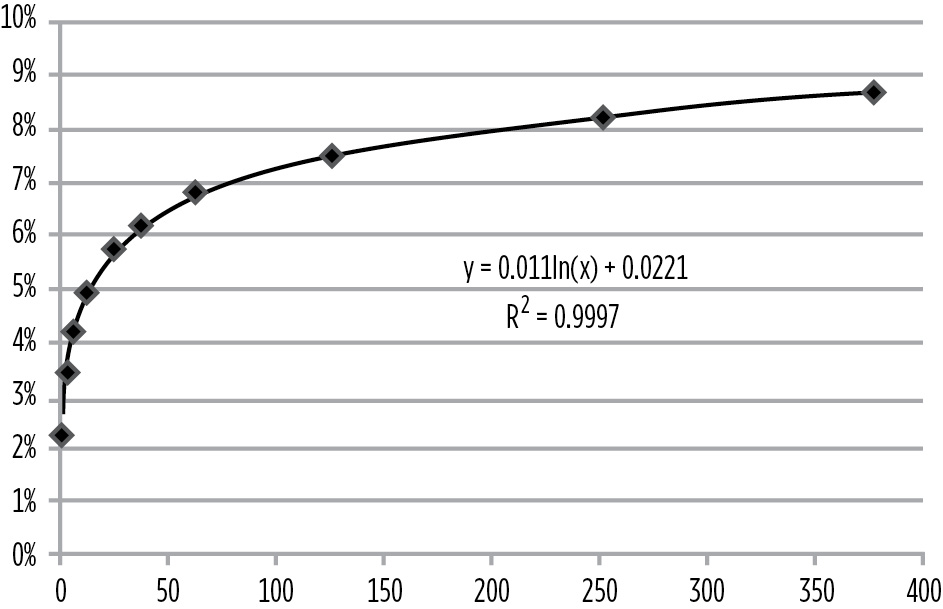
Once the data points are charted, right-click on one data point and select “add trendline.” Select the logarithmic alternative, and then check “display equation on chart” and “display R-squared value on chart.” Your result should look like Figure 7.4 and display the formula for the yield curve.
FIGURE 7.4
Formula for Yield Curve

Given this spot curve, solve the following problems.
PROBLEM 7A
What is the price and YTM of a 9-year zero coupon bond?
ANSWER:
Since the bond is a ZCB, there is only one cash flow. The appropriate discount rate can be determined using the regression formula shown in Figure 7.4:
y = 0.011ln(x) + 0.0221
Since the bond is a 9-year bond and 9 years is 108 months, the discount rate is:
7.36% monthly rate expressed annually = 0.011 × ln(108) + 0.0221)
Discounting $1,000 at a rate of 7.36% / 12 for 108 months yields = $516.66
PROBLEM 7B
What is the price and YTM of a 10-year 12% eurobond?
ANSWER:
Treat the 10 annual cash flows as individual cash flows and calculate the appropriate discount rates and present values. Then, sum the present values to obtain the price. Use that price to solve for the average yield, the YTM.
|
Months |
Cash Flow |
Yield |
Price |
|
12 |
$120 |
4.94% |
$114.35 |
|
24 |
$120 |
5.71% |
$107.39 |
|
36 |
$120 |
6.15% |
$100.32 |
|
48 |
$120 |
6.47% |
$93.39 |
|
60 |
$120 |
6.71% |
$86.71 |
|
72 |
$120 |
6.91% |
$80.35 |
|
84 |
$120 |
7.08% |
$74.32 |
|
96 |
$120 |
7.23% |
$68.65 |
|
108 |
$120 |
7.36% |
$63.33 |
|
120 |
$1,120 |
7.48% |
$544.62 |
|
Price |
$1,333.43 |
||
|
Yield |
7.65% |
What is the price and YTM of a 5-year A rated 5% eurobond that trades at a spread of 45 basis points to the zero curve?
ANSWER:
Calculate the five discount rates. Add 45 basis points to each rate. Calculate the price and yield.

PROBLEM 7D
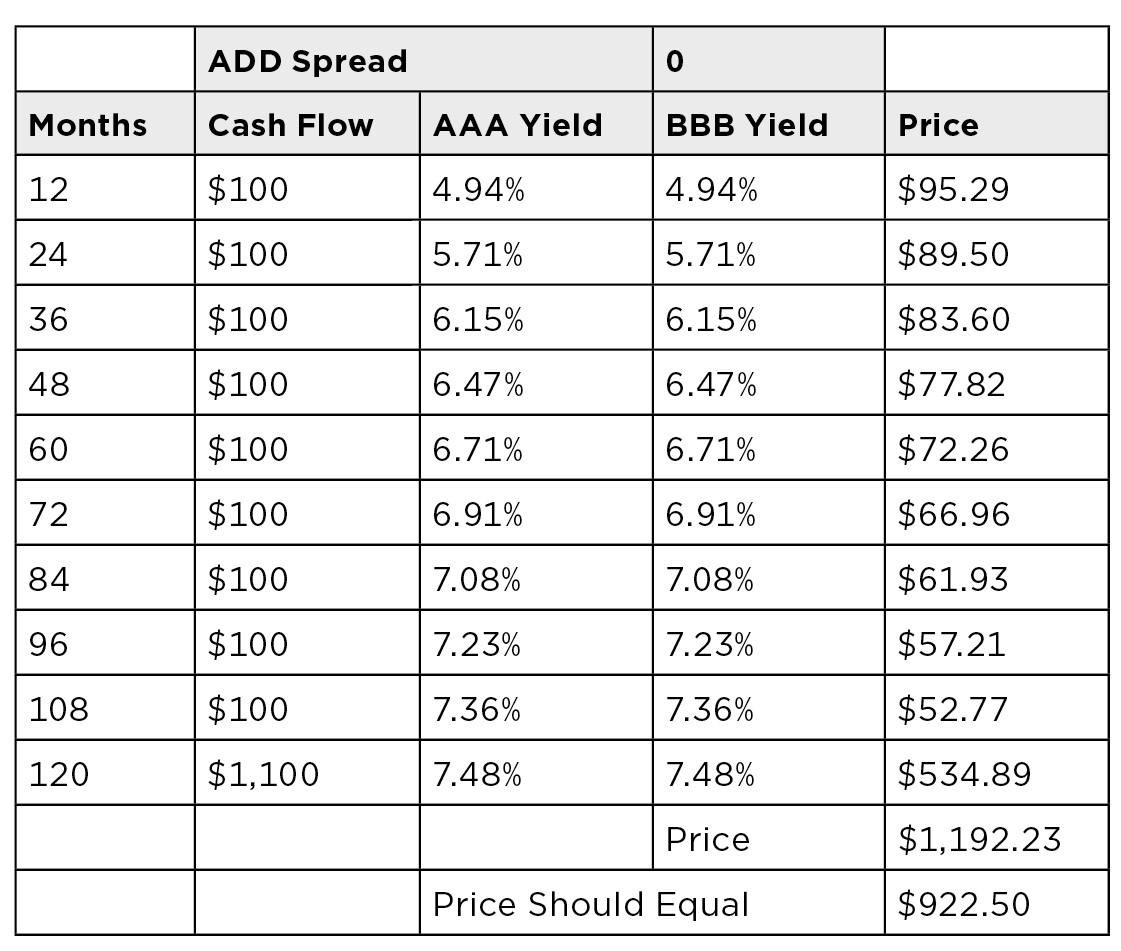
What is bond’s yield spread so the AAA zero curve of a 10-year 10% BBB bond is priced at $922.50?
ANSWER:
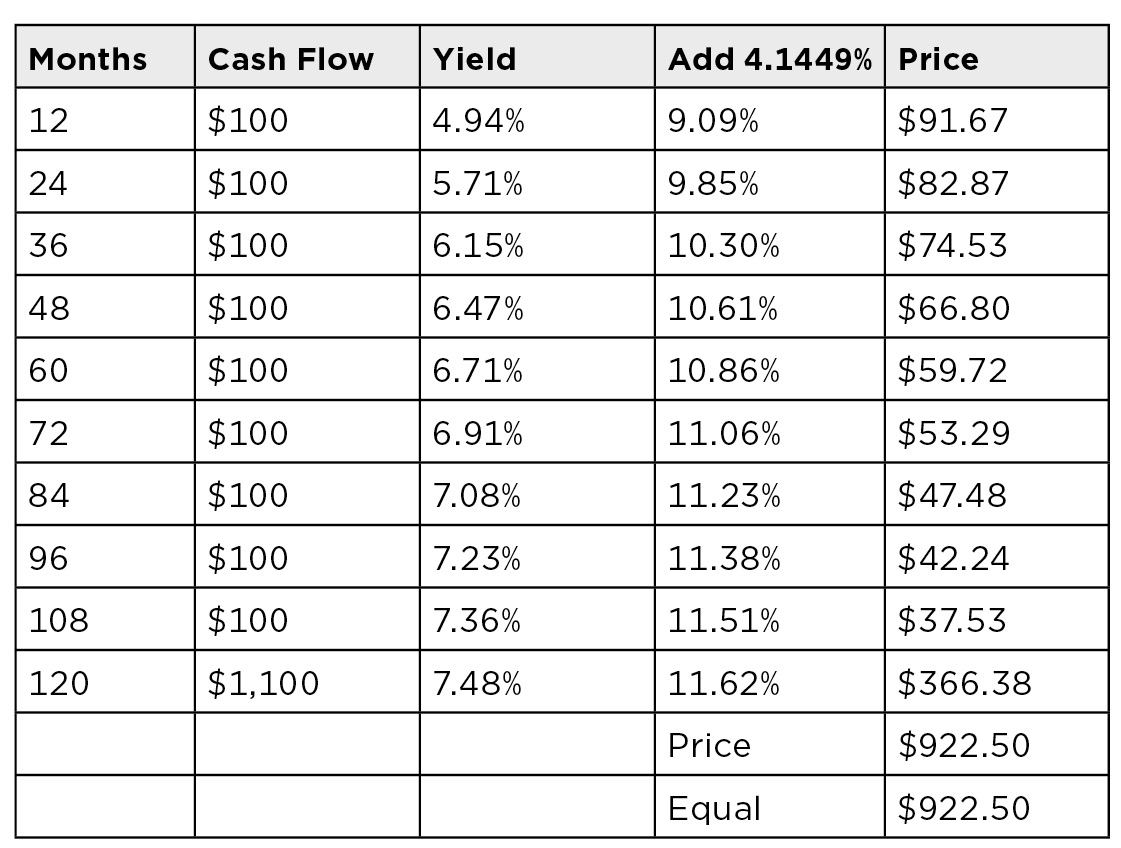
In this problem, you need to work backwards to determine the correct spread. Starting with the data listed in the table that follows, you need to determine the spread to add to the AAA yields so that the resulting present values sum to $922.50. This is an iterative (trial and error) process.

By adding 4.1449% to each zero rate, the sum of the present values is $922.50:
