CHAPTER ELEVEN
Modified Duration
In the last chapter, we discussed the concept of duration. Closely related to duration is the concept of modified duration. A bond’s modified duration is calculated using the next formula:
Modified Duration (in Periods) = MD = Duration (in Periods) / 1 + YTM (per Period)
A bond’s modified duration is a measure of the amount of interest rate risk in a bond. Specifically, a bond’s modified duration is an approximate measure of how much the value of a bond will change (in percent) if interest rates change by 1%. Figure 11.1 shows the impact on a bond of several different modified durations.
Modified Durations
|
Modified Duration |
Description |
|
6 |
When market interest rates change by 1%, the value of the bond will change by approximately 6%. |
|
12 |
When market interest rates change by 1%, the value of the bond will change by approximately 12%. |
|
29 |
When market interest rates change by 1%, the value of the bond will change by approximately 29%. |
Because a bond’s modified duration is calculated from its duration, we need to calculate a bond’s duration first. From duration we get modified duration, which is the percentage change in price due to a 1% change in market value. From the percentage change in price we can calculate the price change in dollar terms by using the formula below:
Gain or Loss = $MV × MD × –ΔIR
Where:
- $MV = Current market value of the portfolio
- MD = Modified duration of the bond or portfolio
- –ΔIR = Change in interest rates (a negative value because a rise in rates causes a decline in price)
Investors typically measure the sensitivity of their portfolios to a single basis point change in market interest rates. A basis point is defined as one one-hundredth of a percent—or 1% of 1%. In the above equation:
- A single basis point ΔIR is entered as .0001
- A ten basis point ΔIR is entered as .001
- A one hundred basis point ΔIR (a 1% ΔIR) is entered as .01
Let us look at several examples.
PROBLEM 11A
How will the value of a bond currently selling for $945 change if interest rates rise by 50 basis points and the MD of the bond is 6.34?
ANSWER:
Loss = MV × MD × –ΔIR
Loss = $945 × 6.34 × –(.0050) = –$29.96
PROBLEM 11B
How will the value of a 100 bond position currently selling at 103½ change if interest rates fall by 35 basis points and the MD of the bond is 8.99?
ANSWER:
Gain = MV × MD × –ΔIR
Gain = ($1,035 × 100) × 8.99 × –(–.0035) = $3,256.63
(Note, the negative times a negative change in rates results in a positive change in price.)
PROBLEM 11C
How will the value of a portfolio change if the portfolio has a weighted average modified duration of 5.66, a market value of $5,345,600, and the investor expects interest rates to rise by 8 basis points?
ANSWER:
Loss = MV × MD × –ΔIR
Gain = $5,345,600 × 5.66 × –(.0008) = –$24,204.88
In all of these problems, when we say that interest rates change by 1, 10, or 100 basis points, we mean that entire yield curve shifts in a parallel fashion by that number of basis points. Remember that a 20-year bond has cash flows that occur every 6 months and, therefore, its price is determined by changes in the short-, intermediate-, and long-term spot rates.
KEY RATE DURATIONS
Closely related to the concept of modified duration is the concept of key rate durations. While it is relatively easy to calculate the value of a .01 ΔIR for an entire portfolio of bonds, as noted earlier, the answer is only relevant if the yield curve is expected to shift in a parallel manner. It is often more useful to calculate how the value of a portfolio will change if certain key rates, such as the 3-month, 1-year, 3-year, 5-year, 10-year, and 30-year rates, were to each change by 1 basis point while the other rates stayed constant.
By calculating the interest rate sensitivity of the portfolio to a change in rates at specific points along the curve, it is possible to get a clearer picture of the portfolio’s risk profile. For example, the market value of all three of the portfolios described in Figure 11.2 would experience the same price change to a parallel change in rates. However, they would experience very different changes in market value in response to a nonparallel change in rates.
Interest Rate Sensitivity of Alternative Portfolios to Changes in Different Interest Rates

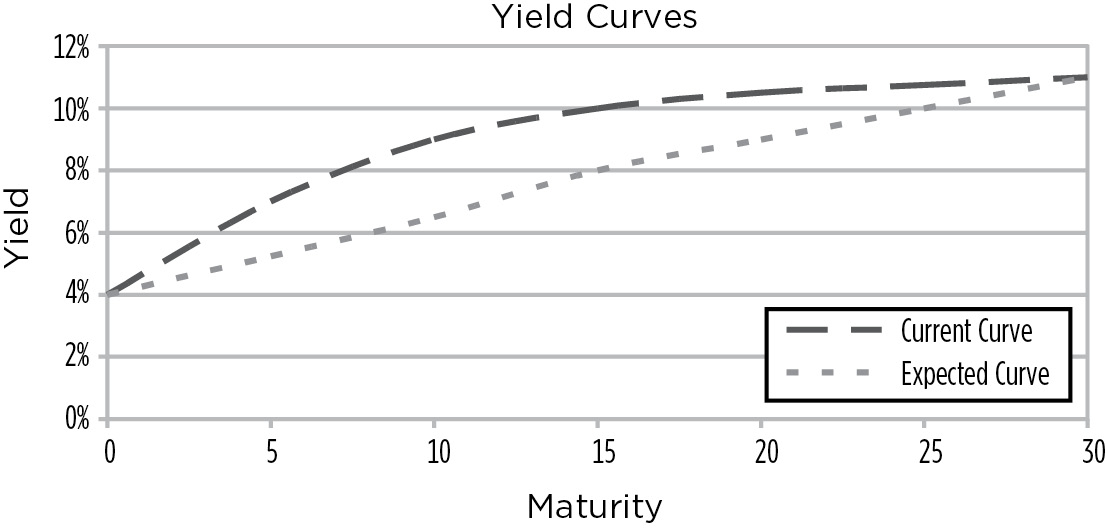
In the first portfolio, the interest rate risk is evenly distributed along the yield curve because a change in any of the key interest rates results in the same change to the value of the portfolio. In the second portfolio, the interest rate risk is concentrated at the 3- to 5-year point along the curve. Changes in short-term rates and long-term rates have little effect on the portfolio. In the third portfolio, the risk is concentrated at the extremes of the yield curve. If, for example, you expected the yield curve to shift in the manner depicted in Figure 11.3, you would have a clear preference for the second portfolio.
FIGURE 11.3
Expected Yield Curve Change