The basic tool used in climate change prediction is a computer model of Earth’s surface and the processes at work there. Scientists then vary the inputs, allowing them to see, for example, how our climate might respond to a doubling of CO2 in the atmosphere, or how the ozone hole affects climate.
Today there are around ten different global computer models that simulate the way the atmosphere behaves now, and project how it will behave in the future. The most sophisticated of them are in England, California and Germany.
The Hadley Centre for Climate Prediction and Research in England has the appearance of the modern cathedral of climate change research. The new building, completed in late 2003, soars overhead, an elegant amalgam of glass and steel designed to minimise energy use and its impact on the environment. Here more than 120 researchers strive to reduce the uncertainty of projections by producing ever more sophisticated models that mimic the real world.
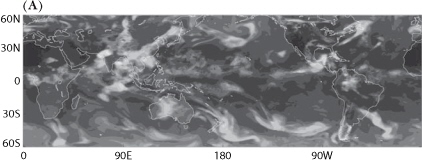
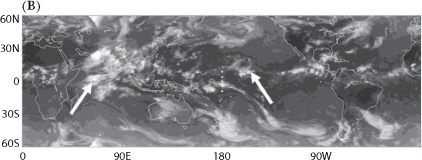
The weather for 1 July 1998. (A) is the Hadley Centre’s computer simulation of world weather for the day; (B) is the actual weather as observed by satellite.
If our planet was a uniform black sphere, the Hadley people would have an easy task, for doubling the CO2 in the atmosphere would then raise its surface temperature by 1°C. But the Earth is blue, red, green and white, and its surface is bumpy. It is the white parts—much of which is cloud— that give the researchers headaches.
Clouds cloud the issue, so to speak, because no one has yet developed a theory of cloud formation and dissipation. Clouds can both trap heat and reflect sunlight back into space. This means they can, according to circumstances, either heat or cool.
So how good is the Hadley Centre’s cloudy, computerised crystal ball at predicting Earth’s future? There are four major tests that any global circulation model must pass before its predictions can be deemed credible.
• Is its physical basis consistent with the laws of physics—the conservation of mass, heat, moisture and so on?
• Can it accurately simulate the present climate?
• Can it simulate the day-to-day evolution of the weather systems that make up our climate?
• And finally, can the model simulate what is known of past climates?
The Hadley Centre’s models pass all of these tests with a reasonable degree of accuracy, yet new discoveries in the real world are constantly forcing changes on these and other models.
For instance, we recently learned how human-induced climate change is altering sea level pressure. This is the first clear evidence of greenhouse gases directly affecting a meteorological factor other than temperature. Because the computer models hadn’t taken account of this, we were underestimating the impact of climate change on storms in the North Atlantic.
Between the 1940s and 1970s, despite increasing greenhouse gas levels in the atmosphere, Earth’s average surface temperature declined. Furthermore, early computer models predicted that, with the amount of CO2 released into the atmosphere over the century, Earth should have been warming twice as much as it actually did.
Sceptics jumped on these inconsistencies to discredit both the models and the idea that CO2 and other greenhouse gases caused temperatures to rise. Both discrepancies, it turned out, resulted from a previously overlooked factor— the very powerful influence on climate of minuscule particles that drift in the atmosphere.
Known as aerosols, they can be anything from dust ejected by volcanoes to the cocktail of deadly particles originating from the smokestacks of coal-fired power stations. Desert landscapes like those in the Sahel produce them in large quantities, and diesel engines, tyre rubber and fires are all important sources. Early computer models did not include aerosols in their calculations, in part because no one fully appreciated the extent to which human activities were increasing their number.
We now know that between one quarter and one half of all the aerosols in our atmosphere today are put there by human activity.
Aerosols can be very damaging to human health. They were the cause of significant mortality in seventeenth-century London when people were burning lots of coal. Even today aerosols generated by burning coal kill around 60,000 people annually in the US. Part of the reason is that coal acts like a sponge, soaking up mercury, uranium and other harmful minerals which are released when it is burned.
The state of South Australia is home to the world’s largest uranium mine, yet its largest single point source of radiation is not the mine but a coal-fired power plant at Port Augusta. People worry about the radiation released from nuclear tests, but in the course of a year a single coal-fired power plant in Australia’s Hunter Valley (and there are several such plants in the region) can release as much radiation into the atmosphere as the entire underground French nuclear testing program in the Pacific did. It’s no real surprise that lung cancers commonly result: in the Hunter Valley lung cancer rates are a third higher than in nearby Sydney, despite the air pollution evident in the metropolis.
As a child I remember seeing No Spitting signs on the railway tunnel walls of my home city of Melbourne, and hearing stories of spittoons being used in my grandfather’s day. When I travelled to China as an adult, and saw the inhabitants of grossly polluted cities such as Hefei hacking up foul congestion from their lungs, I realised that my forebears did not necessarily have worse hygiene habits than we do. They simply battled with a filthy atmosphere created by burning coal.
Scientists now think that the temperature decline of the 1940s to 1970s was caused by aerosols. One of them was sulphur dioxide which is released when low quality coal is burned. By the 1960s lakes and forests at high latitude in the Northern Hemisphere were dying. The trees were losing their needles, while the lakes were becoming crystal clear and emptied of life.
The cause was acid rain from the sulphur dioxide emissions of coal-burning power stations. Laws were passed to enforce the use of ‘scrubbers’ on coal-burning power plants in the industrialised world. These have been used since the 1970s and have dramatically reduced sulphur dioxide emissions.
There was, however, an unintended consequence. Aerosols of sulphate are most effective at reflecting sunlight back into space, and thus act powerfully to cool the planet. Because most aerosols last just a few weeks in the atmosphere (with sulphur dioxide degrading at the rate of 1–2 per cent per hour at normal humidity), the effect of installing scrubbers was immediate.
As the air cleared, global temperatures rose, driven by CO2 released from those very same power stations. The experience was the perfect example of how everything on our planet is connected with everything else.
The 1991 eruption of Mt Pinatubo in the Philippines provided an exceptional test of the new computer models’ capacity to predict the influence of aerosols. It ejected 20 million tonnes of sulphur dioxide into the atmosphere, and a group led by NASA scientist James Hansen forecast that the result would be around 0.3°C of global cooling—and this figure is exactly what was seen in the real world.
Among the most important and best supported of these models’ predictions are that the Poles will warm more rapidly than the rest of the Earth; temperatures over the land will rise more rapidly than the global average; there will be more rain; and extreme weather events will increase in both frequency and intensity.
Changes will also be evident in the rhythms of the day, and nights will be warmer relative to days, for night is when Earth loses heat through the atmosphere to space. There will also be a trend towards the development of semi-permanent El Niño-like conditions.
We must now turn to the key uncertainty that remains in all models: will a doubling of CO2, from pre-industrial levels of 280 to 560 parts per million, lead to a 2°C or 5°C increase in warming? After almost thirty years of hard work and profound technological advances we are still not sure about the answer to this question.
But many people would argue that we already know enough: even 2°C of warming would be catastrophic for large segments of humanity.
The largest study of climate change so far undertaken was published in 2005 by a team led from Oxford University. It was conducted by using the downtime on more than 90,000 personal computers, and it focused on the temperature implications of doubling CO2 in the atmosphere. The average result was that this would lead to 3.4°C of warming. But there was an astonishingly wide range of possibilities— from between 1.9 and 11.2°C of warming, the higher end of which had not been predicted earlier.
As I read these results, I thought about an anomaly that had long niggled at me. At the end of the last ice age CO2 levels increased by 100 parts per million, and Earth’s average surface temperature rose by 5°C. Yet in most computer analyses, an increase in CO2 almost three times as large is predicted to result in a temperature rise of only 3°C.
Of course, Milankovich cycles and extensive ice caps played a role, but scientists working on aerosols now think that they might have part of the answer. Direct measurement of the strength of sunlight at ground level, and worldwide records of evaporation rates (which are influenced primarily by sunlight) indicate that the amount of sunlight reaching the Earth’s surface has declined significantly (up to 22 per cent in some areas) over the last three decades. The aerosols are blocking the sunlight.
This phenomenon is called global dimming, and there are two ways that it operates: aerosols such as soot increase the reflectivity of clouds, and the contrails of vapour left by jet aircraft create a persistent cloud cover. Soot particles change the reflective properties of clouds by encouraging many tiny water droplets rather than fewer, larger ones. These tiny water droplets allow clouds to reflect far more sunlight back into space than do larger drops.
The story with contrails is different. In 2001, in the three days following September 11 when terrorists destroyed the World Trade Center in New York, the entire US jet fleet was grounded. Over this time climatologists noted an unprecedented increase in daytime temperatures relative to night-time temperatures. This resulted from the additional sunlight reaching the ground in the absence of contrails.
If 100 parts per million of CO2 really can raise surface temperature by 5°C, and if aerosols and contrails have counterbalanced this so that we have experienced only 0.63°C of warming, then their influence on climate must be enormously powerful. It is as if two great forces—both unleashed from the world’s smokestacks—are tugging the climate in opposite directions, only CO2 is slightly more powerful.
This leaves us with a grave problem, for particle pollution lasts only days or weeks, while CO2 lasts a century.
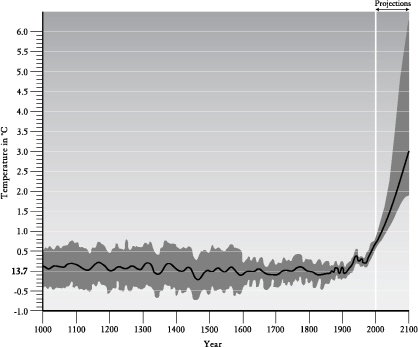
This graph, known as the ‘hockey stick’, shows trends in the average surface temperature of Earth from AD 1000 to 2100. Prior to 1900 this was 13.7°C. The grey area conveys uncertainty, which is reduced around 1850 when the thermometer grid was established. The projections on the right give a range of probable temperature increases to 2100.
If our understanding of global dimming is correct, then we only have one option. We must start to learn how to extract CO2 from the atmosphere, and at the moment we don’t know how to do that at all effectively.
One day we may be able to create artificial photosynthesis which would capture carbon out of the air but this belongs to a future we can at present only imagine.
One of the most fundamental human responses to any change is to ask what caused it. But Earth’s climate system is so riddled with positive feedback loops that our usual concepts of cause and effect no longer hold. Consider that famous example from chaos theory, of the flutter of a butterfly’s wing in the Amazon causing a cyclone in the Caribbean. To say simply that one thing has caused something else is an unhelpful way of thinking. Instead what we have are seemingly insignificant initial occurrences—such as an increase of atmospheric CO2—that lead to runaway change.
A number of climate groups have produced computer-based projections for various regions of Earth and for time scales as short as a few decades. Here are three examples.
The Hadley Centre made predictions for the climate of the United Kingdom from the 2050s to the 2080s. They discovered that by 2050 human influences on the climate will have surpassed all natural influences.
They predict that snow cover will decrease by up to 80 per cent near the British coast, and up to 60 per cent in the Scottish highlands. Winter rainfall is predicted to increase by up to 35 per cent, with more intense rainfall events, while summer rainfall will decrease, and one summer out of three will be ‘very dry’. An event akin to the severe summer of 1995 (which had seventeen days over 25°C and four days over 30°C) may recur twice per decade, while the great majority of years will be warmer than the record-breaking 1999. In 2006 the southeast of England had lapsed back into drought.
The changes felt over Europe will be more extreme than the increase in the global average. Indeed, a global rise in surface temperature of just 2°C would bring a temperature rise to all of Europe, Asia and the Americas of 4.5 degrees. For Britain, this means a more Mediterranean-like climate and, as some newspapers put it, ‘the end of the English garden’. More important are the challenges it throws up for water security, flood planning and human health.
In 2003 and 2004 two further regional studies focused on climate impacts for California. They argued that global warming would bring much hotter summers to the state, as well as a depleted snowpack, threatening both water supplies and health. By the end of the century, heatwaves in Los Angeles would be two to seven times as deadly as today, and almost all of California’s alpine forests would be lost. Already pikas (alpine relatives of the rabbit) are becoming extinct on isolated mountains throughout the west. Seven populations of around fifty have vanished in recent decades.
The third example focuses on the state of New South Wales, with predictions made by Australia’s leading science research body, the CSIRO. It forecasts, in the decades to come, temperature increases across the state of between 0.2 and 2.1°C, while the number of cold spells and frosts will decrease. The number of days above 40°C will increase, as may winter and spring droughts, extreme rainfall events and wind speeds.
The gas is already in the air and right now we have no way of getting it out. Whatever the accuracy of these reports, one thing is certain: the course of climate change is set for at least the next few decades.