The tfruns package is a set of utilities for managing different training runs for deep learning models. It can be used as a framework to build multiple deep learning models using different hyper-parameters. It can track the hyper-parameters, metrics, output, and source code for every training run and allows you to compare the best models so that you can see the differences between the training runs. This makes hyper-parameter tuning much easier and can be used with any tfestimator model or Keras model. For more details, go to https://tensorflow.rstudio.com/tools/tfruns/articles/overview.html.
The following code is in the Chapter8/hyperparams.R folder and also uses the script we used in the TensorFlow estimators section (Chapter8/tf_estimators.R):
library(tfruns)
# FLAGS <- flags(
# flag_numeric("layer1", 256),
# flag_numeric("layer2", 128),
# flag_numeric("layer3", 64),
# flag_numeric("layer4", 32),
# flag_numeric("dropout", 0.2),
# flag_string("activ","relu")
# )

training_run('tf_estimators.R')
training_run('tf_estimators.R', flags = list(layer1=128,layer2=64,layer3=32,layer4=16))
training_run('tf_estimators.R', flags = list(dropout=0.1,activ="tanh"))
This will run the Chapter8/tf_estimators.R script with different hyper-parameters. The first time, we don't change any hyper-parameters, so it uses the defaults included in Chapter8/tf_estimators.R. Each time a new model is trained using the classification script, it is called a training run, and the details of the training run is stored in the runs folder in the current working directory.
For each training run, a new website will pop up with details on the run, as shown in the following screenshot:

We can see the progress of the training in the plots, along with the details of when the training run occurred and the evaluation metrics. We can also see in the bottom right that the flags (that is, hyper-parameters) used in the training run are also shown. There is another tab for the R code output, which includes all of the output from the R code in the inner file (Chapter8/tf_estimators.R), including plots.
Once all of the training runs are complete, the following code shows a summary of all the training runs:
ls_runs(order=eval_accuracy)
ls_runs(order=eval_accuracy)[,1:5]
Data frame: 3 x 5
                    run_dir eval_accuracy eval_accuracy_baseline eval_auc eval_auc_precision_recall
3 runs/2018-08-02T19-50-17Z        0.7746                 0.6032   0.8431                    0.8874
2 runs/2018-08-02T19-52-04Z        0.7724                 0.6032   0.8425                    0.8873
1 runs/2018-08-02T19-53-39Z        0.7711                 0.6032   0.8360                    0.8878
Here, we have ordered the results by the column eval_accuracy. If you close the window showing the summary for the training run, you can display it again by calling the view_run function and passing in the folder name. For example, to show the summary for the best training run, use the following code:
dir1 <- ls_runs(order=eval_accuracy)[1,1]
view_run(dir1)
Finally, you can also compare two runs. Here, we are comparing the two best models:
dir1 <- ls_runs(order=eval_accuracy)[1,1]
dir2 <- ls_runs(order=eval_accuracy)[2,1]
compare_runs(runs=c(dir1,dir2))
This brings up a page similar to the following:
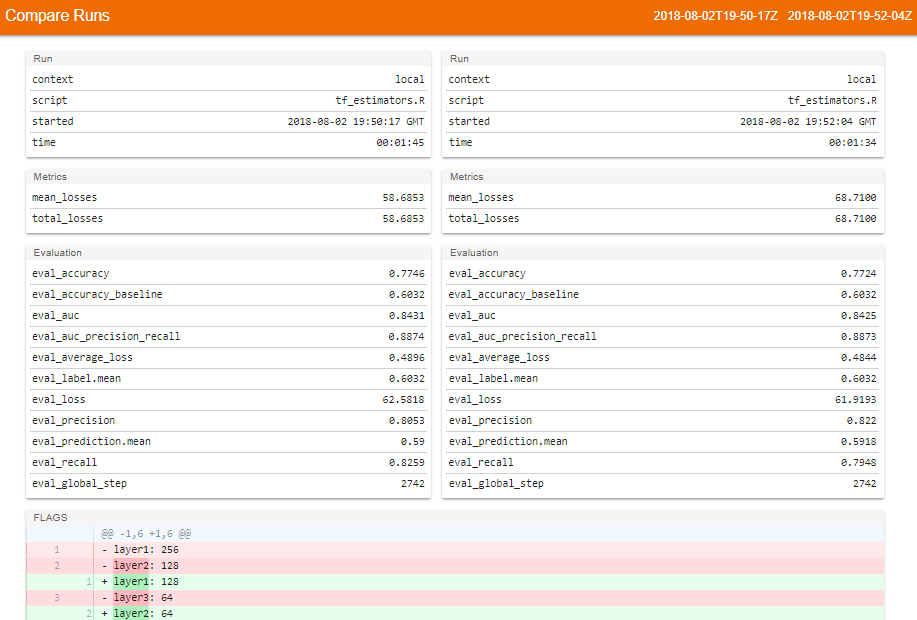
This page shows the evaluation metrics for both training runs and also displays the hyper-parameters that were used. As we can see, this makes managing the process of tuning deep learning models much easier. This approach to hyper-parameter tuning has automatic logging, traceability, and it is easy to compare different sets of hyper-parameters. You can see the metrics and the different hyper-parameters used for the training runs. There's no more comparing configuration files to try and match hyper-parameter settings to output logs! In comparison, the code I wrote for hyper-parameter selection for the NLP example in Chapter 7, Natural Language Processing Using Deep Learning, seems crude in comparison