Chapter 6
Thermal Transitions in Polymers
6.1 Introduction
The reader should be familiar with thermal transitions, particularly the melting (or freezing) and the boiling points of pure substances. Polymers are a bit more complex; their size leads to the definition of a new term, the glass transition temperature, which divides glassy from rubbery behavior. The polydispersity of polymeric samples also leads to melting point ranges. Alternately, the boiling point is largely unimportant for polymers, since they degrade well before macromolecules vaporize. This chapter focuses on some of the unique thermal behavior observed in polymers and explains why polymers have a thermal history that is crucial in determining physical properties.
6.2 The Glass Transition
It has long been known that amorphous polymers can exhibit two distinctly different types of mechanical behavior. Some, such as poly(methyl methacrylate) (PMMA), trademarked as Lucite® or Plexiglas®, and polystyrene (PS), are hard, rigid, glassy plastics at room temperature. Other polymers, for example, polybutadiene, poly(ethyl acrylate), and polyisoprene, are soft, flexible rubbery materials. If, however, PS and PMMA are heated to around 125 °C, they exhibit typical rubbery properties; when a rubber ball is cooled in liquid nitrogen, it becomes rigid and glassy and shatters when an attempt is made to bounce it. So, there is some temperature, or narrow range of temperatures, below which an amorphous polymer is in a glassy state and above which it is rubbery. This temperature is known as the glass transition temperature, Tg. The glass transition temperature is a property of the polymer, and whether the polymer has glassy or rubbery properties depends on whether its application temperature is above or below its glass transition temperature. Note that the Tg is a property of the amorphous regions of polymers; however, since no polymer is 100% crystalline, the Tg is important for all polymeric materials.
6.3 Molecular Motions in an Amorphous Polymer
To understand the molecular basis for the glass transition, the various molecular motions occurring in an amorphous polymer mass may be broken into four categories.
Motions 1–4 above are arranged in order of decreasing activation energy (as well as decreasing number of atoms involved in the motion), that is, smaller amounts of thermal energy (kT1) are required to produce them. The glass transition temperature is thought to be that temperature at which motions 1 and 2 are pretty much “frozen out,” and there is only sufficient energy available for motions 3 and 4. Of course, not all molecules possess the same energies at a given temperature. The molecular energies follow a Boltzmann distribution, and even below Tg, there will be occasional type 2 and even type 1 motions, which can manifest themselves over extremely long periods of time.
6.4 Determination of Tg
How is the glass transition temperature studied? A common method is to observe the variation of some thermodynamic property with T, for example, the specific volume, as shown in Figure 6.1. As temperature rises, the polymer expands, with a change to a higher slope in the v versus T plot above the glass transition temperature.
Figure 6.1 Specific volume (v) versus temperature for poly(vinyl acetate) [1].
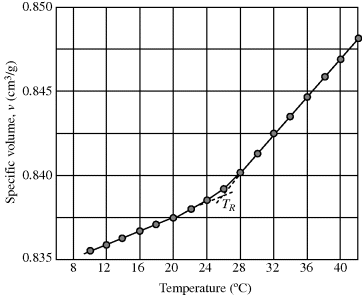
The value of Tg determined in this fashion will vary somewhat with the rate of cooling or heating. This reflects the fact that long, entangled polymer chains cannot respond instantaneously to changes in temperature and illustrates the difficulty in making thermodynamic measurements on polymers. It often takes an extremely long time to reach equilibrium, if indeed it is ever reached, and it is difficult to be sure if and when it is reached. Strictly speaking, the glass transition temperature should be defined in terms of equilibrium properties or at least those measured with very low rates of temperature changes. Also, a sharp “break” in the property is never observed, but Tg can always be established within a couple of degrees by extrapolation of the linear regions (as shown in Figure 6.1). Other properties such as refractive index may also be used to establish Tg.
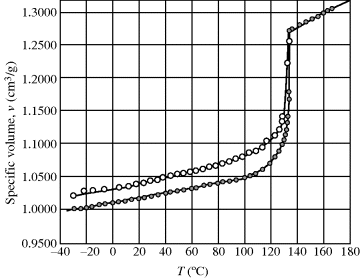
In contrast to a change in slope at the glass transition, a thermodynamic property such as specific volume exhibits a discontinuity with temperature at the crystalline melting point in polymers as in other materials (Figure 6.2). The glass transition is therefore known as a second-order thermodynamic transition (where v versus T is continuous and dv/dT versus T is discontinuous) in contrast to a first-order transition such as the melting point (where v versus T is discontinuous).
Figure 6.2 Specific volume–temperature relations for linear polyethylene (Marlex-50).  : Specimen slowly cooled from melt to room temperature prior to fusion.
  Specimen crystallized at 130 °C for 40 days, then cooled to room temperature prior to fusion [2].
Tg characterizes the amorphous phase. Since all polymers have at least some amorphous material (they cannot be 100% crystalline), they all have a Tg, but not all polymers have a crystalline melting point, they cannot have if they do not crystallize (and many polymers will degrade before they melt).
Transitions in polymers are rapidly and conveniently studied using differential scanning calorimetry (DSC) [3]. Small samples (~10 mg) of the polymer and an inert reference substance (one that undergoes no transitions in the temperature range of interest) are mounted in a block with a heater for each and thermocouples to monitor temperatures. The thermodynamic property monitored here is the enthalpy. The power supplied to each heater is monitored and adjusted to keep the sample and the reference at the same temperature as both are heated at a programmed rate (typically 5–20 °C/min). At Tg, the heat capacity of the sample suddenly increases, requiring more power (relative to the reference) to maintain the same temperatures. This differential heat flow to the sample (endothermic) causes a drop in the DSC curve (Figure 6.3). At Tm, the sample crystals want to melt at constant temperature, so a sudden input of large amounts of heat is required to keep the sample temperature even with the reference temperature. This results in the characteristic endothermic melting peak. Crystallization, in which large amounts of heat are given off at constant temperature, gives rise to a similar but exothermic peak (although this peak is missing for many polymers that either do not crystallize appreciably or are already crystalline before heating). By measuring the net energy flow to or from the sample, heat capacities and heats of fusion can be determined. Decomposition (endothermic) and oxidation (exothermic) reactions can also be conveniently studied (as can exothermic polymerization reactions, as discussed later).
Figure 6.3 Schematic DSC curve. This is what would be observed on heating a material from state 2 (Example 6.8, Figure 6.5) to state 1.
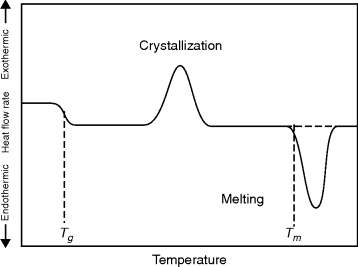
In Figure 6.3, the crystallization and melting peaks are shown as occurring over a temperature range, and the rates of heating (or cooling) can broaden (for higher dT/dt rates) or narrow (for slow heating or cooling) these peaks. However, even with a very slow temperature ramp, the melting transition will occur over a range of temperatures rather than being well defined at a single temperature (e.g., compared with a pure low molecular weight substance, say ice, polymer samples are polydisperse, having a range of crystallite sizes and having entanglements and complex secondary interactions that cause broad melting peaks).
A DSC is programmed to heat the sample at a constant rate. The higher the rate, the quicker the measurement, a practically desirable result. Unfortunately, because polymer chains cannot respond instantaneously to the changing temperature, the measurement is further from equilibrium. The dependence of the measured Tg or Tm on heating rate is at least partially responsible for the range of values observed in the literature. To approach the true equilibrium values, very low heating rates should be used or, better yet, several heating rates should be used and the results extrapolate back to zero heating rate. Because of the time and effort involved, this is rarely done. Newer DSC models have a temperature modulation program that allows fine-tuning of these measurements to more accurately measure Tg and Tm. Dynamic mechanical measurements (see Chapter 16) can also provide useful information on thermal transitions.
6.5 Factors that Influence Tg [4]
In general, the glass transition temperature depends on five factors.

Figure 6.4 Rotation about a bond in a polymer chain backbone, viewed along the bond. The dotted substituents are on the rear carbon atom.
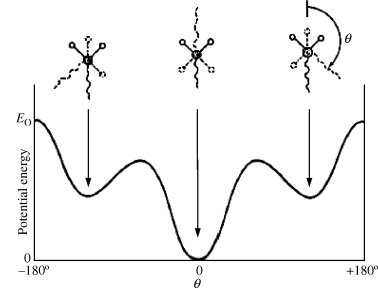
Table 6.1 shows how Tg increases with Eo, the potential energy, for a series of polymers with approximately the same δ. Note how the ether oxygen “swivels” in the silicone chain permitting very free rotation.
Table 6.1 Effect of Potential Energy on Tg for Selected Polymers [4]


Chains with parallel bonds in the backbone (ladder-type polymers), for example, polyimides (Example 2.4R), and those with highly aromatic backbones, such as aramids (see Chapter 4.8) have extremely stiff chains and, therefore, tend to have high Tg values. This makes these polymers mechanically useful at elevated temperatures but also very difficult to process.
(6.1) 
where C is a constant for the particular polymer, and Tg∞ is the asymptotic value of the glass transition temperature for infinite chain length. This reflects the increased ease of motion for shorter chains. The decrease in Tg with x is only noticeable at relatively low chain lengths. For most commercial polymers, x is high enough so that Tg ≈ Tg∞.
6.6 The Effect of Copolymerization on Tg
The glass transition temperatures for random copolymers vary monotonically with composition between those of the homopolymers. They can be approximated fairly well from knowledge of the Tg values of the homopolymers, Tg1 and Tg2, with the empirical relation:
where the w's are weight fractions of the monomers in the copolymer. This relation forms the basis for a method of estimating the Tg values of highly crystalline polymers, where the properties of the small amount of amorphous material are masked by the majority of crystalline material present. If a series of random copolymers can be produced in which the randomness prevents crystallization over a certain composition range, then Equation (6.2) can be used to extrapolate to w1 = 1 or w2 = 1, giving the Tg values of the homopolymers. This method is open to question because it assumes that the presence of major amounts of crystallinity does not restrict the molecular response in the amorphous regions. In fact, the Tg values of highly crystalline polymers (polyethylene, in particular) are still open to debate.
6.7 The Thermodynamics of Melting
The crystalline melting point Tm in polymers is a phase change similar to that observed in low molecular weight organic compounds, metals, and ceramics.
The Gibbs free energy of melting is given by
(6.3) 
At the equilibrium crystalline melting point, Tm, ΔG = 0, therefore
Now ΔHm is the energy needed to overcome the crystalline bonding forces at constant T and P, and is essentially independent of chain length of high polymers. For a given mass or volume of polymer, however, the shorter the chains are, the more randomized they become upon melting, giving a higher change in entropy on mixing, ΔSm. (For a more detailed description of this in connection with solutions, see Chapter 7.) Thus, the crystalline melting point decreases with decreasing chain length and in a polydisperse polymer, the distribution of chain lengths give a distribution of melting points.
Equation (6.4) also indicates that chains that are strongly bound in the crystal lattice, that is, have a high ΔHm, will have a high Tm, as expected. Also, the stiffer and less mobile chains, those that can randomize less upon melting and therefore have low ΔSm, will tend to have higher Tm values.

Table 6.2 illustrates the variation in Tm and some other properties with n for some commercial members of the nylon series.
Table 6.2 Variation of Properties with n for Nylon n's.


The crystalline melting point also increases a bit with the degree of crystallinity of a polymer. For example, low-density polyethylene (approximately 50% crystalline) has a Tm of about 115 °C, whereas high-density polyethylene (approximately 80% crystalline) melts at about 135 °C. This can be explained by treating the amorphous material as an impurity. It is well known that introducting an impurity lowers the melting point of common materials. In a similar fashion, greater amounts of noncrystalline “impurities” lower the crystalline melting point of a polymer.
6.8 The Metastable Amorphous State
Since polymer chains are largely immobilized below Tg, if they are cooled rapidly through Tm to below Tg, it is sometimes possible to obtain a metastable amorphous state in polymers that would be crystalline at equilibrium. This rapid cooling effectively locks the chains in a random, amorphous state. As long as the material is held below Tg, this metastable amorphous state persists indefinitely. When annealed above Tg (and below Tm), the polymer crystallizes, as the chains gain the mobility necessary to pack into a lattice. This behavior leads to classifying polymers as materials that have a thermal history, indicating that the rate of cooling affects crystallinity (and other properties).
Poly(ethylene terephthalate), from Example 2.4D, because of its bulky chain structure, crystallizes sluggishly and is therefore relatively easy to obtain in the metastable amorphous state. When desired, crystallinity can be promoted by slow cooling from the molten state, annealing between Tg and Tm, or by the addition of nucleating agents. PET has important commercial applications both in the metastable amorphous state (soda bottles) and in the crystalline state (textile fibers, microwaveable food trays, molding resin). On the other hand, no one has yet succeeded in producing an amorphous polyethylene, with its much more flexible chains, although the degree of crystallinity can be reduced substantially by rapid cooling (Figure 6.2). Interestingly, metallurgists can also produce amorphous metals by rapidly cooling certain alloys.
Figure 6.5 Specific volume–temperature relation for crystallizable polymers. Numbers apply to Example 6.8.
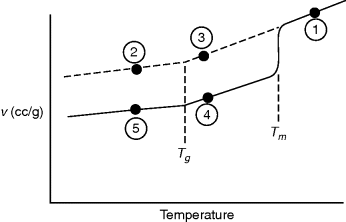
Polymer blends, which are mixtures of two or more different homopolymers, are also commonly used in commercial materials. Except in the rare case where interpolymer crystallites can form, blends exhibit multiple Tg's and Tm's, one for each component of the blend.
6.9 The Influence of Copolymerization on Thermal Properties
Compared with polymer blends, copolymers have only one Tg and one Tm. The influence of random copolymerization on Tm and Tg is interesting and technologically important. Occasionally, if two repeating units are similar enough sterically to fit into the same crystal lattice, random copolymerization will result in copolymers whose crystalline melting points vary linearly with composition between those of the pure homopolymers. Much more common, however, is the case where the homopolymers form different crystal lattices because of steric differences. The random incorporation of minor amounts of repeating unit B with A will disrupt the A lattice, lowering Tm beneath that of homopolymer A, and vice versa. In an intermediate composition range, the disruption will be so great that no crystallites can form and the copolymers will be completely amorphous. A phase diagram for such a random copolymer system is shown in Figure 6.6.
Figure 6.6 Phase diagram for a random copolymer system.
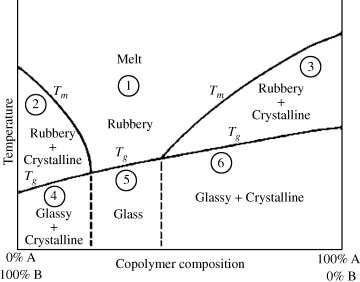
The physical properties of random copolymers are determined from their composition and the temperature, as can be found in a diagram such as the one qualitatively shown in Figure 6.6. In region 1, the polymer is a homogeneous, amorphous, and, if pure, transparent material. The distinction between melt and rubbery behavior is not sharp; at higher temperatures, the material flows more easily and becomes less elastic in character (assuming that the polymer does not reach degradation temperatures). It should be kept in mind, though, that the viscosities of polymer melts, even well above Tg or Tm, are far greater than those encountered in nonpolymeric materials.
A copolymer in region 5 is a typical amorphous, glassy polymer: hard, rigid, and usually brittle. Again, if the polymer is pure, it will be perfectly transparent. PMMA (Lucite, Plexiglas) and PS are familiar examples of homopolymers with these properties.
Copolymers in regions 2 and 3 consist of rigid crystallites dispersed in a relatively soft, rubbery, amorphous matrix. Since the refractive indices of the crystalline and amorphous phases are in general different, materials in these regions will be translucent to opaque, depending on the size of the crystallites, the degree of crystallinity, and the thickness of the sample. Since the crystallites restrict chain mobility, the materials are not elastic, but the rubbery matrix confers flexibility and toughness. The stiffness depends largely on the degree of crystallinity; the more rigid crystalline phase present, the stiffer the polymer. Polyethylene (e.g., flexible squeeze bottles or rigid bleach bottles) is a good example of a homopolymer with these properties, typical of a polymer that is between its Tg and Tm at room temperature.
Copolymers in regions 4 and 6 consist of crystallites in an amorphous, glassy matrix. Since both phases are rigid, the materials are hard, stiff, and rigid. Again, the two phases impart opacity. Nylon 6/6 and nylon 6 are examples of homopolymers in a region below both Tg and Tm at room temperature.
6.10 Effect of Additives on Thermal Properties
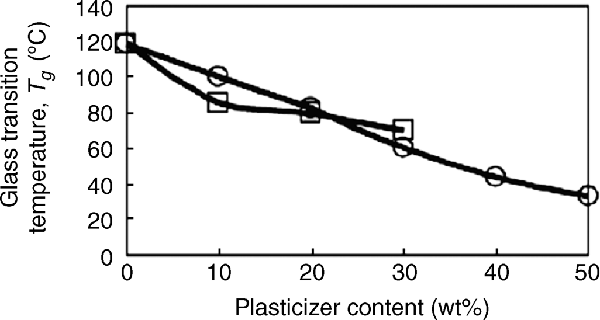
A number of different compounds are used as polymer additives to tailor the properties of materials for their end-use. As discussed in detail in Chapter 18, these additives include dyes, fillers, plasticizers, and a variety of other compounds. Because each of these additives gets between polymer chains (at least to some extent), they reduce the number of polymer–polymer interactions and cause an increase in chain mobility (when compared to the pure polymer at the same temperature). This causes a drop in Tg (which is exactly what a plasticizer is designed to do, Figure 6.7). This decrease in Tg depends on the thermodynamic compatibility of the additive with the polymer. For some fillers, this may be quite low, causing little change in Tg, but for chemical additives that interact with the polymer, Tg can be reduced significantly. The thermodynamics of polymer solutions and polymer additives are discussed in detail in the next chapter. The melting point of a polymer with an additive will not be influenced greatly, but the degree of crystallinity (and crystal sizes) will drop markedly, as the additive will interfere in the formation of regular crystals.
Figure 6.7 Effect of adding dioctyl phthalate (DOP) (a plasticizer), squares, or imidazolium ionic liquid additives (bmimPF6 or hmimPF6), circles, to PMMA on Tg [5]. Reproduced by permission of the Royal Society of Chemistry.
6.11 General Observations About Tg AND Tm
Some other useful observations regarding Tg and Tm are that for polymers with a symmetrical repeating unit, such as polyethylene –(CH2–CH2)– and poly(vinylidene chloride), or Saran®, –(CH2–CCl2)–, Tg/Tm ≈ 1/2 (for absolute T's); for unsymmetrical repeating units, such as polypropylene –(CH2–CHCH3)– and polychlorotrifluoroethylene –(CF2–CFCl)–, Tg/Tm ≈ 2/3. These are just rough estimates, but in all cases Tg < Tm.
6.12 Effects of Crosslinking
To this point, the discussion has centered on non-crosslinked (and generally linear, rather than branched) polymers. Light crosslinking, as in rubber bands, will not alter things appreciably. However, higher degrees of crosslinking, if formed in the amorphous molten state or in the solution, as is usually the case, will hinder the alignment of chains necessary to form a crystal lattice and will thus reduce or prevent crystallization. Similarly, crosslinking restricts chain mobility and causes an increase in the apparent Tg. When the crosslinks are more frequent than every 40–50 main chain atoms, the type 2 motions necessary to reach the rubbery state can never be achieved and the polymer will degrade before reaching Tg.
6.13 Thermal Degradation of Polymers
As mentioned earlier in this chapter, several polymers start to degrade before reaching a melting point. All polymers eventually degrade given enough heating. The degradation process is sort of a depolymerization, except the bonds break randomly along the backbone, resulting in a smaller  and
and  (and higher PI). The reductions in the molecular weight also degrade the mechanical properties of the polymers. In many applications, additives are used to stabilize polymers that may be used at high temperatures. However, anyone who has microwaved a plastic bowl to the point of deformation understands that polymers can degrade appreciably even at moderate temperatures, especially when compared to glass or metal materials.
PVC is an example of a polymer that self-catalyzes its thermal degradation. Beginning at temperature around 160 °C, HCl is formed as a byproduct of thermal degradation, and, even worse, the acid catalyzes further degradation of PVC. This is why PVC is not used for high-temperature applications, and even for moderate temperatures, a thermal stabilizer is normally added.
Thermal degradation is one of the primary challenges in effective polymer recycling. Although thermoplastics can be melted and reused, uneven temperature distributions (or the heat evolved while grinding polymers) can cause some degree of thermal degradation, reducing  and
and  . This is partly why recycled polymers are most often used in applications where high mechanical strength is less important, such as park benches and grocery bags.
6.14 Other Thermal Transitions
Thermal transitions other than Tg and Tm are sometimes observed in polymers. Some polymers possess more than one crystal form, so there will be an equilibrium temperature of transition from one to another. Similarly, second-order transitions below Tg occur in some materials (Tg is then termed the α transition, the next lower is the β transition, and so forth). These are attributed to motions of groups of atoms smaller than those necessary to produce Tg (type 3 motions, Section 6.2). These transitions may strongly influence properties. For example, tough amorphous plastics (e.g., polycarbonate) have such a transition well below room temperature, while brittle amorphous plastics (e.g., PS and PMMA) do not.
The existence of another transition above Tg has been claimed, but is still the subject of considerable controversy. This Tll (liquid–liquid transition) presumably represents the boundary between type 1 and type 2 motions. It has been observed in a number of systems [6–8], and it has been suggested that Tll ≈ 1.2 Tg (in absolute temperature) for all polymers [6]. For each article that reports Tll, however, it seems that there is another that claims that Tll results from impurities (traces of solvent or unreacted monomer) in the sample or is an artifact of the experimental or data-analysis technique [9, 10].
Problems
Notes
1. kT is the product of the Boltzmann constant and absolute temperature. It is related to energy on a molecular level and is discussed in more detail in physical chemistry.
1. Meares, P., Trans. Faraday Soc. 53, 31 (1957).
2. Mandelkern, L., Rubber Chem. Technol. 32, 1392 (1959).
3. Wunderlich, B., Thermal Analysis, Academic, San Diego, CA, 1990.
4. Tobolsky, A.B., Properties and Structure of Polymers, Wiley, New York, 1960, Chapter 2.
5. Scott, M.P., M. Rahman, and C.S. Brazel, Eur. Polym. J. 39, 1947 (2003).
6. Kumar, P.L., et al., Org. Coat. Plast. Chem. 44, 396 (1981).
7. Ibar, J.P., Polym. Prepr. 22(2), 405 (1981).
8. Boyer, R.F., Macromolecules 15(6), 1498 (1982).
9. Plazek, D.J., et al., J. Polym. Sci., Polym. Phys. Ed. 20(9), 1533, 1551 1565, 1575 (1982).
10. Loomis, L.D. and P. Zollar, J. Polym. Sci., Polym. Phys. Ed. 21(2), 241 (1983).

