
Khandoker Mahmudur Rahman
Dream is not the thing you see in sleep but is that thing that doesn’t let you sleep.
Dr. A. P. J. Abdul Kalam (Former President of the Republic of India)
Strategy is your game plan. It means “How” you want to play to win. Your way of playing is your strategy. On the other hand, winning a game is at the center of your focus. This is what we call the objective, the “What” part of your game. While the term objective is quite clear for most organizations, strategy is not. Some play very aggressive to win, others play defensive to minimize loss and maximize gain at an opportune moment. Still others follow a combination of strategies at different points of time to suit their needs. While aggressive strategy does not necessarily guarantee that you will win, defensive strategy does not also necessarily mean that you will lose. The irony of strategic planners is that, nobody remembers how you did it, but everybody remembers the end result. Fulfilling the objective is what is rewarded by stakeholders. That is why, no matter how wonderful and creative your strategy might be in theory, if it does not work in reality, all your sleepless nights of toil may go in vain. Here is a very important lesson for managers: a strategy is as good as its outcome. Stakeholders will not judge you based on strategic models and all the pro-forma numbers on papers, but they will applaud your strategy when it works. This chapter is designed to help you define and develop your strategic marketing plan that will work.
Strategic planning refers to a well-articulated process of formulating, implementing, and controlling a long-run course of action aimed at achieving clearly defined objectives. It consists of understanding the guiding philosophy of the organization, vision, mission, long-run objective, strategic course of action, implementation of the game plan, and control of business performance to keep the results on track.1 Therefore, strategic planning is not confined to marketing only; it applies to the entire business. A strategic business plan consists of plans for marketing, human resources, finance, production, and operations that unify and focus to achieve long-run business objectives.
Notwithstanding the inevitable interrelationship and importance of all the functional departments, which department should start the process of strategic planning then? Strictly, from a “sequential” point of view, production, human resource, and finance cannot focus on their worksheets unless estimated sales figures are in. These figures are the outcome of the homework done by the marketing department. Marketing, being the front-end (customer end) department, has to play a crucial role via marketing strategy.2 The tales behind the figures are to be told by the marketing department, based on which the rest of the departments will align, formulate, implement, and control their strategic plans to support market success in the long run. This is where the link between the strategic business plan and the strategic marketing plan is created. The rest of the chapter will deal with how to create a workable strategic marketing plan.
The six basic ingredients of a strategic marketing plan consist of:
1. Knowing your market (i.e., customers)
2. Knowing your competitive environment
3. Knowing yourself (resources, capabilities, limitations)
4. Crafting market aligned strategy mix
5. Implementing strategic plan and budget
6. Building feedback and control mechanism.
Let us examine these ingredients.
Knowing your customers cannot be overemphasized in this era of intense competition. Specific models and tools can be applied to build a comprehensive framework. In general, we can say that market research leads the way in understanding consumer behavior specific to a product category or brand. The most important study of consumer behavior may revolve around “segmentation” studies. Marketers need to answer questions like how many segments are there in a specific market. What does the customer profile look like in every segment? Which segment has the highest growth and profitability? Table 1 demonstrates an example of nine segments depicting customers of dental hygiene products in Bangladesh, derived by using geographical segmentation.
Table 1: Segmentation of Dental Hygiene Market (Using Geographic Segmentation).
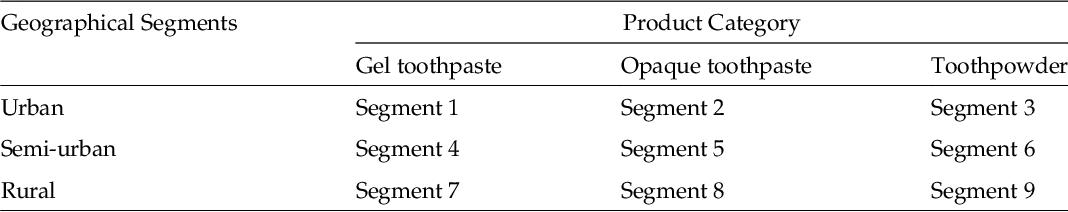
Assessing the viability of the segments will require estimating the market size and growth of each segment, projecting tentative profitability of each segment, and determining the customer profile in each segment (e.g., their level of income, age structure, usage pattern, and usage rate).3 However, changing the segmentation base to another variable may altogether lead to a new perspective of the market, which might provide fresh insights into the existing market segments. For example, observe Table 2 that shows how the segment definition changes with a change in the segmentation variable.
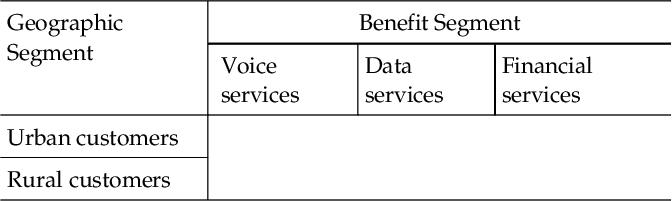
Table 2: Segmentation of Dental Hygiene Market (Using Benefit Segmentation).
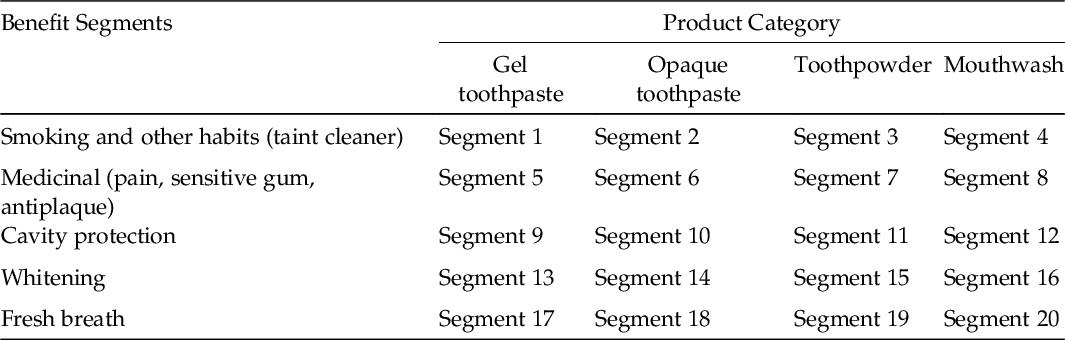
The segmentation analysis will still look at the same factors like market size and growth of each segment, tentative profitability of each segment, and customer profile in each segment. In contrast to the segments found in Table 1, segments in Table 2 will have a different profile once identified (for further details on segmentation, refer to Chapter 6 of this book).
A word of caution for marketing managers is this: Do not get bogged down in too much detail in segmenting markets. The purpose of segmentation is not only to know your customers but also to know your customers “better.” By the term “better,” we mean customer insights that go beyond just knowing what customers need.4 Thus, marketers need to look at which segmentation variable provides a segment scenario that helps to focus on customers’ needs and opportunities and satisfy their needs better. In some cases, Table 1 might provide a more focused profile than Table 2. In other cases, Table 2 might help focus more strategically than Table 1. For example, in many developing countries, a majority of the customers may not be aware of the different types of benefits that toothpaste might provide to its users. To most, using toothpaste is merely a once-a-day routine task. Without consumers being aware of the multifaceted benefits of specialty toothpastes, or even without knowing the existence of it (in some parts of the world), segmenting the current market as in Table 2 would be less useful. However, the outcome of Table 2 would be viewed as an opportunity by many others because nonexistence of a specialty benefit segment (like smokers’ segment) would mean that we can literally teach customers to use specialty toothpaste to avail of this benefit from a first-mover brand.
An important dilemma often facing marketing professionals is whether to combine multiple dimensions of variables for segmenting the same market.5 For example, is it possible to combine geographic segmentation with benefit segmentation to obtain a meaningful picture of the customer? This is possible, as it takes only another table to combine all the variables. But there is a question: how meaningful would that approach be to marketers? All we need to do is to combine both geographic and benefit segmentation in the same table. Thus, we will have five benefit segments under each of three geographical heads (5 × 3), times four product types (×4), leading to about 60 market segments. One can surely do these exercises if the time and budget to study 60 market segments are there without running the risk of market fragmentation.
Another model that can be combined with segmentation study is the Goal Hierarchy Analysis.6 Simply put, “goal hierarchy” refers to different levels of goals that combine with customers’ focal goal. For example, consider a person’s intention to buy a motorcycle.7 Goal Hierarchy would define his/her need for a motorcycle as the focal goal, whereas higher level goals like impressing the opposite gender, having a feeling of self-control, and the feeling of being “young and fast” would be viewed as super-ordinate goals. On the other hand, he or she would have to deal with lower level goals of transportation cost, ease of driving in a traffic jam, and low maintenance cost. Studying these goal hierarchies in each market segment may provide marketers opportunities to attain deeper customer insights (Table 3).
Table 3: Goal Hierarchy Analysis of Buying a Motorcycle.
Higher level: Super-ordinate goal |
Self-esteem, impressing others, self-control |
At the center: Focal goal |
Buying a motorcycle |
Lower level: Subordinate goal |
Lower transportation cost, moving around busy streets, lower maintenance cost than cars |
The bottom line in understanding customers is to know which segmentation variable is “Relevant” in a specific product category and finding out the segmentation profile to explore customer insights. Where would we use this customer insight in the strategic planning process? The whole purpose of gaining customer insights is to use it in designing an offering (4Ps) that would generate value for customers. Creating value for customers is the ultimate result of strategic marketing planning, keeping in mind the end results; everything thereafter becomes easy!
Knowing your competition plays an important role in marketing planning. This is like a game of guessing the opponent’s move before your turn in the chessboard. In this ever-changing competitive world, one must be aware of the competition’s strengths and weaknesses. Since the competitive environment is also comprised of other macro factors like Political, Economic, Social, and Technological (PEST) environments, a detailed market research study is inevitable for the purpose of understanding the impact of those forces on performance.8 For example, changes in government policy may hinder or encourage the pursuit of new market opportunities. A growing economy may mean increasing purchasing power, resulting in faster growth of product sales in the market. On the other hand, changes in technology may change the rules of the game for a business. In many areas, technological obsolescence is so rapid that almost every two years one has to switch to a new technology to survive. Changes in tastes and preferences of consumers may also open up new opportunities. For example, the increasing trend of domestic traveling among the Chinese has led to the growth of China’s domestic airlines. Of course, economic growth has also fueled this change.
Some marketers would argue that focusing too much on competition may actually make a company myopic or shortsighted. They would argue, instead, for the need to concentrate on yourself, your capabilities, and your strengths so that competitors will be awed by your creativity. They would argue that this is how competitors will learn from you. While this argument has merit, losing sight of the competition is also not desirable.
A well-crafted marketing intelligence system is required to keep abreast of the competitive environment. The system may be comprised of an internal database consisting of market reports by field sales executives, information from suppliers, retailers, promotion agencies, and other publicly available conversations of company executives at various forums. A regular perusal of newspapers and other media would also help to understand the trends of key PEST indicators that are relevant to the company. Specifically in regard to competitors, the key points of competitive information that might be of interest are product features, quality, design, average sales and growth, competitors’ customer profile, market share, marketing infrastructure, retail coverage, pricing policy, distribution policy, messages in their promotions, and current and possible future strategies.
Porter’s model of five forces9 may also be used in addition to PEST analysis to understand the competitive scenario, which is discussed later in this chapter. All of this information would be fed into the next step of strategic planning process, that is, SWOT analysis.10,11
Analysis of customers and the competitive environment will serve as input at this stage. Here, the company ought to analyze itself in terms of Strengths (S), Weaknesses (W), Opportunities (O), and Threats (T) in order to set its objective(s). TOWS analysis is another variant of SWOT analysis; it stands for Threats (T), Opportunities (O), Weaknesses (W), and Strengths (S). The only difference between these models is that TOWS emphasizes the external environment while SWOT emphasizes the internal environment. However, both of them results in a SWOT (or TOWS) Matrix as is presented in Table 4.
Table 4: SWOT Matrix.
|
Helpful in Achieving Objective |
Harmful in Achieving Objective |
Internal source |
Strengths |
Weaknesses |
External source |
Opportunities |
Threats |
Customer and competitive environment analysis will yield all the ingredients to construct a SWOT matrix. Good quality products, technological superiority, pool of experienced human resources, etc. could be examples of strengths. Poor distribution policy, lack of delivery vehicles, poor factory safety, etc. are examples of weaknesses. On the other hand, possible increases in government duties, new products from competitors, and capacity expansion of competitors’ facilities are examples of threat. Competitors’ quality problems, distribution lags, employee strikes, and changing tastes and preferences of customers are examples of opportunity. This SWOT matrix of information will help immensely to set up the objective(s) for the organization.
Why do SWOT analysis before setting objectives? Arguably, objectives that are set up without knowing one’s capabilities, resources, and limitations will be bound to fall short at the end. Thus, if an objective is stated before SWOT is done, it may have to be restated to make it more realistic and achievable. SWOT analysis makes an objective “SMART.” SMART12 is an abbreviation, which means that an objective has to be Specific (S), Measurable (M), Achievable (A), Realistic (R), and Time-bound (T).
For an objective to be specific, a set of six-W’s must be answered. An organization must know “who” is involved, “what” it wants to accomplish, “where” (location) should the objective be achieved, “when” it should be achieved, “which” requirements and constraints must be met, and “why” strive to accomplish the objective (benefits). An objective that says, “increase profits next year” is less specific than when it says, “all functional departments should strive to reduce operational costs without sacrificing quality of work that would lead to increase in profit by 2% within a year, so that customers can be offered competitively priced products in the market.”
The term measureable refers to establishing concrete criteria for measuring progress toward the attainment of each objective that is set, while the term achievable refers to the level of available resources and capabilities that would help achieve the objective(s). In order to be realistic, a goal must represent an objective toward which the management is both willing and able to work. If resources and a pool of capable people are committed to high goals, it is possible that a goal can be both demanding and realistic. Finally, an objective must have an explicit timeframe to achieve; otherwise, there would be no urgency to achieve the objective.
SWOT analysis may be supplemented with another strategic planning model called Porter’s value chain analysis (VCA).13 The model is presented in Table 5.
Table 5: Porter’s Value Chain Model.
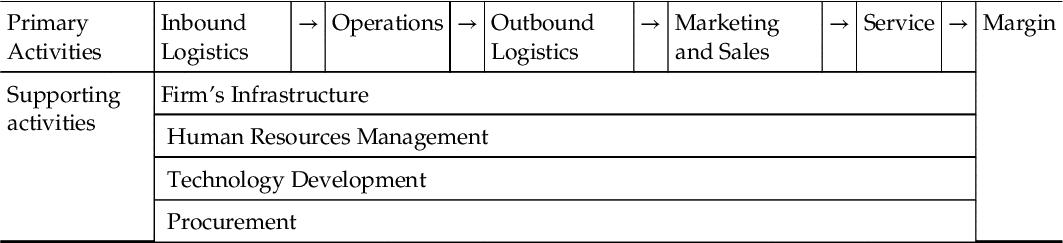
A business process may broadly be viewed as a sum of sequences where we pay for inputs, process these inputs to add value for customers, and sell outputs for profit. Profit is the end result of the whole value addition process. Michael Porter identified two broad ranges of activities: primary activities and supporting activities that add value in the business process. The model further divides primary activities into inbound logistics, operations, outbound logistics, marketing and sales, and services. Supporting activities are divided into firm’s infrastructure, human resources management, technology development, and procurement. Porter calls for identifying and scrutinizing each activity and finding areas to drive value addition that would ultimately lead to better profit margins. VCA can be performed in a three-step process as follows:
• Activity analysis: In this step, organizations identify the activities that they undertake to deliver products to customers. Using brainstorming to list all the step-by-step processes in a flowchart type analysis, organizations try to find all avenues to analyze value addition opportunities. These will include marketing of products, sales and taking of orders, operational processes, delivery systems, customer support, human resources decision processes, infrastructure analysis, and technology requirement and development.
• Value analysis: At the value analysis level, organizations must think through what they would do at each activity level in order to add the greatest value for customers. For example, if you are to provide repair services under warranty of previously sold products, consider what would add value to the whole complaint handling procedure for customers. Customers want quick response, an assured date of delivery of the service, courteous and polite handling of the complaint, and reliability of the repair service. Similar value analysis would be done at each activity level to identify things that ought to be changed to attain these value addition objectives.
• Evaluation and planning: After value analysis, organizations evaluate whether it is worth making changes, and then plan for action. Since there would be a huge list of value addition candidates, setting priorities would be a crucial decision. Successful organizations start with the easiest set of activities that might require minor modifications to enhance value addition. Gradually, they move toward addressing the more difficult ones.
VCA not only gives organizations a better idea of their business processes but also helps in creating and sustaining competitive advantage based on value addition for customers.
Here is a word of caution. We discussed how to set SMART objective(s) based on SWOT analysis and/or VCA, which assumes SWOT factors or value chain factors as given. Specifically for SWOT, that means no major change in SWOT characteristics is assumed. This approach aligns with the century old adage, “cut your coat according to your cloth.” How about an unrealistic objective under the current SWOT scenario that turns out to be highly realistic in a modified SWOT scenario? Modified SWOT scenario means that we might invest more to increase our strengths and aggressively reduce our weaknesses, so that the apparently unrealistic objective becomes SMART in the new scenario. This type of objective setting can be termed as “cut your coat according to your dreams!” This action part in modified SWOT analysis is addressed in the Strategy (the “how” part of the game) section of the marketing plan. Thus, while it is possible to set non-SMART objectives, subsequent SWOT analysis guides one to restate and make the objective(s) SMART; then stick to that non-SMART objective because you plan to intervene through creative strategy to make your objective(s) SMART after appropriate intervention. Obviously, a SWOT scenario must go through significant changes initiated by your strategy.
It ought to be evident by now that strategic marketing planning should not be viewed as a sum of strictly sequential steps; rather it is a process that often goes back and forth to make every part compatible with its previous and latter parts.
Having set up objective(s) that satisfy the above criteria, the organization would move next to crafting strategy.
We have so far discussed the “what” part of SWOT analysis and objective setting. Crafting market aligned strategy mix refers to the “how” part of the game plan. This is a crucial part of the plan that can spell the difference between failure and success.14 This is the part where creativity, ingenuity, and a strong dose of customer insights can result in success.
The key challenge in crafting marketing strategy is to generate creative strategic alternatives to efficiently attain the stated objective. Since the same objective can be attained in many different ways, strategic options should be generated exhaustively so that the best option can be chosen after detailed evaluation. This is the crucial challenge because competitors might have similar objectives; however, no matter how exhaustive your list of strategic alternatives might seem, competitors could probably always add an extra option that you did not imagine.
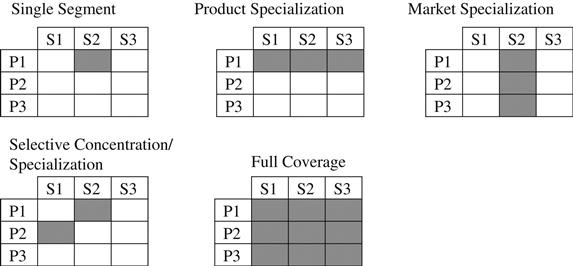
The first crucial step in strategy formulation is to find the most attractive segment based on customer insights and SWOT results. Thus, the input from segmentation studies and SWOT would be critical in defining market attractiveness. It is to be noted that, the most profitable segment may not always be the most attractive segment. It might be possible that the most profitable segment is also covered by strong competitors with unmatched resources that would mean assured demise for a new entrant with incompatible resource and capability bases. The most profitable segment would be the most attractive one, provided the new entrant has enough resources and capability to compete with strong players already occupying the segment. Therefore, we will combine customer insights and SWOT (or modified SWOT), and will select the most appropriate and attractive segment(s). There are several targeting strategies to follow. The following diagram shows five possible targeting patterns3 for the case of three products and three markets:
Tips
Plug in Table 1 of this chapter into these five models of targeting strategies and see the resulting market segments.
Single segment strategy targets one market segment, and is served with one combination of marketing offerings (4Ps). Also known as concentration strategy, this approach is often adopted by smaller firms with limited resources and capabilities. Example could be the Sufia Chemical’s Bidyut toothpowder targeting the rural segment only. Product specialization refers to the strategy of specializing in a particular product line/category and offering this to different market segments with some levels of customization. If a company offers only toothpowder tailored for all three market segments, we would call them a toothpowder specialist. In contrast, market specialization refers to serving a particular market segment by offering that segment an array of different products to satisfy the needs of that segment only. Selective specialization is a multi-segment strategy, the firm being selective and discontinuous in terms of market and product choice. Different marketing mixes are offered to different segments in this strategy. The product itself may or may not be significantly different; however, in many cases, promotional message, packaging, distribution channels, etc. may vary. Finally, full market coverage is the targeting strategy where the firm attempts to serve the entire market, covering all segments with different types of products. This coverage can be achieved by means of either a mass or untailored marketing strategy in which a single undifferentiated marketing mix is offered to all the segments, or by a differentiated strategy in which a separate marketing mix is offered to each segment. The bottom line is that all customers of all segments are of concern here.
Based on the targeting decision derived from the above analysis, Igor Ansoff’s Product-Market Grid Model can be used for identification of growth strategies. Ansoff’s model15 shows four basic areas of strategic choices to attain growth. You can choose to continue offering the current product to the current market (penetration strategy); you may choose to expand to a new market with your current product (market development); you may choose to develop new products for the current market (product development), and/or you may offer a new product for a new market (diversification). Table 6 shows the strategic alternatives, which can also be employed simultaneously depending on resources and capabilities.
Table 6: Ansoff’s Product Market Grid.
|
Existing Market |
New Market |
Existing product |
Market penetration |
Market development |
New product |
Product development |
Diversification |
Market penetration usually focuses on changing incidental customers to regular customers, and regular customers into heavy customers. Typical tactics are volume discounts, discount coupons, better customer service, and relationship management. This is similar to finding more ways to serve the current market better and increase market share. In market development strategy, marketers often try to attract clients away from competitors or try to find new uses of existing product whereby they find new customer groups. Firms may also introduce existing products in export markets or introduce new brand names in the existing product category targeting a new market. It can be done by line extension and/or multi-branding with the aim of targeting new market with a current product version. On the other hand, product development strategy depends on developing new product for current users. This can be accessories, add-ons, or completely new products to already existing customers. Often existing communication and distribution channels are leveraged for this purpose. Diversification strategy calls for introducing new products to a new market. This is often viewed as the riskiest strategy, often centering on a credible campaign from marketers to explain to customers why they had to introduce this product to a new group of buyers.
Once the growth strategies are identified through customer insights, SWOT matrix, target market choice, and the Ansoff Matrix, marketers need to devise their brand architecture that would be integrated in the strategic marketing plan. This could also be seen as a starting point toward formally defining your brand strategy. Brand architecture16 refers to how an organization structures and names the brands within its portfolio. It is the starting point from where the organization designs and places its brands in the overall organizational strategic landscape. There are three main types of brand architectures: (i) Monolithic architecture, where the corporate name is used on all products offered by the organization (also called corporate brand), for example, Sony; (ii) Endorsed architecture, where all sub-brands are linked to the corporate brand by means of either a verbal or visual endorsement, for example, ACI consumer products; and (iii) Freestanding architecture, where the corporate brand operates merely as a holding company, and each product or service is individually branded for its target market, for example, Lux and Dalda from Unilever.
The next challenge is to develop a core value proposition (CVP) for every product in each category. Core value proposition refers to what would be the prime value that you would give your customers for buying your product. Unique selling proposition (USP), the unique reason to buy a product, could be seen as an expression of CVP. What could be the possible source(s) of this uniqueness? In their paper titled “The Core Competence of the Corporation,” Prahalad and Hamel17 argued that “Core Competences” are some of the most important sources of uniqueness: these are the things that a company can do uniquely well, that no one else can copy quickly enough to affect competition. This is why there is a great amount of emphasis on creating and sustaining USPs in business.
If you are capable of offering something that has uniqueness and relevance to customers, customers will prefer and even pay a premium to get it. Besides uniqueness, relevance is also important to create and sustain a USP. A unique selling proposition must create a meaning of “value” or usefulness to customers. Thus, mere uniqueness is not enough for a sustainable USP, it is the relevance that creates an important connection between uniqueness and customers’ needs. For example, an air conditioner brand once offered a unique product in Bangladesh: Its filter contained vitamin C which would be circulating the vitamin in the air while the machine is running. No matter how unique this proposition, this might not have been relevant in Bangladesh market and the product did not do well.
Tips
Working backward, in most cases, you may find out your competitors’ USP by starting from their brand slogans or taglines. Can you guess Sony’s competitive advantage when they say “Make Believe”?
Sometimes organizations may concentrate on developing core competences based on customer insights centering around those needs that none in the market has addressed so far. In their book “Blue Ocean Strategy,” Kim and Mauborgne18 of the Blue Ocean Strategy Institute at INSEAD talked about a business strategy of competing in an uncontested market space (blue ocean), in contrast to competing in a market already turned red by fighting among rivals (red ocean). The authors illustrated what they believed to be the best organizational strategy to generate growth and profits. Examples are Google Maps, Google’s driverless cars, or Richard Branson’s Virgin Galactic that plans for space tourism through human spaceflights!
Creative formulation and execution of differentiation must be implanted in the product, price, place, and promotion so that the desired positioning is achieved in customers’ minds. Effective differentiation and communication are the keys to successful positioning. The ultimate objective would be to create sustainable brand equity through customers’ brand knowledge and increasing brand loyalty. A sustained level of Brand Associations19 would be derived as a result of the experiences that must be consistent with the brand positioning and the basis of differentiation (details on branding are provided in Chapters 10 and 11 of this book).
Positioning strategy is crucial in strategic marketing. It is possible that when an organization plans for multiple segments, it may choose different positioning strategies in different segments in order to align with a SWOT scenario. In other words, positioning should be planned in such a way as to create a base of competitive advantage in your favor.
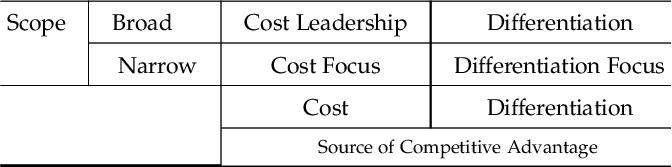
Michael Porter, in his book titled “Competitive Advantage: Creating and Sustaining Superior Performance,” identified three possible generic strategies for organizations,20 no matter what sectors they are in. They are “cost leadership” (no frills, offering same or better products at low cost, centered around competing on price), “Differentiation” (creating uniquely desirable products and services, mostly based on non-price competition) and “Focus” (offering a specialized service in a niche market). Focus strategy is further divided into two parts: “Cost Focus” and “Differentiation Focus,” meaning cost leadership strategy in niche market and differentiation strategy in niche market. In fact, cost leadership and cost focus might sometimes be confusing. The basic strategy is the same, meaning similar approach of being a cost leader and offering customers a price advantage. While cost leadership refers to applying this in a broad market, cost focus refers to applying the same strategy in a niche or narrow market. The same argument is applicable between differentiation and differentiation focus strategy. These are given in Table 7.
Table 7: Porter’s Generic Strategies.
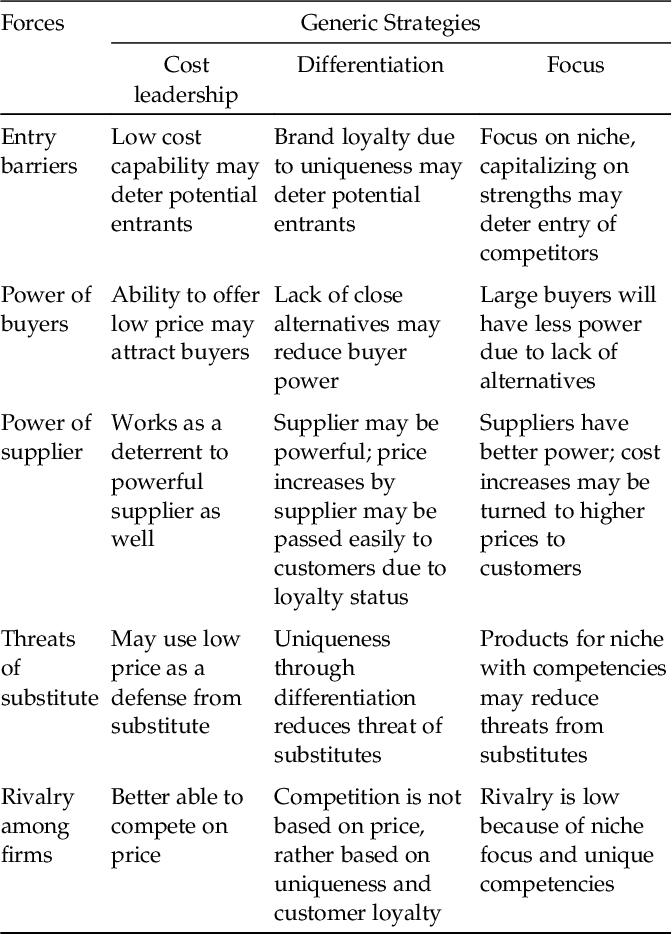
In another model by Michael Porter, popularly known as Porter’s Five Forces Model,21 it was argued that businesses must respond to five competitive forces: threats of new entrants, bargaining power of suppliers, threats from substitute products, bargaining power of buyers, and rivalry among existing firms in the industry. The main implications of Porter’s generic strategies based on these forces are summarized in Table 8.
Table 8: Porter’s Five Forces Model and Implication of Generic Strategies.
In a nutshell, it should be kept in mind that the segmentation, targeting, and positioning (STP) strategy should align with the marketing offerings (basic 4P’s) so that they create the right appeal to the right group of customers with the right value proposition(s). This is how a successful strategy will lead organizations to success.
Implementation of strategy is as important as its formulation. An excellent strategy, when poorly implemented, will surely fall short of its objectives. On the other hand, an average strategy could bring great results because of its excellent execution by all team members. Therefore, we need to take a careful look at the implementation plan.
Implementation requires finance, infrastructure, and human resources. Out of all resources, human resources should receive the utmost importance, because this is the only resource that has a mind of its own! Aligning human resources with organizational culture, customs, practices, objectives, and strategies, however, is not an easy task.
Bonoma of the Harvard Business School extensively studied marketing strategy implementation.22 In his famous book “Marketing Edge,” he explained that implementation can be effective at four levels:
1. Actions which are the building blocks for execution (basically, 4Ps)
2. Programs which are a set of marketing actions
3. Systems which include the formal structure in the organization that help in the execution (formal methods of budgeting, sales reporting, and operational control)
4. Policies which outline the organization’s culture and give direction to the marketing campaign.
Bonoma’s studies also showed that for successful execution, three processes — strategy process, people process, and operations process — can help in marketing strategy implementation.
• Strategy process consists of gaining customer satisfaction and building customer trust. It requires choosing the right resources to execute the strategy.
• People process evaluates individuals and provides an understanding of the team’s ability. It also requires leadership and developing a succession plan for leadership.
• Operating process synchronizes the strategy and people together with an operating plan. For this purpose, it breaks down long-term objectives into short-term objectives. Regular follow-up of the operational process is also necessary to monitor changes and new requirements.
According to his studies, when implementation begins, there will always be a number of barriers to slow down the process. First one is the internal resistance. It refers to an organization’s inertia to accept change and faulty perspectives of team members about the new strategy. Second, rise of conflict within the existing power structure due to differences in professional ideologies. Implementation of a strategic marketing plan may make some sections of an organization’s human resources apprehensive about their future influence in the organization. As a result, third, there would be a lack of information sharing and communication between individuals and business units or top management and organizational members.
To overcome these barriers, some of the strategy implementation processes that can be followed are given here:
• Commander model: This model would be best suited to a firm which has a charismatic and powerful leader. The model is based on commanding the expected execution. This model is less likely to result in uncertainty regarding implementation as one person makes the decisions. However, in this model, there is a chance of generating low employee motivation due to lack of ground-level participation in day-to-day decision making.
• Collaborative model: Unlike the commander model, this model is best suited to team building and motivating the lower level members of the team by making them a part of the implementation decisions. The commitment levels of the team is higher and is best suited for complex and unstable environments.
• Cultural model: In the cultural model, marketing strategy is a part of the organizational strategy and all team members are encouraged to involve themselves in decision making which is prolonged due to the number of contributors. In this model, the manager acts as a coach or mentor who guides employees through the process of learning and implementing.
Depending on the model chosen and the responsibility assigned to people in charge, budget estimations must be made based on activity and timeframe. Choice of strategic options will have tremendous impact on budget allocations. Depending on how much the organization will spend on research and development, on new product development, on investing in infrastructure, on the kind of messages and media: all these will influence the budget decisions at this level.
Without leadership roles, implementation cannot be done efficiently. Here lies an important facet of leader-follower relationship inside an organization. Budgets alone cannot guide implementation programs; rather, there must be a high level of trust between the leader and followers. Sustained levels of trust and motivation are essential elements of successful implementation of strategy. Good relationships with dealers, collaborators, and other external organizations are also important prerequisites for the success of implementation. Communication and signaling in both horizontal and vertical positions in an organization should be clear and simple to achieve effectiveness and efficiency during the implementation process.
Without monitoring and control, a strategic marketing plan will soon lose its direction once it is being implemented. Control mechanisms require setting standards, comparing performance against standards, and taking corrective measures to keep performance aligned with the standards. Different organizations achieve these ends through various means; however, the objective of the mechanism stays the same. Specifically marketing performance is measured in terms of market share, sales, profits, marketing effectiveness, customer perception, and customer satisfaction. Hence most control measures are designed with these parameters in mind.
There are four types of controls23 with different objectives and tools: they are also allocated to different levels of management:
1. Annual plan control: This mechanism is executed by the top- or mid-level management to evaluate actual performance with the projected one to analyze shortfalls. The tools used are sales analysis, market share analysis, sales-to-expense ratios, financial analysis, and market-based scorecard analysis.
2. Profitability control: It is used by the functional department to examine profitability by product, territory, customer segment, and trade channel.
3. Efficiency control: This control mechanism is used to assess the effectiveness of spending on sales force, advertising, sales promotion, and distribution.
4. Strategic control: Strategic control helps the organization to evaluate its strategies by focusing on the outcomes of the activities undertaken. Some of the tools include marketing effectiveness rating instrument, marketing audit, marketing excellence review, and company ethical and social responsibility review.
An organization may choose to be selective in setting up a set of indicators to be monitored for control purposes. No matter what tools an organization chooses to use in any of the preceding four types of control systems, a generic approach of objective-based monitoring will result in a meaningful control mechanism that would suit the organization’s purposes the best. Since the marketing control process includes monitoring, evaluating, and improving performance of each activity, the following steps are recommended before choosing a set of indices to monitor and take corrective actions:
(a) Decide on the aspect(s) of marketing operation to be evaluated: The first step is to decide on the marketing operations to evaluate. For example, advertising effectiveness, performance of sales people, yearly profitability changes, or territory-wise performance of products.
(b) Establish measurement criterion: Performance standards or measurement criteria are decided against which actual performance would be compared. For example, advertising effectiveness may be measured by response of sales to advertising spending growth, along with increases in consumer awareness due to advertising.
(c) Establish monitoring mechanism: After setting the standards, monitoring mechanism and tools would be planned. Designing a Marketing Information System (MkIS) is required at this level. MkIS can be designed to record and monitor performance of all marketing areas like weekly sales volume, territory-wise sales performance of sales force, profitability changes, over time, etc.
(d) Compare actual results with standards of performance: Results obtained through MkIS would be compared with predetermined standards of performance and gaps would be identified with probable reasons.
(e) Corrective action and analysis of improvement: If results are not as desired, corrective actions would be identified and initiated to bring performance to track. Monitoring of corrective actions should also be done to track and analyze whether corrective actions are actually improving performance.
Table 9 contains a visual summary of the entire chapter for quick reference.
Table 9: Chapter Summary.
Strategic Marketing Steps |
Activities |
Model/Approach Used |
1. Formulation |
Knowing your customers |
Segmentation studies, Goal Hierarchy Analysis |
Knowing your environment |
PEST analysis, Porter’s Five Forces Model, Marketing Information System |
|
Knowing yourself |
SWOT/TOWS, Value Chain Model, SMART objective |
|
Crafting market aligned strategy mix |
Segmentation studies, Core Competences, Ansoff Matrix, Porter’s Five Forces Model, Porter’s Generic Strategies, Branding |
|
2. Implementation |
Implementing Strategy and Budget, positioning, communication |
Strategy process, people process, operating process, commander model, collaborative model, cultural model |
3. Feedback and control |
Tracking performance and taking corrective actions |
Marketing Information System, annual plan control, profitability control, efficiency control, strategic control, marketing audit |
Case 1: Strategic Planning and Marketing Models
Vietnam’s Mobile Phone Market: Strategic Choices for Operators
Khandoker Mahmudur Rahman
Vietnam is popularly known to the outside world as a country that fought a war with the United States in the 1960s. Since its peak in the communist era, the country gradually moved from its socialist views toward a more capitalist system as far as private businesses were concerned. With its gradual opening of markets through liberalization policies starting in the late 1980s, Vietnam experienced a positive outcome in terms of growth and investment during the last decade (2000–2010). Foreign businesses, including many renowned multinational corporations, gradually stepped in with various forms of investment in the country. To highlight the rapid economic growth, various foreign media dubbed Vietnam as the “Next Tiger” in Asia.
With an estimated population of 87.8 million as of 2011, it is the world’s 13th most populous country, and the eighth most populous country in Asia. Despite its relatively high levels of income disparities, deficiency in healthcare provision, gender inequality, and rising inflationary pressures, its economy has been showing strong growth since 2000. In various global economic studies, Vietnam came up with its own promises. In a study in 2009, Robert Ward, the Global Forecasting Director for the Economist Intelligence Unit (EIU), grouped the six most promising economies of the world based on certain economic and social indices. The group is called CIVETS that stands for Colombia, Indonesia, Vietnam, Egypt, Turkey, and South Africa. These countries are favored for several reasons, such as a diverse and dynamic economy and a young, growing population. This list is comparable to the “Next Eleven,” proposed by Goldman Sachs, and the G20 developing nations. Vietnam has the highest Global Growth Generators Index among 11 major economies, and its successful economic reforms resulted in its joining the World Trade Organization in 2007.
Despite the dominance of state-owned enterprises in Vietnam’s economy, where state-owned enterprises still produce about 40% of GDP, Vietnamese authorities have been on a steady track of commitment to economic liberalization and global integration. As a sign of industrialization, agriculture’s share of economic output has continued to shrink from about 25% in 2000 to about 22% in 2011, while industry’s share increased from 36% to 40% in the same period. The recent global recession has hurt Vietnam’s export-oriented economy, with GDP in 2009–2011 growing less than the 7% per annum. As a result, since 2008, the government devalued the currency (Dong) in excess of 20% through a series of steps.
The government’s strong growth-oriented economic policies resulted in the region’s highest inflation rates as well, which reached as high as 23% in August 2011 and averaged 18% for the year. As a result, Vietnam shifted its focus away from economic growth to stabilizing its economy by adopting conservative fiscal and monetary policies. However, confidence of foreign donors and development partners seems to be intact. Foreign donors pledged nearly $8 billion in new development assistance for 2011. In line with its continuous restructuring program, Vietnam unveiled a broad “three pillar” economic reform program in 2012, proposing the restructuring of public investment, state-owned enterprises, and the banking sector. This type of reform is not anything new though. At various points of time in the past, reforms were named using various terms, with similar objectives in mind.
It is evident that consistent growth over a decade supported by the government’s commitment toward reforms has resulted in growth in every sector of the economy, including the telecommunication sector. Besides growth in fixed phone subscriptions, Vietnam has experienced substantial growth in the mobile phone market. Table 10 shows 10-year data of fixed phone and mobile phone subscription growth in Vietnam.
Table 10: Growth of Vietnam Telecom Market.
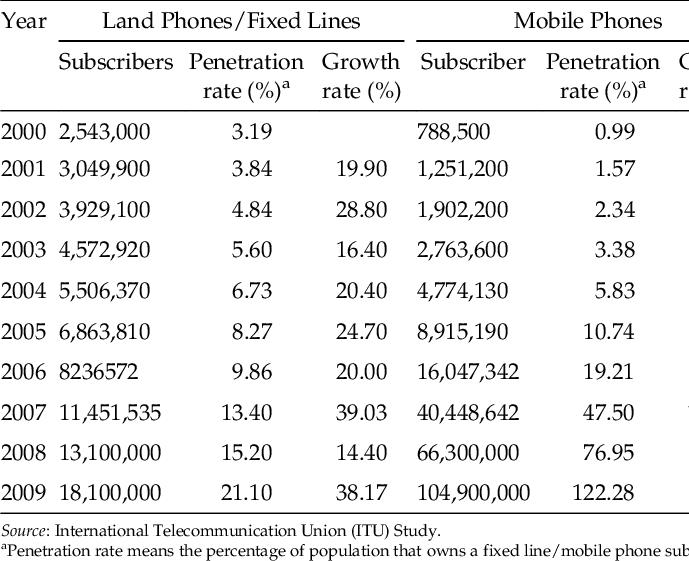
A careful look at mobile phone subscription growth suggests that, there were significant changes in growth figures starting from 2005 onwards. In fact, this could be attributable to reforms in the public sector, where state-owned telecom operators went through an equity restructuring process. This restructuring program of public investment and state-owned enterprises resulted in allowance of foreign equity in many state-owned enterprises. One such example is the investment by Nordic Telecommunication giant Telenor in 2005, when the company went for strategic investment in a state-owned enterprise, in line with the government’s policy of equity offloading (selling a part of government’s shares of equity to foreign companies) of public enterprises. Through this equity buying process, private enterprises can manage a stake as a “strategic partner” in the telecom sector.
With a penetration rate of over 100%, Vietnam is considered as one of the fastest growing mobile phone markets in the world. However, there are problems like unused SIM cards and unreal subscribers as well. At the end of 2009, some experts opined that, only about 50 million of the 104.9 million of cards are in actual use. Unreal subscriber problem leads to such consequences as wastage of national mobile numbers, wastage of SIM card fees, spamming, SMS advertising, fraudulent messages, etc.
Vietnam’s telecom market is still dominated by state-owned enterprises. The private stakeholders, primarily foreign corporations, are working as strategic partners through the government’s offloaded equity stakes in their portfolio. Large enterprises are still primarily state-owned, and more than 90% of telecom networks in Vietnam belong to the State. The following operators are currently offering their services in the mobile market:
• Viettel Mobile (directly under Viettel Corporation): Headquartered in Hanoi, Vietnam, Viettel Mobile was incorporated on June 1, 1989. It joined Vietnam telecom market in 2000 as the fourth entrant. It claims to be Vietnam’s number one Information and Communication Technology (ICT) Group in terms of infrastructure. It also owns the largest 3G network in Vietnam. As of 2009, market share stood at 34% of the total mobile phone market.
• MobiFone (directly under VMS — Vietnam Mobile Telecom Services Company): Vietnam Mobile Telecom Services Company (VMS) is a state-owned company under Vietnam Posts and Telecommunications Corporation. After it was founded in April 16, 1993, VMS has become the first GSM 900/1800 mobile telephony service provider under the brand name MobiFone, marking the beginning of the mobile telephony industry in Vietnam. MobiFone specializes in developing networks and providing mobile telephony. In 2005, equity offload took place where Comvik (Sweden) bought an equity stake at VMS. As of 2009, MobiFone had the highest market share of all brands, comprising 41% of the total market.
• Vinaphone (directly under VNPT — Vietnam Posts and Telecommunication Group): Vinaphone was launched in 1996 as a mobile service brand, by Vietnam Posts and Telecommunication Group, another state-owned enterprise in telecom sector in Vietnam. Vinaphone is the third largest telecommunications provider in Vietnam, contributing 20% to the total mobile communication market as of 2009. However, Vietnam Posts and Telecommunication Group is the largest provider of fixed phone connections, with about 80% market share of fixed phone subscription in Vietnam.
• S-Fone (directly under CDMA S-Telecom): S-Fone is a mobile service brand by S-Telecom, Vietnam. It is the fourth largest mobile communication operator in Vietnam that uses the code division multiple access (CDMA) technology. Stationed in Ho Chi Minh City, it has a market share of 3%.
• EVN Telecom (directly under Vietnam Electricity): Comprising of 2% market share, EVN telecom is the fifth largest mobile service provider in Vietnam. This is a venture of Vietnam Electricity, a state-owned enterprise primarily engaged in power generation.
Vietnamobile (ex-HT Mobile) and Beeline are two other smaller competitors in the market. However, Beeline was discontinued in 2012, which operated directly under G-Tel. Since its closure, Beeline was renamed G-Mobile.
It seems that, even though Vietnam could be a booming market with seven mobile operators, only three of the players account for about 90% of the market. Smaller firms often get caught in stiff price competition and face severe financial difficulty due to lack of a customer base. In an open market economy, such a situation would lead these small firms to declare bankruptcy; however, such is not the case in Vietnam. Since they are state-owned corporations, the government eventually decides what to do with these near-bankrupt companies. Usually, the government directs these smaller and losing firms to go for mergers or requests larger firms to go for acquisition. Evidently, it seems like the nature of competition is controlled and enforced substantially by the state, rather than independent decisions of the companies concerned.
Adoption of the latest available communication technologies is another aspect of the capability of these organizations. With growing demand of 3G in the market, service providers are already updating and testing their infrastructure to support a 4G network in the country in the near future. However, it was reported that the government might not give permission to operate 4G soon.
Another important dimension in the competitive scenario is the pricing of mobile phone services. Like in other Asian countries, Vietnam is also facing stiff price competition in the market. Price comparison among regions can be compared by average revenue per user (ARPU). ARPU is a measure used primarily by consumer communications and networking companies, defined as the total revenue divided by the number of subscribers, usually expressed in month/quarter/year. Table 11 compares ARPU of some countries in the region.
Table 11: ARPU (in US $) in Some Selected Countries.
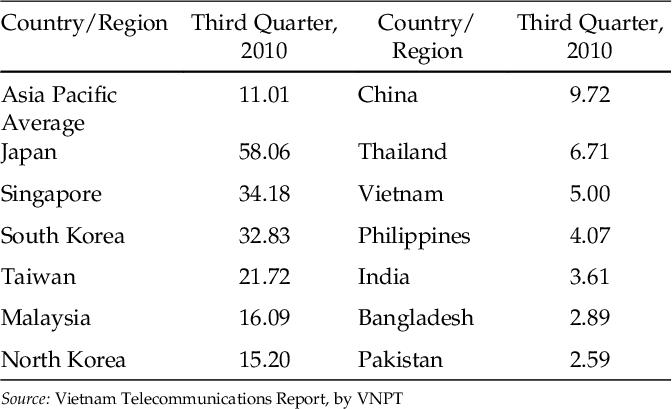
Lower ARPU means lower revenue for mobile operators; it also means that consumers are enjoying lower call rates. According to an estimate, the downward pressure on ARPU in Vietnam may move the ARPU from current US $5.00 to US $3.51 in 2015.
The mobile phone market in Vietnam can be viewed as a sum of benefit provision such as voice services, data services, and financial services. Evidently, it seems that voice services have the highest demand even though the market is nearing saturation with a slowing growth rate. Data services are becoming popular, even though growth is lower than voice services. Vietnam currently has about 30.8 million internet users as of 2012, showing about a 35% increase compared with that of 2009. These users are served by 21 Internet Service Providers (ISP), including the major mobile operators already in the market. With an internet penetration rate of 39% (estimates of 2013), as compared to mobile penetration rate of 150% as of mid-2012, data services market seems to have some untapped potential to explore.
Even though social media like Twitter and Facebook are banned in Vietnam, internet users often use these social media sites by using circumventing software to bypass the state ban. A survey of internet users shows that a majority of users like to read news on the internet, followed by searching for information, listening to music, research studies, and chatting. About 75% of the users prefer to use internet at home and during weekdays.
Financial services through mobile operators seem to be another growing niche where new entrants or existing firms may choose to play in future. Specifically, mobile banking could present a critical opportunity for microfinance since it lowers transaction costs, improves convenience for customers, makes transactions more secure, and helps businesses increase transparency. In a country like Vietnam, mobile banking can open up a new horizon in the rural banking sector.
Rural telecommunication and data services offer a new horizon of growth. The government has already approved a US $1.19 billion project on rural information and communication development to be implemented during 2011–2012. The project aims to provide multiservice broadband connection to boost telecommunication infrastructure and services in remote areas of the country. It is estimated that, by 2020, internet subscribers in rural areas will account for 30–40% of the national average density, thus showing a new potential for future growth. In addition, the government plans to supply e-public services to rural areas to enable local citizens to raise questions to the authorities and receive answers through e-mail. The program focuses on setting up a model for public internet services in rural areas and bringing television and radio coverage nationwide starting in 2012.
In line with the government’s initiative to roll out information and communication technology to rural areas, foreign donors are also contributing to this end. The Bill and Melinda Gates Foundation, a charitable body of Microsoft’s founder Bill Gates, has already provided donation, along with $3.64 million worth of Microsoft software, toward a $50.6 million government initiative that is expected to provide basic computer skills and access to internet for rural citizens. The project will see 12,070 internet-ready computers set up at 1900 public libraries (65% of the country’s total) in 40 of Vietnam’s most disadvantaged provinces. It is expected that the initiative can make a big difference bridging the digital divide between Vietnam’s rural and urban population.
Answer the following questions from the perspective of mobile phone companies:
1. Based on the information given in the case, do a PEST analysis for Vietnam’s Telecom market?
2. With a penetration rate of over 100%, do you think mobile operators should stop promoting their voice services to new subscribers? Explain your answer with reasoning.
3. Show all the possible market segments by combining both the benefit segmentation and geographic segmentation in a single diagram, and explain which segment you would most likely to choose if you were a small organization in the telecom market.
4. Based on Porter’s generic strategies, which one of the three market segments (voice services, data services, and financial services) might be the best candidate for focus strategy? Defend your answer with reasoning.
5. From the perspective of small operators, discuss the tentative implication of various strategies, with reference to Ansoff Model.
Answer guide Q1:
Students are expected to structure the PEST contents of the case in a tabular format that can visually be clear after the analysis is done. For example, under the column of political environment, the Vietnam government’s support for deregulation can be listed as an important phenomenon. At the same time, the government’s control through equity stakes and its suggestions to mobile operators for merger/acquisition should also be noted. The issue of government’s willingness to permit the introduction of 4G and its implication can also be discussed. Similar analysis can be done for economic, social, and technological environment.
Answer guide Q2:
It is mentioned in the case that, almost half of the subscribers are actually active as of 2009. Therefore, a penetration rate of over 100% does not tell the whole story. There are problems like unused SIM cards and unreal subscribers. This leads to the problem of mobile advertising, spamming, fraudulent messages, etc. Therefore, companies should not stop promoting their services; rather they might concentrate on detecting unreal subscribers and manage them while promoting their voice services at the same time.
Answer guide Q3:
The tentative table may look like this:
Assuming that small operators will be limited by their resources and capabilities as compared to their larger counterparts, students need to plug in the competitiveness of benefit segments and geographic segments in determining their choice of segments (i.e., the most attractive segment to choose from). Based on the limited information given in the case, the answer to this question would be of speculative in nature; however, the objective of this question is to test the students’ ability to synthesize complex information from a competitive scenario, and put things in right perspective with necessary assumptions and arguments. For example, one may argue that, small operators may offer data services to urban customers because of possible concentration of customers in a less dispersed geographic area, requiring fewer infrastructures as compared to voice services. Others may argue that, small operators should operate in niche markets like financial services for rural customers. Since remote areas may not be covered by traditional banking services, retail booths of mobile banking can provide an effective solution.
Answer guide Q4:
It is indicated in the case that, out of the three services (voice, data, and financial services), financial services market is a growing niche. Based on Porter’s generic strategies, arguments for a “focus strategy” would be stronger for financial services market. However, dissenting views are possible, and the instructor needs to evaluate the assumptions of students.
Answer guide Q5:
In answering this question, the tentative implications of strategies based on Ansoff’s model need to be viewed from a small operator’s perspective. It is implied that small operators have less resources and capabilities as compared to their larger counterparts. Therefore, their aggressiveness and R&D capabilities, arguably, would be less than that of their bigger counterparts. Having a look at the Ansoff model (Table 5) might provide some clues to this question.
For example, some might argue that diversification would be the riskiest strategy for small operators because it seems to be the most aggressive of these four strategies. Market development could be a rewarding strategy for small operators because they do not have to develop any new services, rather offer the same services to a different market segment. Similarly, implications can be drawn for market penetration and product development strategies as well.
Case 2: Strategic Planning and Marketing Models
Veen there, done that! Strategic Story of Veen Water in India
Khandoker Mahmudur Rahman
The case is solely based on publicly available sources like newspapers, research papers that are available online and company websites. Any fact or figure is meant to neither promote nor malign any product, individual, institution, or companies mentioned or implied in the case.
Veen Water Inc. was established in 2006 in Finland, positioning its Veen brand as a premium and authentic natural spring water from a pristine lake in Lapland, Finland. The water of this lake is known for its purity and taste. The lake is located in an almost uninhabited area where the population density is only two per square kilometer. Based on this exclusive access to the premium source, coupled with unique glass bottling, Veen has appeared to be a promising brand in the premium bottled water market globally. It is positioned in the category where renowned brands like Glaceau Smartwater, Voss, Perrier, Evian etc. are competing. These brands are primarily marketed in Europe and North America, commanding price premium. However, only a minimal presence of these brands may be traced to relatively small niches in emerging markets with no aggressive marketing effort from the companies’ part. However, it came as a surprise when Veen Water jumped into the Indian market with a vigorous marketing agenda in 2012. What is so special about bottled water market and the Indian market in particular?
Bottled water industry is expanding all over the world due to rising scarcity of potable water, increasing health concerns, unreliable public water supply, as well as rising income of target market segments. The growing affluent segments in emerging economies are showing signs of lifestyle changes leading to the habit of buying “safe” water for everyday drinking. According to Euromonitor International, an independent research company specializing in consumer markets, bottled water will likely exceed tea as the world’s most consumed and packaged beverage with total volume expected to reach 300 billion liters in 2014. Market statistics indicate that the global volume growth of bottled water is unprecedented. The market is expected to grow by about 100 billion liters from 2013 to 2018 that will surpass the previous five-year period by over 25 billion liters. This will make bottled water the world’s fastest growing “soft drink.”
However, the growth in Europe is lower than that in the emerging markets in Asia, mostly because of the reliability of public water supply in the developed world unlike the tap water in many developing countries. The rising demand in the emerging markets may also be interpreted as a failure of the public utilities in many developing countries to ensure safe and reliable water supply. In addition, the rising health concerns among growing affluent class in the developing economies may also have sparked the demand for bottled water.
This growth opportunity probably has attracted investment in production and marketing in this sector from large multinational companies and also from small and medium local enterprises. The competition is already intense both globally and locally. Danone, Coca Cola, PepsiCo, and Nestle are the four global players in this market, though not all of them are directly present in India. The typical business model calls for setting up local production facilities as closely as possible to the geographic location of the market, thus minimizing transportation costs which is an important issue in bottled water marketing due to per unit weight and volume of the product.
Local brands, often offering products of comparable standards with lower prices, can easily pose serious challenges to global players entering a local market. Undoubtedly, apart from competition among global players themselves, these giants are continuously challenged by local brands. It is estimated that about 150 domestic water brands are available in India, although not all of them compete nationally. Some are available only on regional basis. As a result, brands are frantically trying to carve out their market shares by articulating positioning strategies.
In addition to intense competitive pressure, local politics has started having an impact on water prices as well, particularly in a developing country like India. In 2013, the Tamil Nadu Chief Minister, Jayalalithaa, launched a program to provide bottled water for Rs. 10 a liter. The Chief Minister inaugurated the “Amma Drinking Water” plant at Gummidipoondy in nearby Tiruvallur district, aimed at selling cheaper bottled water in all long-distance government buses and bus stops in Chennai and other districts. This is claimed by the government as a pro-people welfare move. This price is much lower than railway or private companies charging Rs. 15–20 for a bottle of water in such places (as of March, 2014). The government also planned to establish more water bottling plants under the state transport corporations. It is possible that a negative public attitude toward private companies selling pricey water brands may result from this popular initiative.
Government and the general public also appear to be cautious about alleged malpractices by private corporations. Almost every bottled water company in India was either fined or faced a lawsuit for various alleged environmental and social malpractices. In early 2014, the general public protested in Mehdiganj, India, alleging landgrab by the Coke bottler in the local area. The government investigation resulted in an official order to evict the Coke bottler from the area. News reports revealed that the protest was going on since 2003 on other grounds, alleging shortage of water for irrigation in the area due to excessive extraction of underground water by the bottler. Coca Cola Headquarter supported the government initiative as they asserted zero tolerance to landgrab by any of its supply chain members. Another incident in 2006 put the multinational bottlers’ reputation at stake. A lab report by the Centre for Science and the Environment (CSE), a New Delhi based non-government organization (NGO), claimed the presence of pesticide in cola brands marketed by Coke and PepsiCo in India. The test report got wide public and media attention that attracted political and legal moves from a number of states. Both companies maintained that the soft drinks were safe for consumption since the pesticide residue was within the safe limit. Both argued that their cola products contain trace amount of pesticides — present in the groundwater used in making soft drinks, and were lower than those found in meats, milk, and eggs. Though their bottled water did not contain pesticide residues, the ruckus resulted in a state order to close Coke’s Plachimada plant and PepsiCo’s Kanjikode plant, where the companies have also been producing the Kinley and Aquafina water brands, respectively.
The leading local brand, Bisleri, has not been without controversy as well. The Times of India reported in its May 8, 2014 issue that the Delhi Pollution Control Committee handed a closure notice to Bisleri for extracting groundwater without permission from Delhi Jal Board (Delhi Water Board). The plant allegedly drew over 0.331 million liters of groundwater per day with three bore-wells, and also does not gauge the amount of waste water from its purification process.
Getting past the political and legal bottlenecks, the giant players eventually focus on competitive market forces to carve out their market shares. The competitive pressure is evident from creative market segmentation by global players. These giants apparently look for market opportunities that are lucrative and less sensitive to price competition. Of course, successful branding is the key, unlike most local brands that primarily compete on price. Overall, the bottled water market can be viewed as having three major segments globally based on its key attributes. Even though not all segments can be served in all geographic markets, the major segments are as follows.
This refers to plain water, for everyday and general purpose uses. This is the largest segment in the bottled water industry by volume, and also the most competitive in terms of price and profit. This kind of water is primarily sourced from underground, open source, or regular tap water from public utility system, then processed and bottled through standard methods to make it clean and safe. There is also a rising sub-segment of flavored still water like strawberry, lemon, pineapple, etc. Another important sub-segment could be nutrient-filled still water, containing added nutrients to promote health.
This type of water goes through the process of carbonation. It gives a bubbling feel like carbonated soft drinks when consumed. This can be used as a mixer or consumed just like water with some bubbly feeling in the mouth. This product could be further sub-segmented into flavored or unflavored varieties. Some spring water may be naturally carbonated at its source. In most cases, sparkling water is made through artificial carbonation, after being sourced either from natural spring or groundwater.
Spring water is a segment of still-water which is consumed by people and has gained popularity around the world especially in the developed countries. After processing for safety and taste reasons, this type of water is bottled as picked up from natural springs. Spring water is often differentiated by its source, thus the access to renowned source may give a competitive advantage to such brands. It is highly likely that brands would promote the source in its communication to customers. For example, Perrier collects its water from French Alps. Other brands also have such claims like Veen from a natural lake in Finland, Glaceau Smartwater from a spring in the United Kingdom, etc.
Apart from natural spring water, regular underground water can also be promoted as premium water based on some unique claims like proprietary processing technique and/or specially controlled mineral contents. For example, Coke’s premium brand Glaceau Smartwater is sourced from underground in the United States, but is promoted as premium water based on “distillation” as a filtering process whereas other brands follow “reverse osmosis.” It also adds controlled amount of minerals after distillation to ensure the taste. The same brand uses spring water in the United Kingdom and still follows the process of distillation and addition of minerals, claiming it as a premium spring water brand.
Obviously, different types of water will taste different to consumers. Taste of bottled water may considerably vary based on different chemical compositions. It is to be noted that, the “pure” water does not necessarily mean the chemically purest form of water. On the other hand, in the Indian context, “mineral water” is oftentimes a misnomer because many water brands claiming themselves as mineral waters may actually contain very low level of minerals. Many consumers often find it surprising that distilled water, the purest water devoid of any chemical and particulates, should not be consumed as the only type of water regularly. It may harm the human body by depleting useful minerals from the bloodstream. Before delving further into the case, a short technical note seems necessary at this point.
Three dimensions are to be accounted for while testing potable water quality. These are: microbial aspects, chemical aspects, and aesthetic aspects. Microbial aspect calls for water to be safe from dangerous levels of bacterial presence or other pathogens in the water. Disinfecting treatment, mostly ozone treatment and/or ultraviolet light treatment can effectively remove such threats from drinking water.
The second aspect is the chemical contents of water. Chemical contents and properties of water are checked against a list of certain common chemicals and listed properties. It is to be noted that not all chemicals change the taste of water. Different chemicals can affect water taste differently, whereas some chemicals may not have any significant effect on taste at all. For example, nitrates in water will not change its taste much, although high nitrate content could be harmful to health. On the contrary, not all chemicals are harmful to human health, no matter whether they have any effect on taste or not. High levels of calcium and magnesium content in water (hard water) can significantly worsen the taste of potable water to most consumers, although these chemicals are good for human health. Most harmful chemicals can be removed or reduced to a standardized level through further processing. Chemicals which can change the taste of water can also be controlled through processing.
The third aspect, aesthetics, is concerned with the real taste and appearance of drinking water. The common tests are turbidity test (test of how clear the water is) and physical consumption test to check the real taste by water tasting experts. Yes, just like in wine, tea, and other beverage industries, there are experts who are trained in physically tasting water. This aesthetic aspect is largely influenced by the chemical contents and consequent chemical properties they impart to water.
Different countries regulate chemical contents through their respective laws. Water taste may matter less in these regulations whereas health aspect receives priority. According to “Uniform Drinking Water Quality Monitoring Protocol, 2013,” the government of India has issued directives to follow certain guidelines to ensure drinking water quality across India. The document has referred to the relevant sections of water quality guidelines as contained in standards (IS-10500-2012) adopted by the Bureau of Indian Standards (BIS), the standardization body of India. According to the directives, 13 basic minimum parameters that need to be tested for drinking water quality are pH (acidity/alkalinity level), turbidity (clarity level), total dissolved solids (TDS), total hardness (content of calcium and magnesium), alkalinity, fluoride, chloride, sulfate, nitrate, arsenic, iron, total coliforms, and Escherichia coli.
One important chemical criterion is the total mineral content as dissolved in water, expressed as TDS. The higher the TDS, the more distinct and “heavier” will be the taste of water. Different countries have different standards for TDS. In the United States, TDS should be at least equal to or above 250 mg/liter to qualify as “mineral water.” Bottled water having less than the limit can still be marketed as safe water except claiming it to be mineral water since the total mineral content is below the stated requirement for this category. However, very high level of TDS (like 1000 mg/liter) can adversely affect the taste by making it feel “heavy with aftertaste” in consumers’ mouths. The acceptable limit of TDS is 500 mg/liter both in the United States and India. In addition, Indian standards have a range; for example, whereas the desirable limit is 500 mg/liter, the maximum allowable limit is 2000 mg/liter. Though differences in opinions are plenty, it is usually in the range of 200–300 mg per liter that is supposed to yield a distinct taste as mineral water.
Among these TDS, nitrates should not exceed more than 10 mg/liter (US standards), mostly because of health reasons since nitrates usually do not affect the taste. Some countries may allow higher/lower contents depending on their adopted standards. According to IS-10500-2012, the Indian standard, the maximum allowable limit of nitrate is fixed at 45 mg/liter. The pH level is also important for drinking water quality and aesthetic aspects of water taste. In pH scale, 1.0–6.9 means acidic property, 7.0 is neutral, and 7.1–14.0 means alkaline property. Light alkaline water (pH 7.1–7.5) may confer a “sweet” feeling in consumers’ mouth whereas acidic water (pH <6.5) sometimes may confer a “sour” feeling. The idea is to stay within a range so that the water stays in an aesthetically acceptable state. According to the Environmental Protection Agency (EPA) of the United States, the noticeable effects of a pH level that is less than 6.5 include a bitter and metallic taste. The noticeable effects of a pH above 8.5 include a slippery feeling, soda-like taste, and deposits. The same range (6.5–8.5) of pH level has been adopted for Indian standards (IS-10500-2012).
India is considered among the top 10 countries in terms of bottled water consumption. This is one of the India’s fastest growing industrial sectors. The noticeable trends in the industry includes burgeoning bulk segment (e.g., packaged water in large dispensable jars), new foreign and local entrants, introduction of flavored and nutrient water, and increasing investment and joint ventures in this sector. Due to rising health awareness among citizens, increasing trend in disposable income, and perhaps inadequate public measures to provide safe drinking water, bottled water industry has flourished during the past decade. Perceived safety of bottled water has made its growth in water-scarce areas of India.
Besides these demand side issues, the supply side scenario has also been highly encouraging. The growth of organized retail industry and rising focus on product quality may further encourage healthy competition. It is estimated that the Indian bottled water industry was valued at USD 1 billion in 2013, and has been growing at 15% for the last three years. It is also estimated that the industry will be worth approximately USD 2.67 billion by 2018, growing at a Compound Annual Growth Rate (CAGR) of 22% (valuenotes.biz). Out of this packaged bottled water, the traditional segment of “still processed water” accounts for 85%, while mineral waters (premium waters of spring and other specialized segments) account for the rest.
According to media reports, Parle Bisleri was the market leader with 33% of retail volume sales in 2012. It was followed by PepsiCo (15%) and Coca Cola (13%). Thus, Bisleri (from Parle Bisleri), Aquafina (from Pepsi), and Kinley (Coca Cola) are the three major brands, consisting of 61% of total volume in 2012. The rest of the market is shared by other local brands, some of which may not have been marketed at the national level at all. It was reported that 1-liter bottle has been the most popular one (42%) in the “Still” category. Other versions are 500 ml, 250 ml cup, and a rising segment of small pouches due to cost factors. Table 12 shows the container-wise popularity of bottled water consumption in India:
Brief accounts of major players are provided below to shed light on the competitive scenario of the bottled water market.
Table 12: Container-Wise Percentage of Bottled Water Consumption, 2013.
Bottle |
$$$ |
1 liter |
42 |
500 ml |
20 |
2 liters |
14 |
Cups (250 ml) |
10 |
Pouches |
8 |
Bulk (15–20 liters) |
6 |
Source: Valuenotes.biz (Short Industry Report).
Originally an Italian company, Bisleri was founded in 1965 by Signor Felice Bisleri who started selling the first bottled water brand in India. The water was from a spring called Angelica, near Nocera Umbra, Italy. In 1969, it was bought over by Parle, India. Currently, the company has 18 plants and over 50 contract packers all over India. This has been the oldest bottled water brand in India, having a long-standing reputation for its taste and brand image. Bisleri expanded its market operation in Europe and United States in 2007. The flagship and regular line called “Bisleri” is marketed as mineral water. The TDS level is reported to be around 80–120 mg/liter. It is available in eight pack sizes. The 1-liter bottle is priced at Rs. 18 (as of March, 2014), the same price that other similar brands are offered in the market. Their regular product label still contains the word “mountain” even though it was reported that the regular still water is sourced from underground, whereas only the premium line “Vedica” is sourced from a Himalayan spring. The association of the mountain logo probably stemmed from the historical attachment of Bisleri with the Italian mountain water that might have continued the brand perception.
The premium water “Vedica” is actively promoted as mountain water from a natural spring in the Himalayas. The spring water contains a TDS level of 225 mg/liter that is supposed to give the water an ideal balance of mineral taste. The brand is offered in 250 ml, 500 ml, and 1-liter PET bottles. The 1-liter bottle is priced at Rs. 50, competitive to other similar premium brands like Tata’s “Himalayan.” Bisleri Soda, the carbonated water brand, comes in 600 ml bottle for Rs. 15. However, unlike other soda brands, Bisleri appears to be lagging behind in this segment. Coke’s Kinley Soda water and PepsiCo’s Dukes appear to be leading the soda water segment.
This has been a popular bottled water brand from PepsiCo. Currently, it occupies the second place after Bisleri in terms of market share. It was first launched nationally in 2000 and quickly became popular in the Indian market. It has 19 bottling plants across India and is widely distributed across over half a million outlets. PepsiCo’s key strength appears to be its distribution that might yield some mileage to its market share. In 2003, PepsiCo India entered into a distribution alliance with another fast moving consumer product giant — Hindustan Lever, and chalked out plans to enter the bulk water segment. The distribution agreement helped both the companies utilize each other’s distribution strengths and allowed PepsiCo to access the latter’s institutional customers. Coupling with distribution strengths, Aquafina was made available in smaller sized packs at a lower price, considering the price sensitive still-water segment (300 ml at Rs. 5, launched in 2009). Aquafina is available in various pack sizes like 500 ml, 1-liter, 2-liter, and 25-liter jars. The 1-liter bottle is competitively priced at Rs. 18, like its major competitors. Its sparkling water brand “Dukes” is also competitively offered at Rs. 16 for 600 ml bottle.
PepsiCo has traditionally been away from the premium water market. However, that is about to change in 2014 when the company launched “Qua” in a special designer bottle in the United States. The main reason behind popular still-water brands entering premium segments is their ability to fetch better profits in relation to the highly price-competitive regular still-water segment. It is expected that the brand would gradually be rolled out worldwide, although it is not certain when the Indian market will be served, if at all. The “Qua” from PepsiCo should not be confused with another premium spring water brand named Qua in India since 2008, owned by the joint venture between Narang Group and Danone. PepsiCo’s premium claim is based on special micro-filtering process and zero sodium content of the brand. Industry experts suggested that the introduction of this premium brand is actually in response to Coke’s recent entrance in the United Kingdom into the premium water segment with the brand called Glaceau Smartwater. Although Coke’s Smartwater was introduced in the United States in 1996, its cautious move worldwide is noteworthy, particularly its introduction in the United Kingdom in 2014 highlighting its spring-sourced water. The original brand “Smartwater” as marketed in the United States is sourced from underground. The brand grew well in the United States and has apparently been successful in capturing over 45$$$ of the premium market segment.
It is already evident that there has been a technical difference between “Glaceau Smartwater” and “Qua,” even though it may not matter much to customers’ perceptions in terms of branding. Glaceau Smartwater is made from spring water in the United Kingdom, vapor distilled and then fortified with added minerals to ensure a crispy taste. However, it is mostly made from groundwater in the United States and then follows the same processing technique to enhance taste. On the other hand, Qua has been using underground water all through, processed and mineralized for a premium taste. Thus Qua is more similar to Smartwater in the United States than Smartwater in the United Kingdom. The real difference can still be made depending on how companies can project a distinguishable image in the minds of customers. For example, the most common feature of premium bottled waters has been its packaging. Premium water brands are mostly packaged in fashionable glass bottles, giving them a level of sophistication and heavy feeling when held in the hand as compared to handling light PET bottles. However, recent trends show otherwise. Coke’s Smartwater is bottled in crystal clear PET that gives a glass-like look, yet handy and light to carry as well.
From the house of Coca Cola, there emerged two brands of regular still water named Kinley and Dasani. Kinley is actively marketed in India, whereas Dasani is not. Some experts suggested that though Dasani may not confer any meaning in Hindi, yet the brand name sounds more “local” in India. Thus, to maintain a perception of sophistication and a foreign image of its water brand, Coke probably chose to promote Kinley instead of Dasani.
Kinley is sourced from groundwater and then processed according to its specification. After being launched nationally in 2000, the brand went through a major repositioning in 2008, projecting its “clear” and “pure” image by highlighting the easy-to-hold blue bottle with transparent labeling. Nielsen retail data showed that, Kinley’s market share went neck-to-neck in 2009 with that of Bisleri, thus becoming a major player in the Indian bottled water market. However, more recent data show Kinley in the third position after Bisleri and Aquafina. Bisleri asserted that they are still the lead player since Nielsen does not report the bulk segment (packaged water in large jars) where over half of Bisleri’s sales come from. The 1-liter bottle is offered at a price of Rs. 18, the same price that its major competitors offer. Kinley also competes in carbonated water (soda water) category, with its 600 ml pack offered at Rs. 16.
Unlike its arch-rival PepsiCo, Coke has not been shy of premium water brands. Coke introduced Smartwater in the United States in 1996, a premium brand that appears to be successful in its target market. It entered the UK market in 2014 amid a growing premium segment. It is not certain whether Smartwater would be rolled out to India in near future. Unlike other premium brands packaged in glass bottle, Smartwater is bottled in designer PET bottle in 600 ml and 1-liter size.
Apart from competition among these three major players, there are other significant developments in the bottled water market in India. Nestle, the global competitor in the bottled water market, entered India in 2001 with its PureLife brand. Sourced from underground and processed for purity and taste, the company offered the brand at a premium price in a market where Bisleri, Kinley, and Aquafina were already fighting for their shares. However, due to competitive pricing of other three brands at Rs. 10 for a 1-liter bottle at that time, PureLife found it difficult to sell at Rs. 12 per liter in this price sensitive segment. The emphasis of grocery stores as distribution outlets also appeared to be a disaster. In India, consumers visit the grocery stores to purchase household consumption items, whereas the 1-liter bottles are bought on the go. Nestle also stayed away from the burgeoning 20-liter jar segment for household consumption that resulted in its poor market share. Facing losses for a couple of years, Nestle finally withdrew from the Indian market in 2003. Another project by Baroda Dairy, one of the makers of Amul products, to bottle processed water from Narmada River did not do well with consumers’ emotion. The Narmada is considered one of the five holy rivers in India. Launched in 2009, the project was considered uneconomical after running for two years. In 2011, the company decided to ground the project. However, in 2012, the company changed the decision to relaunch the brand after certain makeovers.
Despite stories of failure and bottlenecks, new competitors are not shy to enter the bottled water market in India. Sometimes competition may stem from players who were never thought of entering the bottled water segment. For example, the household water purifier appliance maker Eureka Forbes planned to enter the bottled water market with the brand Aquasure. Tata Global Beverage and PepsiCo’s joint venture, Naurish Co, also planned to enter the niche market of nutrient water with their brand “Tata Water Plus,” to be priced at Rs. 16 for a 750 ml PET bottle.
They also have a premium brand called Himalayan that contains premium spring water from the mountain of the Himalayas. Due to its joint venture with PepsiCo, Himalayan can easily be distributed through PepsiCo’s distribution assets. The brand appears to be a strong challenger to Bisleri’s Vedica. Apart from these new entrants, there are also established importers and distributors (like Narang Group) who deal with imported premium brands like Perrier and Evian. However, their marketing focus is limited to the upper-end urban segment, targeting luxury hotels, social clubs, and selected general stores in urban residential areas.
There are also distant competitors of bottled water brands, like household water purification appliances. Hindustan Unilever’s Pureit can purify tap water at a cost of Rs. 1.00 per liter, that appears to be a potential threat to the growth of bulk water jars. Other appliance makers like Eureka Forbes and Kent are engaged in active promotion and expansion of their businesses in India.
Amid this competitive backdrop, premium water brands are trying to carve out their market niche with brands like Bisleri’s “Vedica,” Tata’s “Himalayan,” Nestlé’s “Perrier” (carbonated), and Danone’s “Evian.” Their premium pricing stands at Rs. 50 for Vedica and Himalayan (1 liter each), Rs. 300 for Perrier (750 ml), and Rs. 350 for Evian (1 liter). Except for premium carbonated brand Perrier, all premium brands are bottled in PET packages. Nestle and Danone are not directly involved in marketing their premium water brands in India, rather the Narang Group imports and distributes these brands. Narang Group has entered into a joint venture with Danone to produce “Qua,” a premium water brand. The brand is offered at Rs. 50 for a liter bottle (as of May, 2014). It appears to be a promising brand that may become a major premium player in future.
The latest entrant in this growing urban segment is “Veen” from Finland. The original source of Veen water has been the Finnish spring situated at Lapland, Finland. The water is low in TDS (about 17.22 mg/liter), giving its light, clean, and tasteless characteristics. Others argue that low TDS may yield a clean taste of water, but may be open to debate whether low TDS is good for health or not. In fact, the regular still-water brands (like Aquafina and Kinley) contain even lower TDS (in a range of 5–12 mg/liter) than most other high-end brands. However, the water marketed by Veen in India is not from the Finnish spring, but from an Indian spring that the company claims to have very similar and comparable water quality. In fact, sensing a growing and lucrative niche market in India, it ventured into its second and third regional sources. The second source is a natural spring in Nilgiri Hills in Tamil Nadu, India, and the third source is located in a terrain of mountains in Bhutan. The Indian source will bottle Veen products to cater to the Indian market and also for export within the subcontinent, whereas the Lapland source will continue to bottle for existing markets of Europe, UAE, Qatar, Singapore, China, Russia, and the United States.
Veen entered India in 2012 with its second source of spring water in Tamil Nadu. With much fanfare and aggressive public relations in 2014, targeting to spread over 20 major cities in India, Veen appears to have made a significant commitment to the Indian premium bottled water market. It is to be noted here that Veen initially targeted institutional buyers like premium hotels and restaurants, and not retailers. Veen is known for its 660 ml specially designed glass bottle that won a number of design awards. The bottle is slightly dented at the bottom to allow placing one’s thumb in and has two rims on one side so that index and middle fingers can fit in. Consequently, the water can be served in a way that champagne is meant to be served, giving the brand a subliminal prestige signal. The brand name is embossed on one side of it, and contains a stopper that almost resembles that of “Absolut” Vodka. It has been reported that it costs around Rs. 45 to produce this specially designed glass bottle. The size of the bottle (660 ml) is based on research findings on how much water is usually consumed by two persons when they sit for a meal.
Historically, Veen has followed a premium institutional strategy to market its products. It has been the “official water” of F1 lounge in London for four consecutive years since 2011. It also has partnerships with Arsenal Football Club and other specialty sports clubs in the United Kingdom. Similarly, Veen water has been initially targeted at institutional customers in India, particularly high-end hotel chains, restaurants, and coffee shops. The brand has already formed agreements with Marriott and The Lalit Hotel chains in India. Offered in two varieties — Veen Velvet (still water) and Veen Effervescent (carbonated water), both varieties are placed at the same price point. The 660 ml bottles are offered at Rs. 110 and 330 ml bottles are offered at Rs. 77. The price appears to be much higher than Vedica and Himalayan; however, given the Finnish tag and high-end institutional buyers in its portfolio, the price may not appear to be a barrier in the long run.
Alongside its special glass bottle, Veen is planning to pack in premium designed PET bottles as well. PET bottles will look exactly like its glass version. It is reported that a third source in Bhutan will be used to pack two new brands in PET bottles — Veen Still (premium still water) and Veen Classic (premium carbonated water), specifically targeting the Indian retail market which could be a real testing bed for Veen in India since they never played in the retail market before. The new brands will be available in 750 ml and 550 ml bottles. It is expected that the premium water in PET bottles would have a potential market in India, China, Russia, and UAE. Currently, the 750 ml is priced at Rs. 60 and the 550 ml is priced at Rs. 40 for the Indian market, a price that is much lower than the price of its glass-bottled version. Although smaller in size than its competitors’ brands — Vedica and Himalayan, this PET version of Veen may become a potential threat to its competitors.
Veen’s interest in the Indian market is also evident from its creative promotional campaign. It went for attracting media to interview its CEO, maintaining sufficient news coverage of its activities since 2012, and promoting top Indian chefs through Veen Connect program. Veen Connect is a unique promotional program that offers exchange of prominent chefs among top hotels and restaurants around the world. Top chefs cook their signature dish in their visiting restaurant and the event is publicized well ahead of time. This creates an ambience of excitement and novelty among food connoisseurs who wait for the guest chef to cook the publicized signature meal.
It appears that Veen’s introduction to the Indian institutional market has been smooth and without trouble so far. Launching two brands in retail markets could be risky for Veen at this moment, though the political and legal bottlenecks have been low for premium spring water brands. Will Veen survive and thrive in its premium institutional segment? Will retail consumers accept Veen as a premium priced spring water? How would other premium brands respond to this new competition? While marketers will be looking for answers, India’s premium water market is surely heating up more than ever before.
1. Identify the central issue of the case.
2. In terms of three types of bottled waters, develop a matrix by showing types of water horizontally, and put parent companies vertically. Place their respective brands in each box in the matrix with prices of 1-liter bottles or smaller size if 1-liter bottle is not offered. What does this matrix tell you about price competitiveness of the brands?
3. From the matrix developed in question 2, if you find any price discrepancy in similarly positioned brands, how would you develop unique selling propositions to justify and position the higher priced brand in consumer minds?
4. Identify the PEST factors for Veen based on the information given in the case.
5. Do you support Veen’s decision to enter the retail market? Support your position with reasoning based on the information given in the case. Explain your assumptions, if any.
The case focuses on the market entry of a Finnish premium bottled water brand Veen in India, and deliberates on competitive forces that may shape future competition in this segment. The premium water segment is still a niche market in India; however, it is expected to grow in line with the rising affluent urban segment across major cities. Veen has been served in premium culinary environment, for example, upper-end hotel chains, restaurants, and premium coffee shops globally. Initially, this has been the case in India also, where the brand targeted the similar institutional customers when they entered the market in 2012. Veen planned to launch two new brands in PET bottle in 2014, unlike its traditional glass bottles, targeting the Indian retail market. It appears that the brand has long-run competitive commitment to the Indian premium water segment.
Answer guide Q1:
The case focuses on Veen’s entry into the Indian premium bottled water segment, targeting both institutional and retail customers, and talks about strategic forces that would shape the competitive scenario of the brand.
Answer guide Q2:
The matrix may look like as follows:
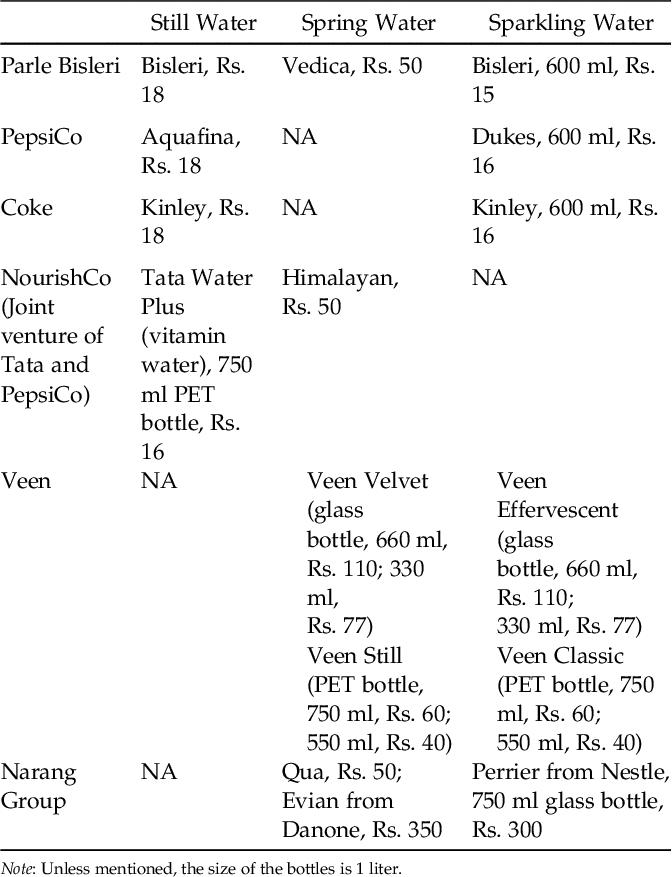
The table shows that the 1-liter still bottles are price competitive across brands, offered at Rs. 18. Bisleri soda appears to be little cheaper than Kinley and Dukes brands. Spring water brands seems to be price competitive among local premium brands and less expensive than foreign brands. Veen glass bottles appear to be cheaper than imported brands; however, their PET version is still more expensive than premium local brands.
Answer guide Q3:
It appears that imported foreign brands are expensive compared to other local competitors. These brands must have developed a high-end premium niche based on upper-end institutional buyers. Veen glass bottles appear to be cheaper than imported foreign brands, yet their PET version is more expensive than local premium brands. Since they targeted the upper-end institutional buyers as well as affluent segment of the market, price may not matter much when compared with its image. Therefore, the unique selling proposition should be based on image differentiation linking to Finnish tag and comparable water quality to their European source.
Answer guide Q4:
Instructors may also ask students to develop a SWOT analysis based on PEST analysis, if time permits. Students are expected to elaborate PEST factors based on the case. The major PEST factors are indicated below, which may be further elaborated:
(i) Political factors: It is mentioned that the government is taking the initiative to produce bottled water under state transport corporations. However, it might not affect the premium water category since the government will be investing in producing regular still water. The regulatory matters also need to be counted since many companies experienced bottlenecks in this regard. Cooperation with the local authority and image management to general public also appear to be an important factor in the political scenario.
(ii) Economic factors: India has a growing economy with a rising affluent urban segment that would offer an attractive market for premium bottled water.
(iii) Social factors: The rising affluent segment may confer some signs of lifestyle changes regarding consumption of bottled water. The safe perception of bottled water may yield a lucrative market for premium water brands.
(iv) Technological factors: It appears that technological requirements can be met by the current players. In addition, the “unprocessed” premium spring water products do not even need high-tech processing for purification. Therefore, technological bottlenecks may be low for premium brands.
Answer guide Q5:
The question can be approached by either supporting or opposing the decision, depending on how the student is justifying his/her deliberation. An argument in favor of entering the retail market will look into the current competitive scenario since all of Veen’s competitors are already in the retail market, perhaps indicating a viable retail market for premium spring water brands. Therefore, even though the retail market is new for Veen, it is not less promising at all. The withdrawal of earlier brands like PureLife due to pricing issue and other bottlenecks as mentioned in the case may not be relevant to Veen because the brand is not competing in the regular water segment. Pricing may not be a problem in the retail market as the brand is targeting upper-end consumers. In addition, it has been historically observed that premium water brands faced less regulatory and political attention from different quarters, thus leaving them a comfortable breathing space.
On the other hand, arguments opposing Veen’s entry into the retail market should concentrate on the company’s hurried focus on both the retail and institutional markets, where the brand has not yet established a strong foothold. Though the regulatory and political bottlenecks have been low for premium spring water, entering a completely new market may exert extra stress and uncertainty on the company’s future. The main argument opposing the entry may not actually against the entry decision itself, but against the timing of the decision simultaneously with the institutional entry. It may be stressed that the company might want to consolidate and win a loyal base of institutional customers first, and then it may move into the retail sector.