
Syed Saad Andaleeb and Khalid Hasan
We do not know a truth without knowing its cause.
—Aristotle
In this chapter, we will explore the need and importance of market information and insights gathered from the consumers, marketplace, and other stakeholders. Since research is essential to understand the overall market scenario, this chapter highlights the scientific process for conducting research using both quantitative and qualitative methods. The text is followed by real-world examples to familiarize readers with key concepts and terminologies of marketing research.
Marketers need to gather intelligence and information on a variety of elements: the marketing environment (addressed in Chapter 2), for strategic planning and marketing (Chapter 3), the industry as a whole, and especially about consumers (Chapter 5) — their knowledge, attitude, behavior, and practice (KABP) regarding a product or service. Information is critical for making business decisions at any stage such as pre- or post-launching of products and services, as well as monitoring specific market responses. For example, monitoring customer satisfaction with Grameen Phone’s services in Bangladesh or post-launch performance of Radhuni Biriyani Masala by Square Food & Beverage Ltd., Bangladesh, can provide rich dividends.
Similarly, social scientists or academics may be interested in knowing about the impact of any promotional campaign or intervention on social issues, such as HIV/AIDS, immunization, violence against women, or climate change adaptation.
According to Kotler, Armstrong, Agnihotri, and Haque1 “marketing research is the systematic design, collection, analysis, and reporting of data relevant to a specific marketing situation facing an organization. It gives marketers insights into customer motivations, purchase behavior, and satisfaction. It can help them to assess market potential and market share or to measure the effectiveness of pricing, product, distribution, and promotional activities.”
The different roles of marketing research are exploratory, descriptive, causal, diagnostic, predictive, inductive, and deductive.
• Exploratory research involves gathering preliminary information to define and understand the problem faced by the marketer. It is used for designing or planning comprehensive research projects. Occasionally, it may be used for making quick business and strategic decisions, especially when time for a longer study is simply unavailable.
• Descriptive research focuses on assessing marketing problems, conducting situation analyses, profiling consumers, etc. It attempts to determine the “who, what, where, when, or how much” related to the research questions. It describes existing attitudes and behavior toward specific products or services; it also carries out trend analysis and forecasting. Various surveys such as consumer research and opinion polls are also descriptive in nature. Descriptive research may be cross-sectional or longitudinal in nature. It can help researchers obtain sales trends in the industry, market potential for a product, consumers’ attitudes, demographic profiles, and so on.
• Causal research tries to explain relationships among different variables and how they impact each other. Finding cause-and-effect relationships through testing of hypotheses is in the realm of causal research.
• Diagnostic research investigates the relationships and phenomena within data. Diagnostic research may be used to pinpoint the root cause of any problem impacting the growth and sustainability of particular products and services in particular market segments.
• Predictive research seeks to measure and forecast the likelihood that something will change in the situation, condition, or behavior relative to a known baseline. For example, predicting how income influences propensity to purchase digital products.
• Deductive research is a reasoning process starting from a theory followed by preposition of hypothesis pertaining to the research questions, and finally tested through empirical data. The entire process begins with a self-evident principle that reaches a conclusion relating to a particular case.
• Inductive research process starts from an examination of empirical data, leading to deeper analysis and insights, which finally helps in developing a conceptual framework and/or model.
Researchers try to gain a better understanding of the situation or problem facing the firm. The research purpose helps bring focus on the study and formulate the research design, leading to completion of the research study. This first step involves:
• Problem identification/statement
• Delineating research objectives
• Stating research hypothesis
• Defining the scope of the research study.
The research design is an overall map of conducting the project, which addresses the research problem, question, objectives, and/or hypothesis. It guides researchers to the subsequent steps in the research process. The key considerations at this stage include:
• Exploratory, descriptive, or causal research.
• Will data be based on primary and/or secondary research? Primary data can be:
 Qualitative — includes focus group discussion, in-depth interviews, observations, case study, PRA/RRA (participatory rural appraisal, also known as rapid rural appraisal).
Quantitative — includes survey, experimentation, observation, retail audit (e.g., Nielsen retail audit).
• Time needed.
• Costs involved — budget for the project.
This involves design of questionnaires, focus group guides and/or depth interview/observation checklists. The marketing researcher must be cognizant of the principles of measurement and related scale construction methods employed in gaining insight from customers. More about this topic is presented subsequently.
It involves selecting respondents or objects of interest (packages, retail stores, etc.) to the researcher from a population by determining whom to sample, sample size, and selection process (probability and non-probability). Sampling is conditioned by the following (among others):
• Geographic location — rural, urban, metro, etc.
• Demographic characteristics — education, gender, income, occupation, age, etc.
• Psychographics — personality, values, opinions, attitudes, interests, and lifestyles.
This is a critical part of research. The methods employed for data collection depend on the research design. For example, in survey research, data are collected through personal interviews (also called as face-to-face interviews), online using a website or e-mail, telephone interviews, and mail surveys. Currently large research agencies, such as Nielsen or Millward Brown, use “HHT- Hand-held Terminal” devices or mobile phones/tabs for ensuring quick data collection and transference for data processing. Important considerations in this phase involve:
• Quality control mechanisms during data collection and include checking by the supervisors, spot check and postsurvey check.
The raw data need to be converted into meaningful information. Data processing starts after data collection, which includes data coding (for open-ended questions), data entry, and table generation. Different software (FoxPro, Quantum, or Excel) are used for data entry and processing. Advanced analysis is conducted through statistical packages like SPSS, Minitab, Stata, etc.
This is the final stage of any research project. The purpose is to prepare and present the research findings to other researchers and/or sponsors. The report contains several chapters based on the purpose and requirements; however, its basic contents are background, methodology, findings, conclusions, and recommendations. In many cases, the findings are presented by using specialized software (e.g., PowerPoint, Prezi, etc.).
Data or information may be collected from two basic sources: secondary and primary. Currently, the new era of Internet has become a powerful portal for a variety of published or unpublished information.
Secondary data are data previously collected by other researchers for a specific purpose and the findings/reports are published or publicly available.
• Save time and money
• Aid in providing direction for primary data collection
• Help design similar research studies (e.g., pinpoints people to approach)
• Serve as a basis of comparison for other data.
• May not give adequate or required information
• May not match entirely with the research requirements
• Quality and accuracy of data may be questioned.
Information collected for the first time and used for solving the particular problem under investigation.
• Answers a specific research question
• Data are current
• Source of data is known
• Privacy can be maintained.
• Expensive due to translating language and meaning (coding)
• Sometimes respondents are reluctant to answer lengthy interviews
• Sampling challenges and data gathering difficulties (especially during political opinion polls).
Primary data are collected in a variety of ways and are broadly categorized on two dimensions: qualitative and quantitative research. After distinguishing between the two approaches in Table 1, the remainder of this chapter elaborates some of the more typical approaches used in these two broad dimensions.
Table 1: Difference between Quantitative and Qualitative Research.
Feature |
Qualitative |
Quantitative |
Type of research |
Exploratory |
Descriptive/causal |
Focus of research |
Understand and interpret |
Describe, explain, and predict |
Sample size |
Small |
Large |
Sample design/sampling |
Non-probability, purposive |
Probability |
Research design |
May adjust during the course of the study |
Finalized before launching the study |
Types of questions |
Unstructured |
Structured |
Type of analysis |
Subjective, involves researchers deeper qualitative involvement |
Objective, statistical, computerized analysis |
Generalizability |
Limited |
High |
Ontological orientation |
Objectivism |
Constructionism |
Epistemological orientation |
Interpretism |
Positivism |
Source: Cooper and Schindler (2011),2 Bryman (2004).3
QUALITATIVE RESEARCH
Business managers and/or academic researchers usually conduct research to understand two important questions — how and why things happen. For example, to know about the prevalence of specific skin care products approved by dermatologists in South Asia, if a marketing manager wants to know about usage rates, type of product preferred, and which demographic group uses the product most, the answers would be easily obtained through a quantitative survey. However, the manager is unlikely to understand deeper issues by delving more deeply into people’s hidden interpretations, understanding, perceptions and motivations, and most importantly, the forces that drive behaviors. These answers are better obtained through qualitative research.
Qualitative research may be defined as a research strategy that emphasizes description and interpretation rather than quantitative measurement, hypothesis testing, and statistics in the collection and analysis of data. Van Maanen4 defines qualitative research as “an array of interpretive techniques which seek to describe, decode, translate and otherwise come to terms with the meaning, not frequency, of certain more or less naturally occurring phenomena in the social world.” Cooper and Schindler2 suggest that qualitative techniques can be used at both data collection and data analysis stages of a research project. At the data collection stage, the array of qualitative techniques may include focus group discussions, in-depth interviews, observation, and case studies. Some of the qualitative research approaches are ethnography, grounded theory, and action research.
During analysis, qualitative researchers may use written or recorded materials drawn from personal expressions by participants, researcher’s observations, and debriefing of participants. The study of artifacts and traces of evidence from the physical environment may also be qualitatively interpreted. Qualitative research is best suited for understanding the consumer’s “language” or the “voice” from which his/her feelings, emotions, values, or perceptions are extracted but not quantified. Qualitative research methodologies have roots in a variety of disciplines such as anthropology, sociology, psychology, linguistics, communications, economics and semiotics.2 However, currently, market researchers have begun to draw heavily upon qualitative research findings to complement hard, quantitative data. Combining quantitative and qualitative findings often provides better information and deeper insights for decision-making.
Individual depth interviews usually involve one-on-one interviews. Since depth interviews are conducted for deeper understanding of the research issues, experienced and highly skilled researchers or interviewers are usually involved. Generally, the IDI takes from 30 minutes to a few hours to complete depending on the issues of interest. The interviews may be face-to-face, through telephone, or the use of technologies like Skype. The interviewees are provided with a discussion guide, related materials, and relevant documents well in advance. The guides are open-ended and structured so that interviewees can share and express their feelings and opinions freely by going deep into the issue/topic of interest. Usually, with the permission of the participant, the IDI is recorded, which is later transcribed verbatim, meaning that all views, sounds (e.g., umm’s and, ah’s, u-hu, laughter), and pauses will be documented. Different types of in-depth interviews are widely used and include the following:
Oral history is a narrative through which the participants share their personal experiences, attitudes, perception, and feelings related to the issues/topics. Oral histories are the same as life histories that are restricted to certain periods or events. Here, the participant shares his/her life history, often focusing only on a particular period such as childhood, adulthood, or a particular slice of life. Sometimes it takes a few days to complete life history interviews.
Sequential interviewing is where the participant discusses an anticipated series of activities in a chronological manner that happened in the past and was experienced personally. Researchers use this technique for understanding shopping behavior, designing a store, or building service infrastructure such as airports, hospitals, and entertainment spots. Many in-depth interviews involve multiple sessions, depending on the objectives and nature of the research.
Ethnography is conducted in a field setting. Ethnographic research is found to be very effective for market research involving product design, segmentation and positioning, or designing advertising and communication campaigns. Ethnography relies on interviews, observations, prolonged engagement, or even Internet-based research, a situation termed Netnography (details in Kozinet’s book).5 According to Arnould and Price, the goal of ethnography is to uncover unarticulated desires among consumers through a process of immersion in their lives.6
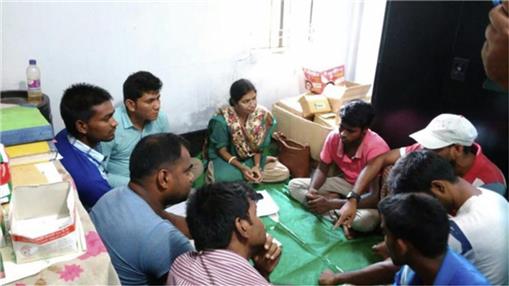
Focus groups are one of the most popular and widely used qualitative techniques, both in social science and market research. It is popularly known as Focus Group Discussion or FGD. Typically, there are around 6–10 participants in each FGD, led by an experienced and skilled moderator. The moderator follows a guide and takes 90–120 minutes to complete. The participants often sit in a circle or round table setting with equal opportunity provided to all the participants to speak. The moderator is sometimes assisted by a scribe or note taker to keep track of the records during the discussion. More often, with the permissions of the participants, the FGDs are tape/video recorded or observed by the experts through a one-way mirror or CCTV cameras.
A sequence for an FGD might include:
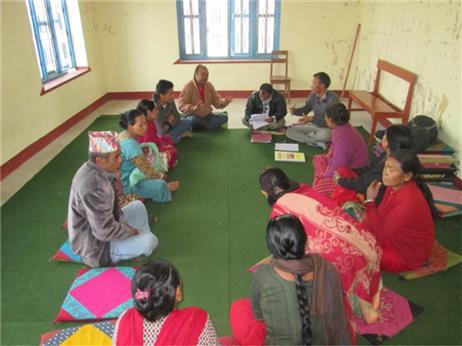
• Self-introduction — introduction of the participants and the moderators
• Warm-up — the moderator starts with creating a warm-up situation such as purpose, equal opportunity and right to express, nothing right or wrong to share their views, open, and ethics
• Discussion — getting into the main discussion
• Sum-up — summing up of the discussion.
In addition to location- or venue-based FGDs, they are also conducted through telephone, online, and video conferencing.
Participatory rural appraisal (PRA) is an approach widely used by social researchers, especially for non-government organizations (NGOs) and international organizations such as the United Nations (UNDP, ILO, Unicef, UNFPA, etc.), World Bank, CARE, or other agencies involved in development activities concerning poverty alleviation, health care, nutrition, or education. The approach aims to incorporate the knowledge, attitudes, opinions, behaviors, and practices of the rural people in the planning and management of development projects and programs. PRA is also known as Rapid Rural Appraisals (RRA). The techniques leading to data collection include:
– Group dynamics — learning contracts, role reversals, feedback sessions
– Sampling — transect walks, wealth ranking, social mapping
– Interviewing — focus group discussions, semi-structured interviews, triangulation
– Visualization — Venn diagrams, matrix scoring, timelines.
Case studies are sometimes effective tools of qualitative research, used to understand specific phenomenon experienced by any individual, group, or organization. The case may typify success or failures of any entity that occurred at a point in time or over a longer period. It is often used in conjunction with the critical incident method in which participants are asked to describe instances of, for example, especially good or bad health service experiences. In case studies, participants describe or explain situations in which they made a decision or solved a problem. However, problems of telescoping, selective perception, and social desirability make this method inferior to observation, shop-along, and participant observation. The researcher often disguises the case for privacy reasons.
Thomas offers the following definition of a case study: “Case studies are analyses of persons, events, decisions, periods, projects, policies, institutions, or other systems that are studied holistically by one or more methods. The case that is the subject of the inquiry will be an instance of a class of phenomena that provides an analytical frame — an object — within which the study is conducted and which the case illuminates and explicates.”7 A case study, also known as a case report, is a descriptive, exploratory, or explanatory analysis of a person, group, or event.8,9 Many qualitative researchers also establish criteria and try to fit the case within the set criteria which is termed as “prospective case.” There are retrospective cases where the researchers establish criteria for selecting cases from historical records.
Observation is another tool of qualitative research. Ethnographers widely use the observation technique to understand the behavioral issues and aspects related to the topics of interest. It involves visual, aural, olfactory, gustatory, and tactile occurrences of certain practices in situ. Researchers engage in observing something or someone carefully in order to gain insights. Cooper and Schindler suggest two broad types of observations — behavioral and non-behavioral:2
• Nonverbal analysis — includes body movement, motor expressions, and even exchanged glances.
• Linguistic analysis — includes the process of interaction between two persons of groups, use of words during conversation (such as “you know,” “wow,” “yah,” “so,” or any other annoying or nice words).
• Extra linguistic analysis — includes vocal (pitch, loudness, and timbre), temporal (rate of speaking, duration of utterance, and rhythm), interactional (tendencies to interrupt, dominate, or inhibit), and verbal stylistic (vocabulary and pronunciation peculiarities, dialect, and characteristic expression). Kendon refers to gestures as an extra linguistic approach popularly known as Kendon’s Gesture10 where ‘visible bodily actions’ are intimately seen in the activity of speaking or maybe in association with speech or separately from it. A person usually transforms his/her expressions into symbolic or linguistic forms or often alters his/her own gestures frequently.
• Spatial analysis — shows how a person relates physically to others, organizes the territory about them, and maintains discrete distances between themselves and others.
• Record analysis — involve historical or current records, public and private, such as written, printed, sound-recorded, photographed, or videotaped. This is also known as “archival research.”
Projective techniques are used to understand the hidden or suppressed meanings of particular research issues. Some of the most used techniques include:
• Word or picture association — in any group discussion or IDIs, researchers may ask any participant to match his/her understanding, experiences, perceptions or emotions about the research topics being investigated. For example, “If someone asks you to explain about ‘doctors’ or ‘hospitals’ what comes to your mind?”
• Sentence completion — researchers provide incomplete sentences and ask the participants to complete it based on their understanding, experiences, perceptions, or emotions. Thus, the researcher offers a “clue” to the participants as in “Chinese food is generally very …” or “Lux soap is usually chosen because ….”
• Personification — Researchers sometimes ask the participants to imagine any inanimate object and fit that with the character, traits, demographics, and/or personalities of a human being; for example, “if the Lux brand of soap was a person, what type of person would it be?”
• Cartoons — Researchers employ ambiguous cartoons and then ask the participants to complete a bubble attached to a character in the cartoons; for example — in a drawing of a boy and a girl standing in front of a fast food restaurant “What are these people saying?”
• Imagination exercises — The participants are asked to relate a product, brand, person, or organization with another entity; for example, “if your college was a car, what type of car would it be?”
• Semantic mapping — A four-quadrant map is presented to the participants where different variables (such as brands, product components, or organizations) anchor two different axes (X and Y); the participants then spatially place these variables within the four quadrants. Thereafter, a discussion can ensue.
QUANTITATIVE RESEARCH
In broad terms, quantitative research may be described as the collection of numerical data and as exhibiting a view of the relationship between theory and research as deductive, a predilection for a natural science approach, and as having an objectivist conception of social reality.3 It measures consumers’ knowledge, opinions, attitudes, and behavior and, therefore, attempts to obtain precise answers for questions such as how much, how often, how many, where, when, and who.
Quantitative research acts on:
– Converting observations/responses to numbers;
– Testing of hypotheses using statistical tests and providing chants, bar-graphs, etc.
– Describing relationships among variables quantitatively, that is, using mathematical formulas and models.
Surveys are quantitative methods of data collection, usually interviewing a large number of respondents. The sample size is calculated by using statistical formula having different confidence levels, set by the researcher. Opinion polls and surveys are carried out by marketers and social researchers to collect data on specific problems/issues.
Observations can represent quantitative methods of data collection as in the case of traffic count, types of brands selected from store shelves, or types of consumables discarded in office trash. Observation research can involve unobtrusive observations of consumers as they shop or consume certain products or brands. It represents the full range of monitoring behavioral and non-behavioral activities and conditions (including record analysis, physical condition analysis, physical process analysis, nonverbal analysis, linguistic analysis, and spatial analysis).2
Experiments are deemed as the most scientifically valid research designed to capture cause-and-effect relationships by eliminating competing explanations of the observed findings.11 In simple terms, experiments involve selecting matched groups of subjects, each group exposed to different treatment conditions while controlling for extraneous variables, and determining whether the groups differ statistically in their response patterns. This is a vast area of research methodology that can be gleaned from Roger Kirk, as well as Geoffrey Keppel & Thomas Wickens among others.12,13
Questionnaires: Questionnaires are used to conduct interviews with respondents to elicit quantitative or qualitative data. There are different forms of questionnaires such as open-ended, closed-ended, dichotomous, and multiple choice types. A questionnaire represents a formal set of questions designed to obtain required information from targeted respondents. Examples are shown in the following box:
Form/Type |
Questions |
Open-ended: provides no structure for a response and the respondent can answer freely |
What was your post-purchase experience with your Samsung mobile? Please elaborate Or “I had a positive (or negative) experience with my Samsung mobile because …” |
Close-ended: the possible answers are given and the respondent will select from those options |
What is your opinion about Samsung mobile phones which you bought recently? – Good – Average – Bad |
Close-ended (dichotomous): measures questions that offer two mutually exclusive and exhaustive alternatives |
Would you buy a Samsung mobile phone again? – Yes – No |
Close-ended (multiple response) |
Which attribute(s) did you like most? (Multiple response possible) – Size – Color – Touch feature – Message – Internet, etc. |
Scaled-response |
|
Nominal scale |
Please give your preferred response with a “tick mark” in the appropriate bracket below. “You are fluent in … English [ ] Bangla [ ] Hindi [ ] Urdu [ ] Tamil [ ]” |
5-point scale or other scale (Likert 5-point scale named after Rensis Likert is widely used for measuring attitudes or affect) |
Please rate your agreement with the following statement where Strongly agree is 5 and strongly disagree is 1. I will buy Samsung mobile in future too. Strongly Agree (5), Agree (4), Not Sure (3), Disagree (2) and Strongly Disagree (1) |
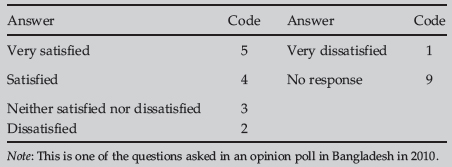
Example of using 5-point scale (5 being very satisfied and 1 being very dissatisfied):
Q: How satisfied are you with the performance of the present government? (Single response) [do not read the answer]
Objectives for a questionnaire: Experienced researchers suggest that a questionnaire must meet the following objectives:14
• It must translate the researcher’s questions into specific questions that respondents are willing and able to answer.
• It must encourage respondents to participate in the survey without making excessive demands on them (e.g., too long or complicated questionnaire) that can bias their responses.
• It must minimize response errors both from the respondents’ side as well as from the data collector’s side. These can range from imprecise wording to inaccurate answers, incorrect recording of data, faulty analysis of the responses, etc.
• It is important to consider the method of administration (face-to-face, telephone, mail, etc.) when designing questionnaires.
Question content: While developing a good questionnaire, the researcher should address the following points:2
• Purposeful or interesting — should this question be asked?
• Incomplete or unfocused — is the question of proper scope and coverage?
• Double-barreled question — does the question seek more than one answer?
• Precision — does the question ask precisely what we want and need to know?
• Can the respondent answer adequately, considering time for thought, accuracy, presumed knowledge, recall, and memory decay, objectivity?
• Sensitive information — will the respondent answer willingly?
• How is the question worded — unbiased, clear, explicit, and concise?
• Is it a leading question?
• Proper sequence/framing.
• Consider the use of appropriate scales (nominal, ordinal, interval, and ratio) depending on the type of analysis contemplated (simple descriptive to complex interactive regression models).
Interviewer errors: There are possibilities of introducing errors from the beginning to the ending of the interview. The major sources of errors may be sampling errors or response biases caused by the following actions:
• Sampling error — wrong selection of the respondents; errors in sampling
• Non-cooperation from the respondents — interviewer fails to secure full cooperation from the respondents
• Data recording error — the interviewer fails to record the responses accurately, without biased being
• Fail to create interview environment — need to create confidentiality and provide security
• Cheating or falsification during — interview
• Influencing the participants — the interviewer may influence respondents in subtle ways (misusing education, age, etc.).
In addition, response errors could occur during data collection while asking questions of respondents or when developing (faulty) questionnaires. Taylor, Sinha, and Ghoshal suggest that researchers should avoid the following pitfalls:15
• Bias — likely to lead prejudice or distortion
• Leading — wording that prompts or encourages the answer wanted or expected
• Ambiguity — may have more than one meaning
• Jargon — use of words which may have special meaning, but may not be commonly understood or used
• Insensitivity — showing lack of concern for a respondent’s feelings or emotions.
Reducing errors: Proper training of the interviewers and close supervisions may reduce interviewer errors or response bias. Usually, the training includes explaining the background and objectives of the survey, methodology, sampling, interview technique, quality control, etc.
Before finalizing the questionnaire, pilot-testing or pre-testing helps reduce response errors. The pilot tests are carried out by senior-level researchers or field managers to understand the drawbacks of the questionnaire, such as,
• Participant/respondent interest, willingness to response and understandability
• Meaning, relevance, or match with the context/situation
• Word and sentence selection
• Question transformation, continuity, and flow
• Sequence and arranging of questions
• Skipped instructions
• Length and timing.
Example of self-introduction and permission taken by an interviewer before a survey by a global research agency in South Asia:
“I _____________, take oath to this effect that I did not know the name and address of the above mentioned person before taking this interview. Before asking the question, I followed the condition of ResInt Canada to conduct the interview. All the information collected in this questionnaire are correct and true. No dishonest means were followed to conduct the interview and information was collected according to preconditioned rules.”
________________________
Signature of Interviewer
“Good morning/afternoon/salam/pronam, my name is__________. I represent ResInt Canada, a global survey research company. We conduct research on different products and services. Currently we are conducting a survey in your area. I shall be grateful if you would please spare some of your valuable time for this survey. I assure you that any/all information provided by you will be treated as confidential and will be used for research purpose only. Are you willing to participate in this interview?”
Good research will generate credible, reliable, and dependable data collected through a systematic approach by a professional researcher or research agency, which can be used for decision-making purposes. According to Cooper and Schindler,2 good research should have the following characteristics:
• Purpose clearly stated and defined
• Research process detailed
• Research design thoroughly planned
• High ethical standards applied
• Limitations frankly revealed
• Adequate analysis for decision maker’s needs
• Findings presented unambiguously
• Conclusion justified
• Researcher’s experience reflected
Research ethics is extremely important while carrying out the project. It emphasizes norms and/or standards of behavior and practices that guide moral choices about research behavior. The quantitative survey or qualitative investigations are dependent on the willingness of the respondents to become research participants. Willingness is contingent on the content of the survey, time requirements and confidentially of the responses. Honesty and integrity should be the guiding principle for any research firms or individuals conducting the research. There are several global societies/forums of marketing and social research agencies that have developed guides of ethical research practices, such as ESOMAR (www.esomar.org) and MRS of United Kingdom (www.mrs.org.uk), serving the research industry. Most of the research agencies are the members of these professional bodies.
Before any survey, the researcher must ensure the following:
– Cooperation from the respondents.
– Treating the respondents with respect and dignity.
– Respondent’s identity must be protected.
– Information collected must not be shared with others without permission.
– Respondents must not be harassed or embarrassed while gathering data.
Options to be availed to research respondents:
– Respondents have the right not to participate.
– Respondents have the right to stop participating in a research study at any time.
– Respondents have the right to require that their information remain confidential.
– Respondents have the right to require that personal information be deleted after use.
– Respondents have the right to the expectation of safety and freedom from harm.
SAMPLING IN MARKETING RESEARCH
M. Kabir
Yasmin Siddiqua
In statistical terms, sampling refers to the technique of selecting a relatively smaller number of units, persons, households, products, etc., to be included in a survey and to draw conclusions about the bigger population from which the sample is drawn. Sampling is used widely in all types of research and scientific inquiry.
Definitions and Assumptions
Population: Population refers to the group of elements or objects that poses the characteristics under study and about which the inferences are to be made. For any survey or research, the population needs to be precisely defined in terms of element and sampling units.
Sampling element: A sampling element is the object about which or from which the information is to be collected. In survey research, the sampling element is usually the respondents.
Sampling unit: A sampling unit is an element, or unit containing the element, that is available for selection at some stage of the sampling process.
Sampling frame: A sampling frame is a representation of the elements of the target population. It consists of a list or set of directions for identifying the target population.
A sample is selected using various techniques of sampling, mostly because enumeration of all units in the target population is a large and complex undertaking. Many issues such as studies on poverty, health, labor force, contraceptive use, immunization, unemployment, consumption patterns, and advertising of a product rely on samples rather than on complete enumeration. Many surveys are conducted to develop, test, and refine hypotheses in many disciplines. Government makes considerable use of survey data to study various population characteristics for planning and development purposes. Sampling plays an important role in their efforts.
The principal questions in any study involving sampling are:
• What is the specific population?
• What should be the size of the sample?
• How should the sample be selected to estimate the population characteristics?
• How reliable are these estimates? Can generalizations be made on the basis of these estimates?
Determination of Sample Size: The sample size needs to be large enough to provide reliable analysis of cross-tabulation analysis, offer desired levels of accuracy in estimates of proportion, and test for significant differences between means and proportions. To be able to conduct cross-tabulation analysis, each category included in the analysis should contain at least 50 cases (analyzing cases fewer than 50 tend to produce unreliable results).
To determine a sample size from a population of more than 10,000 when estimating proportions, the following formula is used:
where n refers to the estimated sample size; p represents the estimated value of the required parameter; e is the permissible margin of error; z corresponds to the value of required level of confidence and Deff (Books sourced17) is the design effect.a The desired level of confidence more commonly used is 95%; and the corresponding z-value is 1.96.The estimated sample size also depends on the value of e; the smaller the value of e (i.e., the higher the required precision is), the larger would be the required sample size. In case of simple random sampling, the Deff is considered to be 1. If p is not known then p can be assumed to be 50% because for a given value of z and e, it produces the largest sample size. There are different formula being used by the statisticians depending on the nature and objective of the research project.
Example 1: How large is the sample size if the total household in a community is 15,000; so that the estimate of the proportion of households buying a given product is within 5% of the true proportion with 95% probability.
A survey of similar nature was conducted earlier and found that the product was used by 40% of the households.
For estimating the sample size, we have e = 0.05; p = 0.40; the value of z at 95% level of confidence is 1.96. Therefore, the sample size would be:
n = (1.96)2 0.40 × 0.60/(0.05)2 = 369
Example 2: If we consider precision level is 1% then sample size would be:
n = (1.96)2 0.40 × 0.60/(0.01)2 = 9,216
Sample Selection Process: A number of sampling designs are available. For any particular survey, sampling design is based on the cost, reliability, and its appropriateness to the objectives of the survey. An appropriately chosen sampling design is highly desirable to obtain reliable estimates of the population parameters. The two major categories of sample selection are probability sampling and non-probability sampling. Wherever possible in quantitative research, it is recommended that probability sampling be used, only then can sampling error be estimated. This is not the case for non-probability sampling.
In probability sampling, the sampling units are selected using chance properties. As sample elements are selected randomly, it is possible to determine the precision of the sample estimates of the characteristics of interest. Confidence intervals, which contain the true population value with a given level of certainty, can be calculated. This permits the researchers to make inferences or projections about the target population from which the sample was drawn.
• Simple random sampling
• Stratified random sampling
• Systematic sampling
• Cluster sampling.
Simple Random Sampling: If a sample size “n” is drawn from a population of size “N” in such a way that every possible sample of size “n” has the same chance of being selected, then the sampling procedure is called simple random sampling. A simple random sample is selected from a population by using a table of random numbers. A pre-requisite for selecting a simple random sample technique is to have a sampling frame, in which each element is assigned a unique identification number. Random numbers are drawn from the table of random numbers to determine the elements of the sampling frame to be included in the sample. For example, a sample of size 5 is to be selected from a sampling frame containing 100 elements (e.g., retail shops in an area). Each of the sampling elements is numbered uniquely and to draw the sample, random numbers 56, 47, 20, 18, and 76 are identified. The sampling elements corresponding to the random numbers then would constitute the sample. While drawing the random numbers, any number greater than 100 are ignored and next number is identified. Excel offers a procedure to draw random samples using the command “=RANDBETWEEN(1, 100)” where (1, 100) indicates that a random number be drawn between 1 and 100.
If the list of all elements of a population of size N is available, then the procedure of selecting the sample of size n based on sequence is termed systematic random sampling.
In systematic random sampling, the interval between each unit for the sample is computed by using the formula N/n = k, where N is the total population, n is desired sample size and k is the interval. The first sample is selected through simple random procedure, which would be a number between 1 and k, which can be termed as r. The succeeding sample is selected by adding the computed interval k to the number drawn (r + k) and then every kth element is selected from the population. The selection of the sample would be unbiased as long as the elements of the population are listed without any particular order.
An example of the systematic random sampling can be explained with 30 sales managers in 30 stores. If we want to draw a sample of 5 sales managers from these 30 by using systematic random technique, we need to identify the sample interval k. We would first divide 30 by the sample number 5. The divisible number is 6. We then select a number randomly from 1 to 6. Let’s consider our first sample is 3, then the next sample numbers will be (3 + 6 =) 9, (9 + 6 = ) 15, (15 + 6 = ) 21, and (21 + 6 = ) 27.
Stratified Random Sampling and Cluster Sampling: If the population is not homogeneous, then we should use stratified random sampling. When there is heterogeneity in the population, we should use stratified random sampling, that is, small shops and large shops in super market or shops in urban areas and shops in rural areas. Within each stratum, elements are selected using random sampling.
When a sampling frame is not available, we should use cluster sampling. If there are clusters of shops in several areas (or classrooms in a college), and if we randomly select one cluster, then all shops (or classrooms) in the clusters are points of the sample. Within strata, all the elements are homogeneous but within a cluster, all the elements are not homogeneous.
Non-probability sampling relies on the personal judgment of the researcher rather than chance to select sample elements and involves:
• Judgment sampling
• Convenience sampling
• Quota sampling
• Snowball sampling.
It is almost always desirable that a sample design is evaluated to meet certain criteria which include accuracy, reliability, validity, and efficiency. The accuracy of a sample estimate refers to its closeness to true population value. The closer the sample estimate to the population value, the greater is its accuracy. If we assume that there is no measurement error in the survey, then the reliability or precision of an estimate can be stated in terms of sampling variance or equivalently its standard error. The standard error measures the precision with which the estimate from a particular sample approximates the hypothetical average result from all possible samples. The smaller the standard error of estimates, the greater is its reliability. Samples with high precision are regarded as efficient samples. If we assume that there is no measurement error in the survey, then the validity of an estimator can be evaluated by examining the bias of the estimator. The smaller the bias, the greater is the validity. The criteria of efficiency are estimated along with the cost of sampling. A sampling design is considered to be more efficient than another, if the former results in lower costs than the latter design with the same degree of reliability. The above issues are pertinent to a good sample design. We speak of these criteria with reference only to probability sampling methods, because probability sampling methods are the only sampling plans that allow us to assess the reliability of the estimates obtained from the sample data.
Case 1: QUALITATIVE RESEARCH
Qualitative and Visual Consumer Insights in Asian Markets
Russell Belk
Although quantitative marketing and consumer research provide the illusion of precision and may allow statistical testing, the numbers on which they are based are often quite meaningless. How favorably do you feel toward the Gillette Guard razor on a 7-point scale? Which number describes how likely you are to buy this razor the next time you need to replace your old razor? On a scale of 1–5, how would you rate each of the following attributes in terms of their importance in choosing a razor? Such questions do not describe the way we think about razors in daily life, if in fact we think about them at all. Consider instead how Proctor and Gamble’s Gillette actually went about researching and developing the Gillette Guard for rural and lower class men in India.
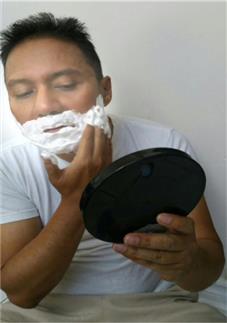
Have a look at the Gillette Guard razor designed for the Indian Market: http://www.pg.com/en_US/downloads/innovation/factsheet_final_Gillette_Guard.pdf. Before introducing this product, P&G’s Gillette had a 9% share of the Indian market of 400 million men with its Mach3 razor and 100 rupee (about $1.65 U.S.) replacement blades.18 In the U.S. market, by contrast, Gillette has a dominant 80% market share with its Fusion ProGlide razor with $4 U.S. replacement cartridges. The company had about 50% of the middle class Indian market, but almost no share among poorer and rural Indian men.19 Earlier Gillette had tested a new low-cost razor design among Indian students at MIT University in the U.S. Although the students gave the razor good reviews, it failed miserably in the Indian market. The company then decided that it needed to conduct ethnographic qualitative research with poor and rural Indian men. Like their American counterparts, the Indian MIT students shaved before a sink with hot running water using a mirror on the wall above the basin. However, the ethnographers found that rural Indian men typically shaved squatting down, often outdoors or with dim interior light, using a cup of cold water and a small handheld mirror. They used a century-old double-bladed razorblade in a heavy razor. They did not shave everyday and when they did, frequent cuts and nicks were the result.
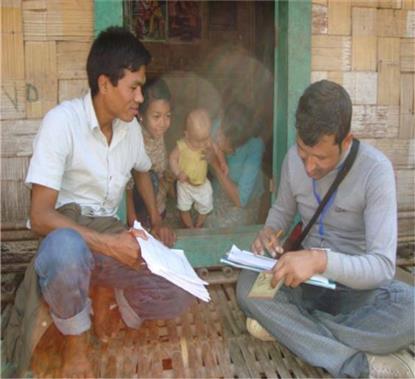
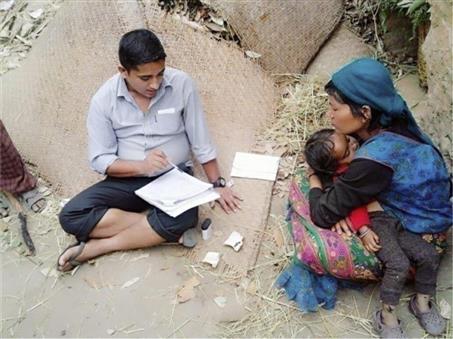
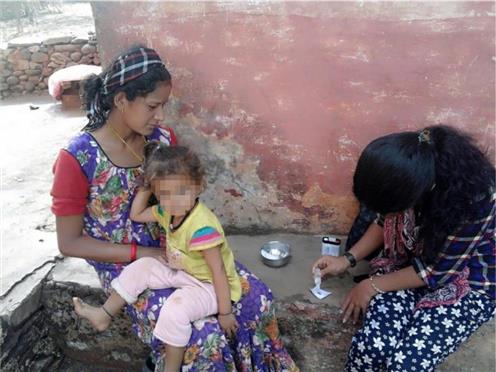
In order to learn this, P&G sent a team of researchers to India. They used ethnographic methods that included depth interviews, observations of men shaving, shop-along with men buying shaving products, home shaving observations, and test shaves with possible new razors. The team spent more than 1000 hours conducting the research.
Based on this research, Gillette engineers (who went to India with the ethnographic researchers) created the simple 3-piece Gillette Guard. It costs only 3% of what it costs to manufacture the Fusion ProGlide. It uses a large safety comb to prevent nicks, can be cleaned without running water, and sells for 15 rupees with replacement blades selling for 5 rupees (8US cents). It is light, made entirely in India, and produces fewer nicks and cuts than other Indian razors. Amazingly, after Gillette introduced the Guard razor in October 2010, it captured a 50% market share within 6 months. In introducing the new razor Gillette used the millions of small kiranas or shops of India and advertised it using Bollywood actors.20
In the future, Gillette plans to roll out the Gillette Guard in China, Africa, and other emerging markets. Eventually, the company plans to bring the product to North America. This path of reverse innovation will guard against being beaten out by competitors’ disruptive technologies.
Navi Radjou, the Executive Director of the Centre for India & Global Business at the Judge Business School, University of Cambridge, has called for “fewer engineers, more anthropologists” in India and other developing markets like China and Brazil.21 He criticizes new product development in such countries because it is dominated by engineers with anthropologists a very rare sight. It is not that the Engineers should be replaced by anthropologists in Research and Development (R&D). However, successful innovation must go beyond design and attempt to understand the people and cultures for whom these products are being developed. Nokia has succeeded using a staff of anthropologists. So have Microsoft, Intel, Toyota, and many other MNC consumer goods firms in global markets. In Microsoft’s Bengaluru research labs, a project called Technology for Emerging Markets is staffed by anthropologists, sociologists, political scientists, and developmental economists who study the informal markets that dominate such economies.22 They have developed mobile phone tools that facilitate computer access for illiterate consumers. Nokia introduced a variety of low-cost phones in India as well as tools like Nokia Life Tools that provide Indian farmers the latest prices for their produce.

Mobile phones have become ubiquitous in India by leapfrogging landline phones. The Nokia service provides instant access to farmers who have not benefitted from well-intentioned computer-sharing initiatives like echupal. Echupal (or e-Chupal) was set up by ITC bank to help rural farmers have an online computer link to access current crop prices. The echupal program primarily benefitted wealthier farmers, with smaller farmers largely being shut out or simply unaware.23 The Nokia program attempted to reverse this imbalance and empower bottom-of-the-pyramid farmers. Using statistics like the amount of wheat produced in regions where the echupal program was implemented, misled officials into believing that the program was working as intended. But on-the-ground ethnography again provided a truer picture of what was happening.
Despite the widespread penetration of mobile phones in India, once again simple statistics can be misleading. Many phones owned by men are used for business calls, appointments, and alarms. But they are also used personally for photos, music, and even pornography. In contrast, many mobile phones within households are “shared.” These phones are usually less full-featured or older models. They are also typically controlled by senior women in the household, with young brides being given only occasional access to call their parents and siblings, all under the supervision of their mothers-in-law. Gender politics can be difficult in India.24 However, for young dual-career working couples who have moved away from their extended families to urban centers, the situation is quite different. They use multiple mobile phones to make their busy lifestyles feasible. Mobile phones are also used by Indian migrant workers who travel from states like Kerala to work in the Middle East often for several years at a time. The phones are their links to life back home in India. Micro-finance ventures like Grameen Bank in Bangladesh help women in villages acquire and rent out mobile phones as well. These different uses should affect research and development, advertising, and targeting decisions for phones, but traditional number-crunching research is largely blind to such diversity.
With qualitative research providing consumer insights, we want to know things that cannot be captured by survey research. For example, how does it feel to wear a sari or blue jeans? How does what we wear change how we behave? If “clothes make the man,” do we impose our identity on clothing or does clothing impose its identity on us? When we discard old clothes, what happens to them? The importance of the latter question becomes evident when we follow used clothing from the Goodwill and Salvation Army bins of the West to secondhand clothing markets in Africa. The clothes are first sold by donor agencies to bundlers who pack the clothes in large bales that are sold wholesale in developing countries like Zambia. Small entrepreneurs buy these bundles and resell or barter their clothing in local villages.25 While it may appear curious to see villagers wearing U.S. icons like Donald Duck and Adidas logos, there can be serious consequences for local industries. In Zambia, inexpensive secondhand clothing has driven local businesses in the textile production industry out of existence. The individuals and donor agencies who initiated this supply chain feel they are doing good and fail to realize the impact of the global redistribution chain. Here too, ethnographic and videographic work like that of Bloemen25 reveal the ultimate consequences of used clothing.
In some cases anthropologists, working with local people, unearth the need for products that MNCs can develop and market. Examples include walk-behind tractors for work on steep hillsides, solar cookers that harness the sun’s power to cook food, and bicycle-trucks to transport merchandise to market.26 However, goods also flow from the less economically developed world to the more economically developed world. Examples include online sites like Etsy, Ten Thousand Villages, and Third World Crafts which sell handicrafts from remote locations to buyers all over the world. Once again anthropological insights can help in recognizing such opportunities for empowering local artists and craftspersons.
Employing a staff of anthropologists is increasingly common in multinational companies. There are also anthropological marketing research firms that specialize in ethnographic and videographic research, like Chicago- and New York-based Practica.27 Qualitative research requires rethinking about some traditional research assumptions. Ethnographic research typically involves observation and depth interviews with a small number of consumers in a small number of locales. The superficial breadth and representativeness of survey research is sacrificed for in-depth knowledge at a local level. In the case of Gillette, the Guard razor project involved several months of data collection. Managers visited the data collection sites in order to gain a firsthand look at what is going on. It was not possible however for them to spend the weeks or months on-site needed to complete a full ethnography. Instead, the researchers typically produce ethnographic photos and videos to help provide managers obtain concrete views of consumers in their everyday environments of homes, shops, and fields. Sometimes ethnographers have the consumers themselves do the photographing and filming. Since mobile phones increasingly come equipped with cameras and video cameras, such equipment is not obtrusive. Smart phones also allow research participants to e-mail the results to the researchers and allow researchers to ask them questions or request specific photos such as what they are eating. This provides not only instant feedback but also a rather natural mode of data collection.
While ethnographic work focuses mostly on participant observation and depth interviews as its major research tools, I would like to suggest that visual methods should play a special role as well. Asia may be no more visually dominant than other regions, but one difference is the existence of logographic writing systems in China and other Asian cultures influenced by China (e.g., Japanese Kanji, Korean Hanja, and ancient Vietnamese Han Tu). Such writing systems involve visual symbolism that is lacking elsewhere in the world. The resulting visualized meanings provide an additional layer to Chinese and Japanese brand names compared to alphabetic names.28–30
However, there are other reasons to consider the visual in qualitative Asian market research. Many issues of concern in marketing are essentially visual in nature. This includes not only brand names and logotypes, but also packaging, advertising, social media, web sites, and other forms of Internet presence. Contemporary examples are seen in a study by Cheng and Chan,31 who analyzed public service announcements in China and in another by Zhao and Belk,32 who found that symbols from Chinese communism were used in post-Mao advertising to gain greater acceptance of the market-driven Chinese economy that began with Deng. Chinese cultural symbols have also been found to be employed in order to make multinational brands appear more local.33 Fraser34 and Cheng35 analyzed Western themed housing advertisements in Shanghai and Hong Kong. And Davis and Sensenbrenner36 examined advertising encouraging parents of sole children (due to the one-child policy) in Shanghai to treat them as “little emperors.” Erbaugh37 analyzed Chinese greeting cards in order to reveal Chinese emotional conventions. Perhaps the most detailed visual analysis of Japanese visual culture is Roland Barthes’.38 Although he did not speak Japanese, by carefully examining the visible signs of Japan, Barthes offered an insightful, but controversial, analysis of practices ranging from bowing to sumo wrestling.
Visual material can also be analyzed historically, thanks to a growing number of online archives.39 One archival visual analysis examined gender roles and gift-giving based on 50 years of print advertising for Japanese Valentine’s Day.40 In Japan, women give chocolates to men on Valentine’s Day and a month later, on White Day, men reciprocate with more expensive gifts to women. Minowa, Khomenko, and Belk found an escalation in advertised gifts during the “bubble economy,” as well as ads and editorial content that encouraged women to give with an eye to getting a good “return on their investment.”40
Analysis of visual archival materials can also be used to analyze broader historical developments, including a number of analyses of advertising and other historical material like trade association records and museum exhibitions from old Shanghai from the mid-nineteenth to the mid-twentieth century (Gerth, 2003).41,42 An early form of Chinese advertisements were yue fen pai or calendar posters. They have been analyzed to better understand the rise of consumer culture in pre-communist China.43,44 This research suggests some parallels to the contemporary rise of consumer culture in China. Certain parallels have also been found in terms of nationalism in advertising and marketing in the two periods.45 Additional analyses of the role of advertising in Asian consumer cultures can be found in ethnographies of advertising agencies in India46 and Sri Lanka.47
But advertising archives are not the only visual material for historical analyses. Belk48 used images of antique Korean pojagi (quilts) in order to examine gender roles imposed on the women who created them during the repressive Choson Dynasty. Nguyen and Belk49 studied elements of power and disempowerment in the online photos of American Vietnam War veterans. And Ger and Belk50 compared the rise of consumer culture during the partly contemporaneous Dutch Golden Age and late Ming China based period paintings from the two cultures.
Visual material can also be used as stimuli in interviewing through “visual elicitation” or “auto driving.”51,52 This method assumes that the meaning resides in the audience or consumer rather than in the visual material itself. This is called reader response theory.53,54 This was the perspective employed by Zhou and Belk55,56 to examine how global versus local appeals in television and print advertising were seen by Chinese consumers. It was also the perspective used by Hung, Yiyang li, and Belk57 to examine how Chinese women react to different advertising depictions on women in print advertising. Wang discusses how such findings can be used in marketing products to women in China.58
As noted, in auto driving or visual elicitation research participants are shown visual stimuli in order to provoke discussion. This makes the interview more engaging and also is often more comfortable, especially in Asia, because the researcher and the research participant focus their eyes on visual material rather than looking at each other directly. For example, Martin and Woodside59 conducted a netnography4 of blogs and web pages using photographs of the participants to further probe their initial touristic impressions of Tokyo. The method involved visual elicitation or interviewing the tourists who created these images in order to talk to them about their experiences. In a study of the clothing of covered Islamic women in Qatar and United Arab Emirates, Rana Sobh and Belk used photos of abayas and shaylas (body and head coverings) and also had informants wear their favorite abaya and shayla to the interview as a further focus for discussion.60,61 Here, too visual elicitation was used based on both the photos and the clothing items that participants wore to the interview.
Besides using visual material as a direct stimulus for discussion, the visual can also act as a medium for urging participants to project their feelings onto another being or situation rather than express them directly. The purpose for doing so is to break through inhibitions by providing a more playful task that does not threaten egos or lead to socially desirable responses.62,63 For example, in order to study materialism, Kara Chan64 had Chinese children make drawings of children who had a lot of expensive toys and of those who had few. Inevitably, the former child was shown as happy and the latter as sad. If she had instead asked children directly how they felt about having their own inventory of toys, it would have been unlikely that she would have obtained this level of candor. In a study of “the smile” that we are conducting in service contexts in Hong Kong, Spain, and Canada, Rosa Llamas and I have used a series of projective methods. They include having participants draw service people in various contexts (e.g., a local hotel, a McDonald’s restaurant, an airline), interpret the emotions of people shown in cartoons and photos with or without smiles, and interpret photos from their own photo archives. In this case, the subtlety of the smile rather than its sensitivity was a more important rationale in using projective methods. That is, while people may sometimes not particularly recognize different sorts of smiles, they nevertheless appear to have an influence on how they feel about such encounters.
Other types of projective techniques include word association, sentence completion, collage construction, symbol matching, object personification (e.g., if this brand was an animal it would be …), dream exercises, thematic stories, the Zaltman Metaphor Elicitation Technique (ZMET), psychodrama, and shopping lists (e.g., what sort of person would have this shopping list …?). Eckhardt and Bengtsson65 urge using visual scenarios as stimuli for group interviewing in Asia as well. Further examples of such methods can be found in the articles of Belk, Fischer, and Kozinets,66 Gordon and Langmaid,67 and Rook.63 Such projective methods can be used with pre-literate children, non-literate adults, and research participants who speak a different language.
Visual ethnography involves taking (or having participants take) photo or video recordings of interviews (perspectives on action) and behavior (perspectives in action). Maps and non-projective drawings by the researcher or research participants can also be regarded as part of visual ethnography. Examples include photographic studies of home consumption in Hong Kong public housing,68 wedding dresses and wedding rituals among the Muslim Hui in Shanghai,69 and the physical layout of Tokyo Disneyland versus its American counterpart.70 Maps and visual images help show the balancing of the exotic and the familiar (in Brannen’s terms) in this Japanese version of America. Other theme parks in China and Japan have also been studied visually.71,72 And Tumbat and Belk73 used photography to assess territoriality and community at Everest base camp in Nepal.
In addition to still photography, videography74 encompasses another common means of visual data collection in qualitative consumer research.75,76 Another approach is to “give the natives the camera.”27 This can help create intimate auto-ethnographies as well as obtain video material during group activities without the unnatural presence of a videographer who is not ordinarily a part of the group. Another technique that removes the presence of the researcher is to obtain archival family films or video recordings.77 A huge video archive is YouTube and other video-sharing sites.78 Visual impact analyses have been done on television in India,23 Chinese visual representations in the West,79 and Japanese television series in Asia.80 Other analyses focus on sites like YouTube81,82 and virtual worlds like Second Life.83,84
A picture may not literally be worth a thousand words, but it does potentially capture more information than the eye of the observer and may be replayed for detailed observation and analysis.85 In our digital world, it is inexpensive and easy to include still photos in research reports. However, we need to learn to go beyond using these images merely to illustrate rather than forming part of the analysis (see Schroeder for exceptions).74 Although still images can be very helpful in presenting Asian culture to non-Asian audiences, when photographs have been collected as data, they can also be a part of the analysis. In an American project called the Consumer Behavior Odyssey, we also physically archived hundreds of photos, slides, videotapes, and field note files at the Marketing Science Institute in Cambridge, Massachusetts for future analysis.86,87 However, with today’s digital possibilities it is much easier to create such visual archives. Interactive web and DVD presentations also allow sharing visual data with audiences who can select the findings and formats that are most useful to them.88
Still photographs can be included in books and journals, as well as used in video media presenting qualitative research. Starting in 2000, Robert Kozinets, Marylouise Caldwell, Paul Henry, and I have organized film festivals at the Association for Consumer Research (ACR) conferences in North America, South America, Europe, and the Asia Pacific. More than 100 different films have been included in these festivals, and many of these films are about Asia. There is the beginning of an archive of these films at a Vimeosite called Films by Consumer Researchers (http://vimeo.com/groups/136972). There have also thus far been several special issues of several consumer and marketing journals containing both DVDs or online videos as well as accompanying papers for the videos they include. For managers, as well the video format is often preferred and compelling.89 A number of ACR Film Festival videos have been included with consumer behavior textbook teaching packages, such as Solomon’s Consumer Behavior: Buying, Having, and Being. Occasionally consumer research has been shown on broadcast television as well, including a qualitative methods course shown on SBS television in Australia using research I and others had done in Aboriginal communities in the North of the country.
There are a growing number of opportunities to enliven consumer and market research in Asia through the use of visual data and visual methods. In videos, articles, books, and live presentations, it is much more engaging to use visual material rather than words alone. A growing community of visual scholars can be found in both academia and business consumer and marketing research. Businesses respond very well to visual materials and there are a number of research agencies that specialize in videographies.27,90,91 There is also a great opportunity for Asian and non-Asian scholars to collaborate on producing ethnographies and videographies in Asia. With the help of the latest technologies, it is quite possible to make high-quality visual images and to edit high-quality video with little expense or prior experience. Subtitles make it possible to present these images to diverse audiences.
Asian consumer cultures are rich in visual details. Photography and videography are more important than ever before in Asia. There is a huge potential for visual and projective qualitative research in Asia. This chapter and the examples with which it began will hopefully inspire many such projects in the future.
As a rapidly developing economy, China has grown a middle class large enough to make it the number two market for luxury goods in the world (after Japan). Many foreign luxury goods makers have entered the country and a small number of Chinese companies are also trying to establish themselves as luxury goods makers as well. Initially (in the 1990s and the first decade of the 2000s), Chinese luxury consumers favored prominent brands like Louis Vuitton and luxury brands with large conspicuous logos. Less affluent consumers showed this same taste for conspicuousness in their choice of counterfeit luxury brands, although some of them sacrificed “necessities” in order to afford genuine “luxuries.”88,92 Recently, however, there is some evidence that Chinese consumers are shifting to inconspicuous luxury brands with small logos, with some even removing the labels in their clothing in order to hide their luxury brand origins.93,94 Several explanations for this trend are possible. It may be that as consumers get used to their newfound wealth, they shift from buying for status to buying for the quality and sensory pleasure afforded by luxury brands. It is possible that as the gap between rich and poor grows, people consume less conspicuously in order to avoid provoking the envy of those less well off. Given the amount of corruption and illegal sources of income in China, it is also possible that people consume less conspicuously in order to avoid government scrutiny and possible punishment. Or it may be that the emphasis has shifted from impressing the general public to impressing a small group of other affluent consumers who will be able to detect more subtle luxury consumption practices. This may be supported by the lesser conspicuous consumption of those who have moved from China and Hong Kong to more affluent countries.95 In order to sell luxury goods to the Chinese market, luxury goods makers need to gain some insight into which these or other factors may be fueling the apparent shift toward inconspicuous luxury.
1. What are some factors that you think are unique to doing research in Asian Countries?
2. Are these factors similar or different in other economically developing countries?
3. In the case above, what factors do you think help to best explain the apparent shift to less conspicuous consumption? Do you think this is a permanent shift or a temporary anomaly? What are the implications for the counterfeit luxury goods market?
4. If the focus of the above case was India, what would you expect to find that is different? Why?
Answer guide Q1:
Students should think about what research practices are acceptable (e.g., is Internet penetration large enough to allow netnography? Will people in some countries be suspicious that a stranger asking questions may report their information to the government?).
Answer guide Q2:
The same considerations apply here as in question 1, but students should also think about language differences, urban/rural differences, the nature of markets in a given country, gender differences in who buys and how, religious differences, and income distribution effects. These factors are more significant with some products (e.g., foods, items related to religion, socially sensitive products, and topics).
Answer guide Q3:
There is no single explanation that is likely to account for this trend. Building resentment of the rich, assumptions that they have earned their money from corruption, and emulation of foreign tourists are additional explanations. Fear of theft may be another factor.
Answer guide Q4:
Indians have long put their wealth in Gold and jewelry. While there is increasing consumption of other luxury goods in India, including in automobiles, housing, electronics, and clothing, there is also a greater tendency to be inhibited by parents’ consumption levels (not wanting to outdo them). As more Indians move from their parent’s communities for education and jobs, some of the traditional inhibitions against conspicuous consumption are likely disappearing. You might pose the case of a young couple of professionals who have moved to Bengaluru or Hyderabad to work in the IT industry.
Case 2: QUANTITATIVE RESEARCH
Tackling Corruption: Research Method Controversy
Syed Saad Andaleeb
Transparency International Bangladesh (TIB) is the accredited national chapter in Bangladesh of the Berlin-based Transparency International, a global civil society organization leading the fight against corruption. TIB began its activities in 1996 with a vision of Bangladesh where government, politics, business, civil society, and lives of the common citizens would be free from corruption.b
TIB’s mission is to catalyze and strengthen a participatory social movement to raise and strengthen voice and intensify demand for accountability through strengthening institutions, laws and practices and establishing an efficient and transparent system of governance, politics and business. TIB’s research, dissemination, campaign and advocacy initiatives are directed at policy and institutional reforms to control corruption; reducing poverty and promoting sustainable development are expected outcomes of its efforts.
TIB’s activities are implemented at two levels — national and local — through processes of civic engagement, research, and advocacy. At the national level its work is designed to bring the issue of corruption into sharper focus of public discourse and thus contribute to strengthening democracy and building a national integrity system.
At the local level, TIB has established a network of Committees of Concerned Citizens (CCCs) all over the country. This social movement is driven by volunteers who challenge the notion that corruption could be a way of life. The movement features young people — mainly college and university students — who have emerged as the prime movers of the movement organized as YES (Youth Engagement and Support).
TIB’s activities have had significant direct and indirect impacts in two areas: institutional, legal and policy reforms to promote integrity and good governance, and improvement in the content and quality of key public services especially in education, health, and local government.
TIB is now identified as being synonymous with tackling corruption in Bangladesh and, through its work, anti-corruption is part of the public discourse and central to the public policy agenda. TIB has catalyzed or been directly involved in key institutional and policy changes, the most notable of which are: reform of the Anti-Corruption Commission; Bangladesh’s ratification of the UN Convention against Corruption; reform of the Public Service Commission; reform of the electoral rules and the Election Commission; adoption of the Right to Information Act; catalyzing specific improvements in the functioning of Chittagong Port and automation of the Chittagong Customs House; inclusion of anti-corruption education in secondary and higher secondary text books; integrity in the public procurement system; and advocacy for the National Human Rights Commission.
In 2010, TIB conducted a National Household Survey (NHS) on Corruption to assess the dimensions and depths of corruption in different public and private service sectors. Corruption was defined as the abuse of power for personal gains. Apart from accepting a bribe or being compelled to pay a bribe, negligence of duty, nepotism, embezzlement of money or assets, deception, and different types of harassment have been included in the definition of corruption. The most harmful type of corruption was seen as those illegal transactions of large amounts or abuse of power where there is a nexus among policy-level politicos, administration, and influential persons in the private sector.
The specific objectives of the survey were as follows:
• To identify whether members of the households in accessing different services have been victims of any corruption
• To assess the nature and degree of corruption or harassment experienced by households in accessing services from different sectors and sub-sectors
• To provide policy recommendations to prevent corruption of different sectors and sub-sectors.
The survey adopted a three-stage stratified cluster sampling method for selecting households, following the Integrated Multi-Purpose Sampling (IMPS) Frame developed by the Bangladesh Bureau of Statistics. The total number of households selected for the study was 6000. Out of this number, 3480 households (60%) were from the rural areas and 2520 households (40%) from urban areas. Following the IMPS, these households were selected from 300 Primary Sampling Units (PSU) in 64 districts, 174 from rural areas and 126 from urban areas. In the first stage for selection of households, PSUs or Moujas were selected from every stratum through random sampling. In the second stage, a bloc of 200 households was formed from every PSU through random sampling. Finally, following the procedure of systematic sampling, a total of 20 households, one after every 10 households were selected. Information for the survey was collected from these selected households through a structured questionnaire.
The survey was conducted between 09 June and 20 July 2010 in 64 districts by 17 data collection teams. In each team, there was a supervisor and three data collectors who conducted interviews of 20 households. In each household, the interview was conducted with the household head or with a household member capable of providing the information in the absence of the household head.
For fieldwork, data collectors and supervisors needed a minimum of a graduation degree and completion of a competitive examination. Subsequently, the successful candidates were provided a three-day training initiation. Thereafter, the draft questionnaire was field tested in nearby areas with their help. The questionnaire was refined on the basis of their field experiences. During survey work, a researcher from TIB was engaged for overall monitoring, supervision and filling up of questionnaires by each team. To ensure quality, TIB researchers and supervisors went for back checks and spot checks.
The findings of the survey ranked the Judiciary as the most corrupt sector in Bangladesh with 88% of the respondents admitting to having been subjected to corruption in 2010 (see Table 1). According to the survey, the level of corruption had increased substantially between 2007 and 2010.c
The reaction of the Judiciary to the findings of the study was very strong: The Bangladesh Judicial Service Association (BJSA) expressed deep concern with the report, dubbing it as false and baseless and demanding exemplary punishment of TIB officials involved with publishing the report. The President and its Secretary General in a joint statement said that TIB had earlier published false and baseless survey reports implicating the judiciary without proper information.d
Table 1: Corruption and Irregularities Faced by Households in Different Sectors.
Name of Sectors |
Corruption and Irregularities Faced Households (%) |
|
2010 |
2007 |
|
Judiciary |
88.0 |
47.7 |
Law-Enforcement Agency |
79.7 |
96.6 |
Land Administration |
71.2 |
52.7 |
Tax & Customs |
51.3 |
25.9 |
Electricity |
45.9 |
33.2 |
Agriculture |
45.3 |
– |
Local Government |
43.9 |
62.5 |
Health |
33.2 |
44.1 |
Insurance |
19.2 |
– |
Banking |
17.5 |
28.7 |
Education |
15.3 |
39.2 |
NGO |
10.1 |
13.5 |
Others |
34.1 |
35.5 |
Overall |
84.2 |
66.7 |
Source: Transparency International.
Three defamation cases were also lodged against TIB and its senior officials, which caused more than a year of harassment before TIB succeeded in defending itself in the courts. In fact, TIB officials were summoned by the highest court to explain their study. When they were specifically asked that the corrupt officials be identified from the survey, it seemed to suggest that even the high officials of the Judiciary were not familiar with the intent of surveys and what the survey procedures were meant to unearth. To ensure that the Judiciary and other government offices and departments understood the nature and intent of surveys, an op-ed in a popular newspaper made an attempt to sensitize these offices. The op-ed is reproduced in Appendix 1.
Notwithstanding the sharp response, TIB used a Policy Brief it produced on the basis of the survey to demand reform in the justice system. This led to the formation of a five-member judges committee to investigate the allegations of corruption in the judicial system, submission of wealth statement by then Chief Justice, followed by some other senior judges, and setting up of complaint boxes in the office of the Registrar of the Supreme Court: a clear example of a challenge converted into an opportunity.
1. Can surveys be used effectively in the social sector to fight corruption?
2. On what grounds could the TIB survey be challenged by the Judiciary?
3. What defense could TIB put up in support of the 2010 National Household Survey?
4. Comment on the op-ed piece: do you support the writer’s point of view?
Answer guide Q1:
Albeit they can be! If the surveys are used to assess the level of corruption by different agencies and made public, it might change some behavior given the notion of “evaluation apprehension” that psychologists have found to exist in those who are evaluated. The important thing to consider here is how “corruption” will be measured, how the survey instrument will be designed and administered, and how the data will be gathered (sampling), analyzed, and made public. As the case demonstrates, sometimes powerful agencies of the government can react in unpredictable ways. Of course this is no reason to be cowed or deterred by them. As more surveys are used and consistent patterns of behaviors are revealed, it can be a powerful basis for bringing change to corrupt and deviant behavior by introducing more transparency and accountability.
Answer guide Q2:
The main ground on which the TIB survey could be challenged is in the methodology employed. This is where TIB and other survey groups must do due diligence. The questionnaires must be designed with precision after delineating “what” is being measured. Sampling considerations are vital: if casual and convenience samples are used, the survey will lose potency. The analysis must also be clear: for example, instead of providing mean scores, the more appropriate presentation is confidence intervals to reflect the variation in the response rates. If carefully planned, the survey data could also be used to do some elasticity modeling based on regression analysis. The potential for errors is large; however, the opportunities to impact the work of the agencies are huge if the surveys are designed carefully and methodically.
Answer guide Q3:
The key defense is in their adoption of a research methodology that is acceptable worldwide.
Answer guide Q4:
Student opinions on the matter are likely to be varied, invigorating, and definitely innovative.
In defense of survey methodology — http://archive.thedailystar.net/newDesign/news-details.php?nid=173092
The recent tiff between the Supreme Court (SC) of Bangladesh and Transparency International, Bangladesh (TIB) is a watershed event for all professionals who conduct surveys and the organizations that use them to guide important decisions. In the business world, surveys often guide major strategic decisions. And the use of surveys for political opinion polling is ubiquitous.
What is surprising is that not one organization in Bangladesh that makes a living using surveys responded. Even from the universities and their esteemed researchers, there was not a single intellectual opinion in defense of survey methodology.
The TIB survey suggested that the judiciary is perceived as the most corrupt service sector in the country. According to one report, “… lawyers, court employees, court clerks and brokers take money to hasten or postpone hearings, to withdraw and destroy case documents, and influence the judgment.”
Expectation and payment of “speed money” are not uncommon in the public sector. People face such practices routinely that in turn form and reinforce their “perception” that the corruption menace is as healthy as ever. One might wonder why the use of speed money to facilitate court-related matters would be anything unusual to expect.
The visceral reaction to the suggestion that corruption exists in such a powerful institution was understandable. Similar reactions occur in the developed world too. In the United States, when the rankings are revealed periodically about universities (in the US News and World Report), many “universities decry the commercialism of the rankings, [and] attack the methodology of the ranking process ….”
Curiously, when the rankings are stellar, they are widely accepted and used liberally to bolster support from various stakeholders; when the rankings are not favorable, there is a big hue and cry.
The Supreme Court, given its extraordinary powers, publicly questioned the TIB report, concluding that it was baseless and without substance. It also opined, “The TIB report was just made for publicity as it could not help pinpoint people involved in corruption.”
Surveys, to be clear, are not police investigations. They are not intended to identify specific episodes of corruption or corrupt persons. Rather, surveys are tools used to “estimate” certain attitudes, perceptions, propensities, behaviors, and incidences that exist in a population. According to one source, “Surveys are a powerful, cost-effective tool for gathering important information and for identifying and diagnosing problems and opportunities.” They provide statistical insight into a phenomenon — in this case perceived corruption — that exists in a defined population.
If the probe committee expected the study to identify specific cases of corruption, it must be respectfully submitted that it has little understanding of the purpose of surveys and their methodologies.
That does not mean, however, that all surveys are perfect. They can be flawed and sometimes their intent can be dubious. To refute the TIB’s findings, the SC could have investigated the source of flaws by seeking clarifications in the following areas:
• Was there a design flaw, particularly in sampling and generalizing to the entire population of Bangladesh?
• Was there a flaw in the way the questions were framed and the measurement scales used?
• Was there a flaw in data collection, especially in how fieldwork quality was ensured?
• Was there a flaw in analysis, especially the statistical procedures employed?
• Was there a flaw in the conclusions that were drawn?
From my understanding, the study used the Integrated Multipurpose Sampling (IMPS) Frame employed by the Bangladesh Bureau of Statistics. This is accepted protocol. The large sample size also suggests the study’s representativeness.
The questions that needed to be asked of the respondents appear to be fairly straightforward. Actual data collection can be erroneous. And the type of analysis needed did not seem too esoteric to obfuscate the results. What remains is the conclusion: the interpretations here can be tricky because of such things as order and halo effects. But that is technicality.
If the SC felt strongly that the study’s conclusions were in error, it could have commissioned a replication study to compare the results. It may be cautioned, however, that replication studies will not produce identical results because of sampling and non-sampling errors that tend to creep in. But the confidence intervals can provide reasonable insights into the accuracy of the findings.
The SC’s actions and conclusions could, thus, be quite disconcerting and raise a number of questions:
• If the Judiciary had been shown in a cleaner image (not leading), would the SC have displayed such an incendiary response?
• If a replication study is conducted, the Judiciary’s ranking could fall from first place to second, third, or even fourth. Should that allay citizens’ concerns about corruption in the Judiciary?
• TIB reports have been called into question in the past too; however, was its credibility ever really destroyed? As part of an international effort to promote transparency, it seems to use credible methodologies.
• Does the SC feel that surveys are inherently flawed and ought not to be used to assess public services?
• Might the judiciary have strengthened the hands of the corrupt within its system? Will these elements now feel much safer to harass the citizenry, and in greater measure?
Transparency, today, is a desperate need in the country. Overall development and alleviation of poverty can come about when the inner workings of the nation’s core institutions are opened to the public for assessment. In facilitating this, TIB has played a vital role by seeking opinions of the key constituency: the beneficiaries of public services. A concern now is whether TIB is unlikely to conduct similar studies in the future for fear of being twice-burnt.
Instead of its angry and intemperate reaction, the SC could have displayed a wiser and nobler stance by thanking TIB for helping unearth what goes on inside the judiciary’s arcane world and its current state and health. This would reinforce the judiciary’s clear intent to establish and deliver justice in greater measure, signaling hope for those who struggle with injustice almost daily.
A positive institutional attitude is what is needed today across various public sector services to better serve the nation in its quest for emancipation. In such an attitude lies the real possibility that appropriate measures will be taken by the higher ups to ultimately rid the people they are duty-bound to serve of their miseries. The present attitude comes across as ominous: one that maintains the status quo, projects bureaucratic hegemony, and detracts from a people-centric ethos.
a. If instead of simple random sampling, cluster sampling is used, then there is a loss of randomness and/or effectiveness, which is known as the design effect. It is the ratio of the actual variance, under the sampling method actually used, to the variance computed under the assumption of simple random sampling.
b. http://www.ti-bangladesh.org/beta3/index.php/en/about-us/what-we-do/programmes
c. http://www.ti-bangladesh.org/beta3/index.php/en/about-us/what-we-do/programmes
d. Transparency International Bangladesh, Report on survey published in 2010.