CHAPTER 7
London and the Thames Valley Region
GENERAL INTRODUCTION
THE LONDON AND THAMES VALLEY REGION includes the western watershed between the Severn and Thames valleys in Gloucestershire and Wiltshire, one of the main drainage divides in Southern England. It also extends eastwards, through Oxfordshire, Berkshire and Buckinghamshire to London, Essex, Kent and the sea. Travelling from west to east, I have divided it into Areas 10, 11 and 12 (Figs 179 and 180).
I shall start by examining the bedrock geology, and how it relates to the general river-valley and hill pattern of the Region (Fig. 181).
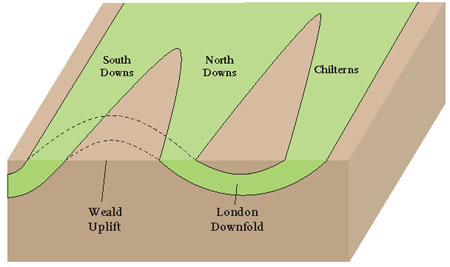
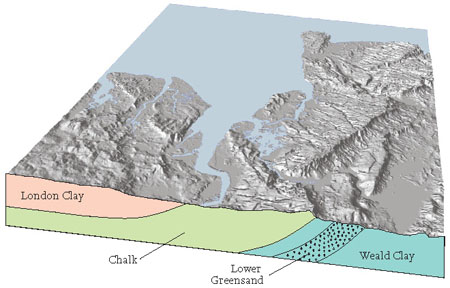
The central feature of this Region is the London Basin, bounded to the north and south by hills of Late Cretaceous Chalk. The folding of the Chalk has formed the London Basin downfold to the north and the Weald uplift to the south (Fig. 182). This is a classic example of how gentle folding of the bedrock can influence landscapes and topography on a Regional scale.
Earlier chapters, particularly Chapters 5 and 6, have shown how important the Variscan mountain building has been in the landscape evolution of Southern England. This mountain-building episode culminated about 300 million years ago and was followed by New Red Sandstone sedimentation during the Permian and Triassic. Southern England then entered a period of relative stability, although gentle regional tilting did occur, along with important variations in sediment accumulation and minor faulting of the crust.
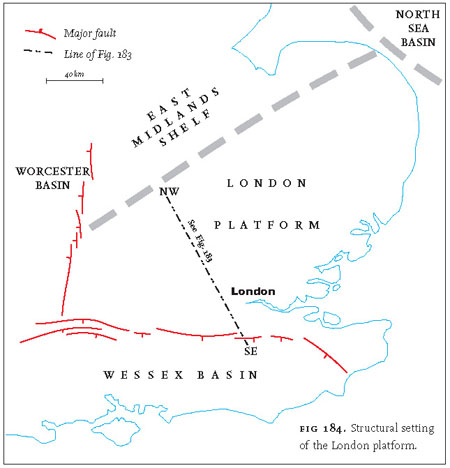
One important effect of the faulting has been to produce differences in the bedrock successions to the north and south of the London Basin in layers of sediment of Early Cretaceous age or older. Most of this faulting was normal (see Chapter 3, Fig. 33), caused by stretching of the crust that fractured it into discrete blocks, some rising and some subsiding. The stretching was a local response to larger movements of western Europe, linked to the opening of the Atlantic Ocean to the west and the sinking of the North Sea area to the east. In the Thames Valley area, the result of this new pattern was that a relatively stable London crustal block (often called a platform) became separated by fracturing from a subsiding Wessex Basin to the south (Figs 183 and 184). The Wessex Basin is now represented near the surface by the thick succession of Early Cretaceous bedrock in the Weald area to the south of the North Downs.

FIG 179. London and Thames Valley Region.
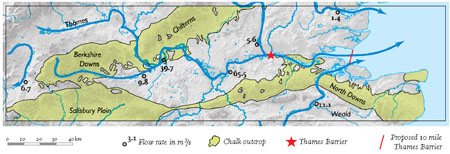
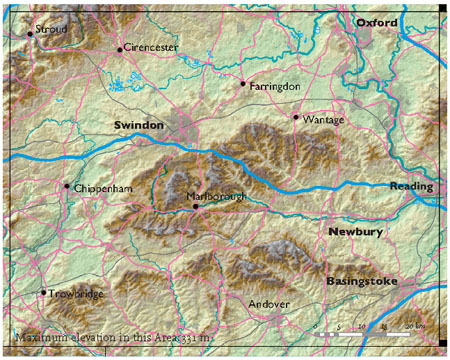
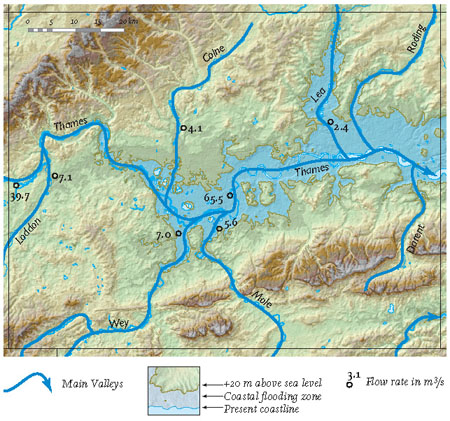
FIG 180. Elevation and drainage map of the Thames Valley Region, including the areas of Chalk outcrop.
FIG 182. Block diagram, looking westwards, to show how the Chalk outcrop pattern at the surface results from erosion of the fold pattern in the bedrock.
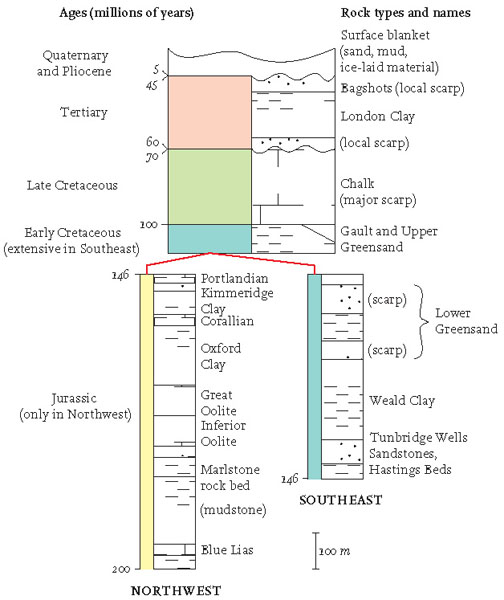
Later, in the Early Cretaceous, sea level rose substantially, flooding the previously river-dominated Wessex Basin and depositing the shallow marine sands of the Lower Greensand, which are often seen to infill ancient river valleys cut earlier into the Wealden bedrock. Later still, by the mid Cretaceous, the deeper marine Gault Clay and Upper Greensand were deposited (Fig. 181). By the Late Cretaceous, rising sea levels progressively inundated most of northwest Europe. The Thames Valley Region was submerged beneath a sea several hundred metres deep, and pure white chalk was deposited over much of Southern England.
During Early Tertiary times, the whole of Southern England was subjected to crustal convergence, causing further movements along faults and local folding of the bedrock. This occurred at roughly the same time as the major convergence that caused the tectonic-plate-related mountain building of the Alps and Pyrenees to the south. Some old faults relating to the lowering of the Wessex Basin relative to the London area were reactivated, but this time in the opposite direction: the Wessex Basin was uplifted and the London Platform subsided. The uplifted Wessex Basin was further compressed to form the Weald uplift or anticline, while in the London region a broad, eastward-opening downfold (syncline) developed, creating the impressive arcuate bedrock pattern that is clearly picked out by the Chalk today (Figs 180 and 182).
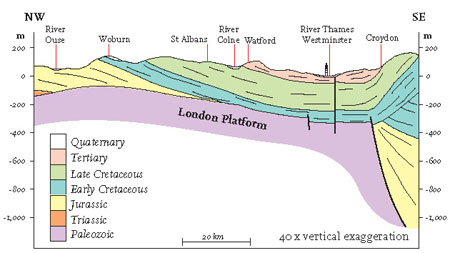
FIG 183. Bedrock cross-section through the London area, showing the bedrock structure.
As the formation of the London Basin progressed, its northern and southern edges became elevated, while its central portion was depressed, creating a shallow hollow some 80 km wide and about 500 m deep. River networks developed and began to erode the higher ground, transporting sediments inwards towards the centre of the basin. This erosion quickly picked out the strong layer of Chalk in the bedrock succession and produced the distinctive Chalk hills that mark the edges of the London Basin today.
Later in the Tertiary, sea level was rising once more, flooding the newly formed basin as far as Newbury and depositing a thick sequence of marine muds (particularly the London Clay) over a wide area. The London Clay is one of the best-known and most extensive Tertiary deposits in England, forming the bedrock beneath most of Greater London. The properties of the London Clay make it an excellent rock for excavation and tunnelling, and in 1863 the world’s first underground railway was opened. Today the London Clay beneath London is riddled with tunnels, and the Underground has become a huge enterprise, used by some 3 million passengers, on average, each day.
Overlying the London Clay are the pale yellow sands of the Bagshot Formation, deposited in a shallow marine or estuarine environment as the sea retreated from the Region once again. The main outcrops are found on Bagshot Heath, an area of elevated ground around Camberley.
The most recent deposits in this Region are the extensive Quaternary terrace deposits of the modern-day Thames, predominantly sands and gravels that have been extensively quarried. In the north of the Region there are also deposits (till) left behind by the Anglian ice sheet 450,000 years ago.
The evolution of the London Basin downfold and the Weald uplift (see also Chapter 2, Fig. 10) can be summarised as follows:
- Prior to about 60 million years ago, the Thames Valley Region was covered by the sea, allowing Chalk and Earliest Tertiary sediments to accumulate in approximately horizontal layers. By about 60 million years ago, sea level had dropped and/or the Region had been uplifted to expose dry land.
- Between 60 and 45 million years ago, crustal compression began to move the bedrock units to create the London Basin downfold and the Weald uplift. The London Basin subsided along an approximately east-west trending axis and the rocks to the north and south of this axis were tilted gently inwards by about 1 degree. The sea flooded the newly created basin from the east and sediments began to accumulate.
- Continuing compression between 45 and 40 million years ago gradually increased the tilts of the rocks forming the fold limbs. Erosion of the uplifted ground to the north and south of the London Basin exposed the Chalk that now forms the Chilterns and North Downs respectively. Between about 40 million years ago and the present day, river networks became established on the high ground and the sea repeatedly advanced into and retreated from the London Basin. Erosion continued and intensified, lowering the landscape generally and causing the Chalk scarps to retreat inwards towards the centre of the basin.
- Today, the landscape has been eroded to expose Early Cretaceous sediments in the core of the Weald uplift, bounded to the north and south by the Chalk scarps of the North and South Downs. Tertiary sediments are preserved within the London Basin, while to the north, at its northern margin, another Chalk scarp marks the Chiltern Hills.
Modification under Ice Age conditions
The Thames Valley Region was only rarely invaded by ice sheets during the Quaternary. The most widespread invasion of the past few million years occurred during the Anglian cold phase 450,000 years ago, when ice reached the London Basin and diverted the course of the ancestral River Thames. The more local effects of the Anglian glaciation on the London Basin are discussed further in the Area accounts.
Although most of the Region has not been covered by ice sheets, it has still been severely affected by the periglacial (near-glacial) climate. For most of the time the land was treeless tundra, with a permanently frozen subsurface layer of soil and bedrock. At the surface, soil and bedrock were frozen in winter but thawed every summer, an effect which, combined with the snow-fed spring meltwater, created fast-flowing and highly erosive rivers. The ‘dry valleys’ of the Chalk were carved at this time: chalk is naturally porous because it is highly fractured, but the frozen subsurface blocked the fractures and prevented water from draining away through the chalk as it did during warmer times. Instead the water flowed across the surface, carving valleys that are visible today.
Other cold-climate effects on the scenery were land-slumping and land-slipping, accelerated by freeze-thaw cycles. These created characteristic indents in hill ranges (see Areas 10 and 12) and concentrated Sarsen Stones in valley floors (see Area 10). Glacial processes also modified the earlier, river-created landscape, for example in south Essex in Area 12.
The River Thames was severely affected by the Ice Ages. Before the great Anglian glaciation the Thames entered the London basin from the west approximately where it does now, but then flowed northeastwards along the Vale of St Albans, some 30 km north of its present course. It then turned northwards in the Chelmsford area and flowed across north Essex and Suffolk, eventually joining the Rhine somewhere in the area now covered by the southernmost North Sea (see Area 11). Just under half a million years ago, the advance of the Anglian ice from the north extended across the course of this ancestral Thames, locally damming the river and deflecting it progressively southwards to finally take up its present path. The hill ridges of south Essex, the Valley of Romford and the estuaries of the Blackwater and Crouch are all likely to have been shaped during episodes when the Thames or its immediate tributaries flowed in that direction.
Coastlines and sea-level rise
The coastline of the Thames Valley area is one of the youngest features of the landscape, since it has been profoundly affected by the dramatic rise in sea level over the last 10,000 years. At the end of the most recent cold phase of the Ice Age, the River Thames and its tributaries flooded seasonally over wide, braided floodplains. The rise in sea level flooded the Channel, turning the lower river valleys of the Thames and its tributaries into tidal estuaries. The sea level did not rise continuously, however, and small drops in sea level are marked by layers of peat in the sediment. The peat layers are the remains of plants which colonised the exposed mud flats when sea level dropped, only to be buried by silt and clay when the sea level resumed its rise once more. The last peat layer dates from the third or fourth century AD, when sea-level rise destroyed several Roman forts built on the coast.
Away from the estuaries, most of the coastline consists of large expanses of mud flats and salt marshes, although much of the original marsh has been drained for agriculture. The coast between Southend-on-Sea and Dengie (30 km to the northeast) is typical: salt marsh is separated from intertidal mud flats by chenier ridges. These are raised ridges almost totally composed of seashells, which can be up to 3 m high and 25 m wide. They mark the transition between land and shore, since they are formed when shells are thrown up onto the salt marshes by storm-whipped waves. The ridges are moving landward at up to 8 mm a year due to continuing sea-level rise in this area.
Sea-level rise poses an important problem for the London area. Due to a combination of subsidence and global sea-level rise (estimated at ≈1–2 mm a year since 1900), levels are rising in the Thames estuary by about 60 cm a century, relative to the land.
After the 1953 flood of the east coast and Thames Estuary, when some 300 people were killed, it was decided to build the Thames Barrier (Fig. 185). This is situated at Woolwich and has six moveable gates which can be raised in minutes if needed. It was built between 1972 and 1984, and was designed to be effective until at least 2030. Many longer-term solutions to protect London are also being considered. One recent proposal is for a 16 km (“ten-mile”) barrier from Sheerness in Kent to Southend in Essex, in order to protect a much more extensive section of the Thames Estuary (Fig. 180).
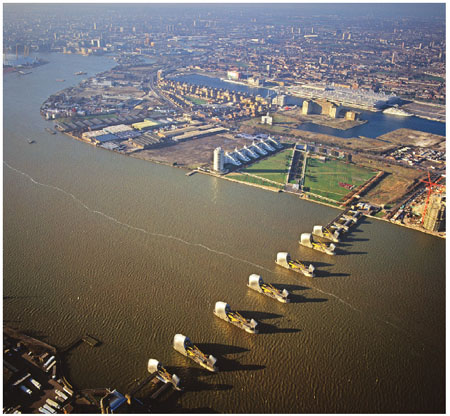
FIG 185. The Thames Barrier. (Copyright Dae Sasitorn & Adrian Warren/www.lastrefuge.co.uk)
AREA 10: THE COTSWOLDS TO READING
Area 10 straddles the main topographic and drainage divide of Southern England (Figs 186 and 187). About half of it is part of the Thames catchment and drains eastwards, via London, to the North Sea, while its western areas form parts of the Bristol Avon and Severn catchments, which drain into the Bristol Channel, and its southern part (Salisbury Plain) drains southwards towards the South Coast (Fig. 188).
The Area can be divided into four Landscapes based upon the presence of particular bedrocks immediately below the surface blanket (Figs 189 and 190). The large-scale features of the bedrock pattern, as shown by the locations of the Chalk hills, have already been explained in the general introduction to this Region. The more detailed pattern has been created largely by river erosion, which has modified the gently sloping limbs of the London Downfold and transported material to the east. In particular, the locations of the Chalk Edges are entirely due to the interaction of earth movements and landscape erosion over the past 60 million years, influenced especially by climate change.
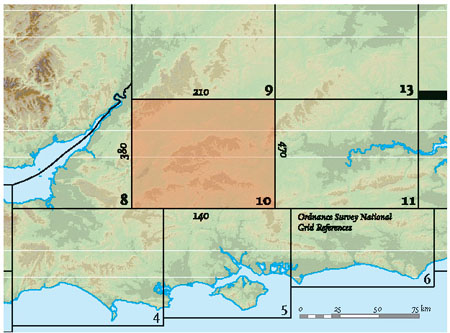
FIG 186. Location map for Area 10.
The bedrock of Area 10 ranges from Jurassic to Early Tertiary in age (Fig. 189), and the distinctive patterns of hills and valleys in each of the four Landscapes correspond directly to the different bedrocks that underlie them. Each Landscape is considered in turn below.
Landscape A: The Cotswold Hills of Middle Jurassic limestone
The upper Thames and Avon valleys are bordered in the northwest by the Cotswold Hills, which trend roughly northeast from Bath (see Area 8), across the corner of Area 10 towards Northamptonshire (see Area 9). The Cotswolds are formed of Middle Jurassic layers, often oolitic and shelly limestones with an average thickness of about 100 m. They dip very gently southeast, forming a series of rolling plateaus or ‘wolds’ dissected by narrow, wooded valleys. To the southeast the valleys widen and the landscape becomes gentler as the limestone layers slope very gently beneath the clays of Landscape B. In Area 10, Stroud and Cirencester are the main Cotswolds towns, and they were important centres of the wool industry during the Middle Ages. The fine, honey-coloured Cotswold Stone houses can still be seen in town centres today, along with fine ‘wool churches’, built in the late Middle Ages when the economy of the region was very strong.
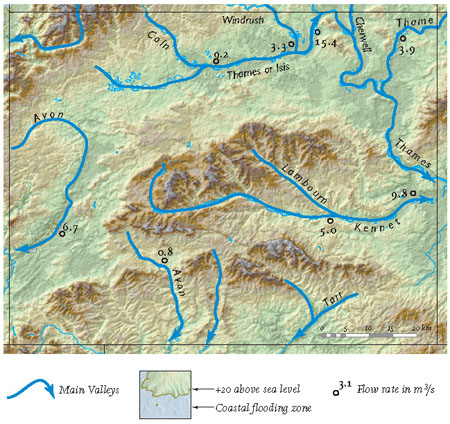
FIG 188. Main river pathways and flow rates for Area 10.
Around Stroud it is remarkable how much of the highly sloping landscape of the Cotswold Edge appears to conceal large masses of limestone that have become displaced and moved down-slope, under gravity, as the slopes have been evolving by erosion. The most vigorous of these collapse movements are likely to have taken place during the Ice Age under periglacial conditions, when freeze-thaw processes were most active.
Landscape B: The Mudstone Lowlands of Late Jurassic to Early Cretaceous bedrock
The Wiltshire and Oxfordshire Clay Vales form much of the northernmost part of Area 10, extending roughly from Trowbridge, via Cirencester (b1), to Oxford (b3) along the path of the Thames. The Vales consist of a broad belt of open, relatively low-lying, gently undulating farmland underlain by blue-grey Oxford and Kimmeridge Clays of Late Jurassic age They are part of a larger belt of clay-dominated lowlands that link eastwards with the Cambridgeshire Late Jurassic-Early Cretaceous Greensand-Gault belt (Landscape B of Area 13). The clays of the Vales weather into heavy, wet, slightly calcareous soils which support wide expanses of hedge-lined pasture.
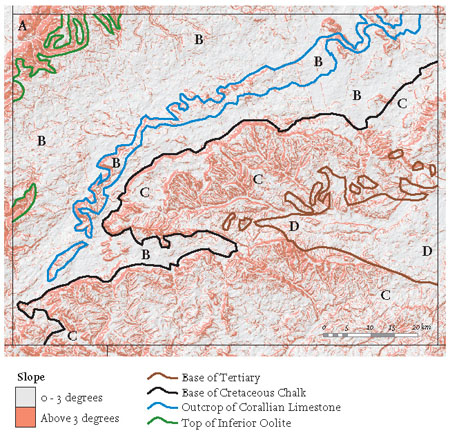
FIG 189. Slope map of Area 10, showing important bedrock boundaries and Landscapes A to D.
The centre of the Oxfordshire Clay Vale is dominated by the valley of the River Thames, flanked by Quaternary gravel deposits derived from the Cotswolds. The largest towns tend to have grown on these free-draining gravels. The surrounding floodplain consists of Jurassic clay mantled by a substantial layer of more recent river sediments, providing excellent arable farmland. Over the past few hundred years farmers have planted hedges and pollarded willows to divide the area into a very distinctive patchwork pattern of fields, thought to have inspired Lewis Carroll’s ‘chessboard’ landscape in Through the Looking-Glass.
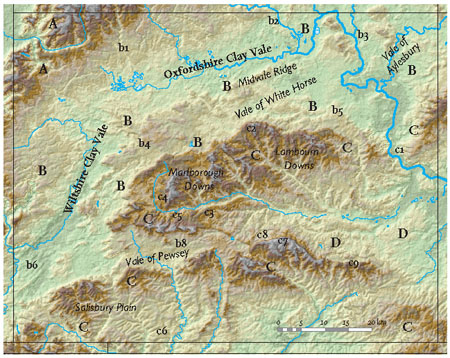
FIG 190. Landscapes, Downs, Vales and localities (b1, b2 etc.) of Area 10.
As well as offering ideal ground for building, the Quaternary gravel deposits have also been exploited as a ready source of aggregate for road building and the construction industry. In the regions south of Cirencester (b1), southeast of Whitney (b2) and north of Oxford (b3), active gravel workings and flooded former gravel pits have become locally extensive features of the landscape. These gravel pits are clearly visible on the maps, particularly south of Cirencester, where an area some 7 km across has been designated as the Cotswold Water Park. Many of these areas of man-made lakes are now being managed as nature reserves, or have been turned into lakeside housing developments.
The character of the River Thames has changed dramatically over the last 2.6 million years of Quaternary time. Like all rivers that are only constrained by resistant bedrock in a few localities, it has changed its course many times, switching back and forth across a floodplain that is also continually changing. By studying the record of these changes preserved in the Thames terrace gravels, geologists have been able to reconstruct the later drainage history and climate of the Quaternary for much of Southern England. The evidence shows that the Thames was a much greater river at times in the past than it is today. There are also indications that, prior to the uplift of the Cotswolds, its headwaters may once have drained wider areas of the West Midlands and even north Wales (see Chapter 6). During cold episodes of the Ice Age, when sea level was much lower than it is today, the river also extended eastwards over what is now the floor of the North Sea, following the axis of the London downfold to join the Rhine, before flowing southwards and westwards along the valley of what is now the English Channel (see Chapter 2).
At least nine distinct gravel terraces, each at a different height above sea level, have been identified in the Thames Valley generally (see Area 11), and attempts have been made to link these terraces to the climate record inferred from oxygen isotope data (see Chapter 2, Fig. 13). The dating of individual terraces remains controversial, but a recurrent cycle of climate change and terrace formation is generally assumed, consisting of alternating cold and warm episodes:
Cold episodes: High river flow rates, at least during spring melts, lead to down-river transport of coarse gravel sediment and channels with high erosive power. The river is able to build up gravel on its floodplain or cut downwards into its floodplain, depending on elevation, which is determined by the sea level at the time.
Warm episodes: Lower flow rates and less powerful rivers, associated with temperate climates, deposit finer-grade sediments. A relative rise in sea level, due to the warming climate and melting of ice sheets, results in flooding of the lower parts of river valleys and the deposition of estuarine and marine sediments. The lower reaches of the river become clogged up with silt. As the next cold phase begins, there is an increase in river discharge and erosion, and the river begins to cut down into its floodplain.
In addition to the vertical movements of the river and floodplain surface described above, the upper Thames has also switched its course back and forth across the Vale of Oxfordshire, constrained by the Cotswold Hills to the north and the Midvale Ridge to the south. The gravel terraces are therefore widespread, distributed horizontally as well as vertically, and their ages vary.
The River Thames now drains eastwards along the Oxfordshire Clay Vale before turning north and then south as it cuts through the Midvale Ridge at Oxford, entering the Vales of White Horse and Aylesbury. In this area, the patchy nature of the oldest (and highest) Quaternary gravels has, in places, protected the underlying Oxford Clay from further erosion, resulting in a series of scattered tabular hillocks rising above the present-day floodplain. The Thames then cuts through the Chalk Downs at Goring Gap (c1; Fig. 191), which was probably initiated when a tributary of the middle section of the Thames cut through the northern Chalk rim and intercepted the drainage of the ancestral northern clay vales. It is generally believed that the Thames was constrained within the Goring Gap half a million years ago, when its course much further downstream in the St Albans area was deflected southwards to its present position by the arrival of the Anglian ice sheets.
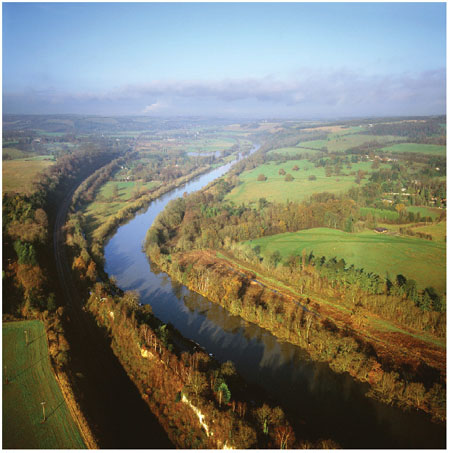
FIG 191. The Goring Gap (Fig. 190, c1), looking north (upstream) along the Thames from near Pangbourne. (Copyright Dae Sasitorn & Adrian Warren/www.lastrefuge.co.uk)
In the west of Area 10, the Wiltshire Clay Vale occurs between the dip slope of the Cotswolds to the west and the Marlborough Downs to the east. To the south the Vale extends past Trowbridge and Fro me (Area 8) to join with the clays of Blackmoor Vale and the Vale of Wardour, described in Area 4.
The Wiltshire Clay Vale is primarily underlain by the Late Jurassic Oxford Clay, which gives the area a subdued, undulating topography and heavy, wet soils. In the west, substantial outcrops of rather older sandy bedrock (called Kellaways Sand) produce rich, free-draining soils that are highly valued as arable farmland. The centre of the Vale is dominated by the wide, level floodplain of the Bristol Avon, which, despite modern agricultural development, still retains traces of an ancient pattern of flood meadows. Surface sediments include river deposits of fine-grained alluvium and terrace gravels. The eastern margin of the Vale is marked by a resistant band of Late Jurassic Corallian Limestone and Early Cretaceous Greensand – equivalent to the Midvale Ridge of Oxfordshire – which is backed by the Late Cretaceous Chalk scarp of the Marlborough Downs.
The market towns and villages of the area are particularly distinctive. A number of valuable building stones are available locally, from the warm, yellow Middle Jurassic Cotswold Stone in the northwest to the rough, brown Late Jurassic Corallian Rag from the east. Ancient towns such as Malmesbury, Chippenham, Melksham and Trowbridge, all of which became wealthy due to the thriving post-medieval wool trade, have made full use of these attractive stones, and their town centres are filled with beautiful historic buildings.
At Wootton Bassett (b4), south of the M4 motorway and just southwest of Swindon, the clays of the Wiltshire Clay Vale region have produced a geological phenomenon that is extremely rare in Britain – a series of mud-springs. The springs are situated in a small wood called Templar’s Firs, and were first described as three domed ‘blisters’ some 10 m long by 5 m wide by 1 m high. The skin of the blisters was formed by matted vegetation and contained a core of liquid mud which oozed out of any fissure in the skin and into a nearby brook. The blisters have since been burst by inquisitive visitors, but the springs themselves remain. Surveys have shown that the vents contain liquid mud down to a depth of at least 6 m, and that the volume of the underlying mud chamber is much larger than originally anticipated: local farmers have stories of cattle drowning in the springs and, in 1990, in an attempt to block up the main spring for safety reasons, a local contractor dumped 100 tonnes of quarry rubble into the main vent. Within half an hour the stone had disappeared without a trace and the displaced mud spilled out over the surrounding countryside, blocking a nearby stream. The area has since been fenced off and warning signs posted.
The exact cause of the Wootton Bassett springs is controversial, but they appear to result from a combination of local bedrock structure and particular rock types. The springs emerge through the Late Jurassic Ampthill Clay Formation. Underlying this clay is a layer of permeable Corallian Limestone, which acts as an aquifer in which water migrates to the lowest part of a local downfold, where it escapes upwards when the water pressure is sufficient. When the water emerges at the surface it moves the surrounding muddy material upwards with it.
Further east, the Midvale Ridge forms a southern limit to the Oxfordshire Clay Vale. It can be traced from southwest to northeast, running from Chippenham, through Swindon and on towards Oxford. The ridge is formed mainly of sandy Corallian Limestone of early Late Jurassic age, although locally there are also patches of latest Late Jurassic Portlandian sandstones and limestones. These hills are in places capped by a layer of Early Cretaceous Lower Greensand, which has prevented the weathering and erosion of the limestone below, forming prominent sandy knolls. Broadly speaking, the ridge has a tabular profile and, in contrast to the surrounding clay vales, the soils are sandy, light and free-draining, home to scattered woodlands interspersed with sandy pastures.
The Midvale Ridge has a long history of human settlement, and there are a number of important Roman sites located on prominent areas of higher ground. More recently, the small villages and hamlets typical of this region have been built upon spurs and subsidiary low ridges, using locally occurring Corallian Limestone as the main construction material. The area is attractive and offers fine, commanding views over the clay vales to the north and south.
To the south of the Midvale Ridge is the Vale of White Horse. As with much of Area 10, the rocks here dip gently to the southeast, exposing Late Jurassic Kimmeridge Clays along the northern sides of the Vale, followed by Early Cretaceous Gault Clay a little to the south. These rock types produce typical low-lying clay-vale scenery, though this is punctuated in places by prominent-weathering outcrops of Portland limestone. The southern margin of the Vale, immediately north of the Chalk scarp of the Lambourn Downs, is underlain by Early Cretaceous Upper Greensand (mudstones and sandstones), which supports rich orchards in the vicinity of Harwell (b5).
The Vale of White Horse drains generally eastwards to join the Thames at Abingdon. Like that of the Thames, this floodplain offers fertile arable farmland and frequent gravel deposits, upon which many of the area’s towns were first settled. Buildings in the Vales of the Upper Thames are often brick-built, reflecting the widespread use of local clay as a building material. This contrasts with the Wiltshire Vale to the west (see page 248), where local limestones were extensively used as building stones.
The City of Oxford (Fig. 192) probably started to grow because of the strength of the local farming economy and its role as a transport hub, located where the River Thames cuts through the Midvale Ridge. Its ancient heart rests on a tongue of Quaternary gravels that have formed terraces where the Thames and its tributary the Cherwell run parallel to each other before joining.
It is interesting to compare landscape features of Oxford with those of England’s other ancient university town, Cambridge (see Area 13). Oxford’s large eastern and southern extension from Headington to Cowley is relatively new, and reflects major industrial development in the early twentieth century that largely passed Cambridge by. There is also a considerable difference in the scale of the development of the ancient parts of the two cities, perhaps due to the importance of the river link with London in the case of Oxford. However, it also seems to reflect the difference in scale of the rivers and the terraces that have provided the frameworks for growth. The Thames some kilometres north of Oxford has a mean flow rate of 15.4 m3/s, draining 1,609 km2 of catchment (Fig. 188), whereas the Cam in Cambridge has a much smaller mean flow rate of only 2.8 m3/s from 762 km2 of catchment (see Chapter 8, Fig. 230). So the altogether smaller size of the Cam, both in flow rate and in the size of its catchment, has strongly influenced the size and number of branch water courses constructed, and the scale of the terrace and bedrock hill topography.
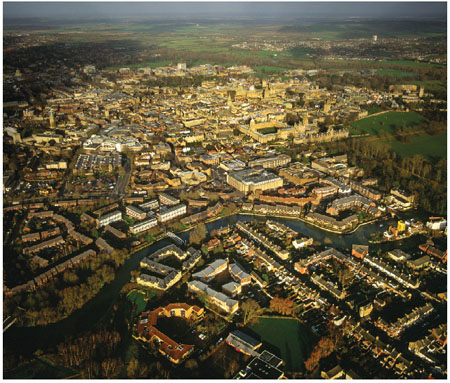
FIG 192. Looking northwards across the City of Oxford, with the Thames (or Isis) flowing from left to right across the foreground. Beyond that is the ancient centre of the city, with Christ Church Great Quad acting as a landmark, with grass in the quad and Tom Tower on its left side. (Copyright Dae Sasitorn & Adrian Warren/www.lastrefuge.co.uk)
The Vale of Pewsey (b7) separates the Marlborough and Lambourn Chalk Downs from the Chalk of Salisbury Plain to the south. The Vale is characterised by lush orchards and meadows and gently undulating lowlands, in contrast to the Chalk scarps and uplands to north and south. The Vale is aligned roughly parallel to a broad upfold or anticline running from Trowbridge (b6) eastwards, formed during the mid Tertiary. Following this crustal movement, the Chalk at the crest of the anticline has been eroded away, exposing the Early Cretaceous Upper Greensand. Subsequent erosion has focused on the relatively softer Greensand, carving a broad, gentle valley with fertile, sandy soils.
.Landscape C: The Downs of Late Cretaceous Chalk
The Marlborough and Lambourn Downs, stretching across north Wiltshire and Berkshire, are a region of high, rolling hills underlain by Late Cretaceous Chalk. The Chalk dips gently to the south and southeast and has a dramatic northern edge overlooking the Vale of White Horse. In most cases along this northern edge the upper Chalk appears to have provided more resistance to erosion than the lower Chalk materials, so that it forms the lip of the steep slopes. However, particularly in the Marlborough Downs and just south of Harwell (b5), hill features of intermediate height have also been eroded into the lower Chalk levels.
Within the Chalk hills, a complex network of dry valleys or ‘coombes’ seems to have formed during glacial times, when the subsurface was permanently frozen to a depth of several metres. The ice sealed the fractures that normally make the Chalk such a permeable bedrock, resulting in poor surface drainage, slope collapse and erosive surface streams. The dry valleys may be divided into two types: edge valleys that cut into or across the Chalk edge itself, and dip-slope valleys that dissect the Chalk down-slope, away from the edge. Edge valleys show the greatest variability in size and shape, ranging from shallow depressions to deeply incised cuts. They are generally aligned approximately perpendicular to the Chalk edge, and their morphology is controlled principally by the width of the escarpment. Complex, multi-branching systems tend to develop where the zone is broad, while straight, simple coombes tend to be found where the scarp is high, straight and steep. Dip-slope coombes are typically longer than those on the scarp face and often form well-developed, branching valley networks. Near the edge, the dip-slope valleys are shallow and gentle, and the resulting landscape smooth and rounded. Further down dip, as the streams on frozen ground increased in volume and power, the valleys became deep coombes with steep sides. Both classes of dry valley have a broadly U-shaped cross-section.
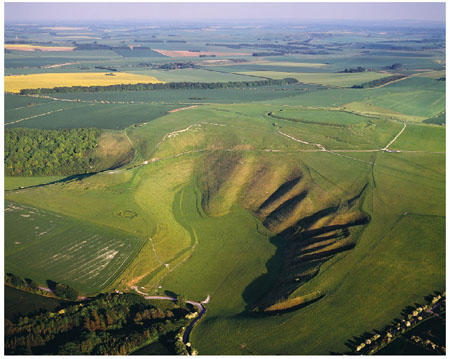
FIG 193. The Manger (Fig. 190, c2), a dry valley in the Chalk scarp at Uffington. (Copyright Dae Sasitorn & Adrian Warren/www.lastrefuge.co.uk)
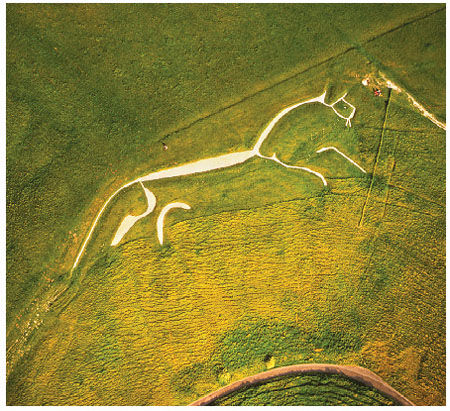
FIG 194. The White Horse (Fig. 190, c2) at Uffington. (Copyright Dae Sasitorn & Adrian Warren/ www.lastrefuge.co.uk)
When the ground thawed after the last (Devensian) cold phase of the Ice Age, the streams that carved these valleys soaked away into the permeable Chalk bedrock and the valleys were left dry. The lower portions of many of these valleys are considered too steep to be worth farming, and it is here that the last remnants of the original chalk grassland can be found, sometimes supporting several species of rare orchids. Perhaps the most famous dry valley in this area is the Manger (c2), with distinctive flutes on its slopes where the chalk has slumped downwards (Fig. 193). The White Horse at Uffington (Fig. 194) is nearby, and according to local folklore the Manger is the spiritual abode of the white horse, which on moonlit nights would travel here to feed. Up until recently, the steep valley sides were also the venue for local cheese-rolling competitions, held during a two-day festival once every seven years called the ‘Scouring of the White Horse’. The floor of the Manger contains thick deposits of Chalk rubble and silt that slumped and washed down-slope under freeze-thaw climate conditions. Careful dating of similar sediments elsewhere in Southern England (see Area 7) has shown that steep Chalk slopes like these were last active during the warming times after the Devensian cold episode.
In general, the Chalk produces light, free-draining, thin soils supporting wide expanses of open chalk grassland. This helps to explain why the area around Lambourn in the Berkshire Downs has become one of England’s main centres for race-horse training, with exercise ‘gallops’ and stables scattered over much of the Landscape.
Over much of the dip-slope of the Chalk, the surface is underlain by a layer of Clay-with-flints, an insoluble, clayey residue with flints left behind after the upper layers of the Chalk had been dissolved by chemical erosion. Clay-with-flints gives richer, more acidic soils than the surrounding chalk grassland and is capable of supporting large tracts of woodland. An example is Savernake Forest (c3), to the southeast of Marlborough, which is believed to be very ancient.
Another common feature of these Downs are the scattered sarsen stones or greyweathers (Fig. 195). It has been suggested that the sarsen blocks are relicts of local patches of Early Tertiary sandstone which developed a hard silica cement and so resisted erosion while the surrounding, less-cemented and softer sandstones were worn away. These isolated blocks of weathered Tertiary sandstone are often found incorporated into ancient burial mounds or into the foundations of the area’s oldest houses. Glacial solifluction processes have transported these blocks downhill, and they are often seen to be concentrated in lines at the bottoms of dry valleys. The sarsens are thought to have come from the Tertiary Reading Formation, a greyweathering sandstone which outcrops as bedrock in a narrow band in the east of Area 10. The wide distribution of sarsen stones across the Chalk Downs suggests that Tertiary sediments used to be much more widespread than they are today across Area 10, but have since been eroded away.
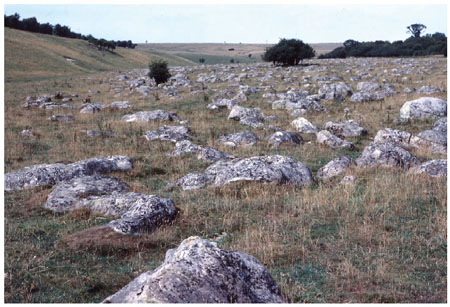
FIG 195. Sarsen stones on Fyfield Down (Fig. 190, c5). (Copyright Landform Slides – Ken Gardner)
Area 10 has a long and archeologically important history of human settlement, often strongly influenced by the bedrock geology. The Marlborough Downs region includes many of the most spectacular ancient sites (such as Avebury, c4) linked together by the Ridgeway, an ancient travellers’ route from Dorset to the Wash running along the top of the northern Chalk escarpment. This route has been in more or less constant use since at least Neolithic times, around 5,000 years ago, and was presumably chosen because the permeable and well-drained Chalk offered a more direct and reliable all-weather route than the neighbouring clay vales, which were probably densely wooded and marshy. Today the Ridgeway is maintained as a popular long-distance walking path running from Avebury to the northeast, providing an excellent route through some of the most spectacular chalk downland scenery in Southern England.
North of the village of Pewsey, on the southern edge of the Marlborough Downs, is Fyfield Down (c5), an easily accessible area of chalk downland with one of the highest concentrations of sarsen stones in the country (Fig. 195). Stones from this area have been used in the construction of Avebury stone circle (c4) and in megalithic monuments at the famous Stonehenge (c6).
To the south of the Vale of Pewsey is Salisbury Plain, the largest single piece of unimproved chalk grassland left in northern Europe. Since the early part of the twentieth century, much of the Plain has been reserved by the Ministry of Defence for military training purposes, while the surrounding downlands have been extensively modified by agricultural intensification. The downland landscape is of vast, rolling arable fields and unimproved chalk grassland, punctuated by small hill-top woodlands of beech and conifer. The northern and western margins of the Plain are clearly marked by a steep, near-continuous edge overlooking the Upper Greensand of the Vale of Pewsey and the clay vales of the River Avon. As with the Marlborough Downs, a patchy blanket of Clay-with-flints mantles the Chalk in places, often supporting scattered stands of woodland. The Late Cretaceous Chalk slopes very gradually (slightly more than 1 degree) to the southeast, away from the upfold in which the Vale of Pewsey has been eroded.
For the most part, Salisbury Plain is without surface water, providing the typical open scenery associated with the Stonehenge area (c6). There are, however, a few streams, such as the Hampshire Avon, that drain the plateau. These streams are often deeply incised into the Chalk, with valley bottoms that are lined with gravels and alluvium sourced from the Plain and large numbers of regular side valleys, giving a distinctive branching pattern on the slope map (Fig. 189). Trees have taken advantage of the nutrient-rich soils along these valleys, and the contrast between open chalk grasslands and occasional wooded river valleys is a striking characteristic of this region.
North of Andover and east of Salisbury Plain, the further continuation of the Chalk hills is called the Hampshire Downs. Their northern margin forms a very clearly defined edge that includes Walbury Hill (c7), which, at 297 m, provides clear views to the north across the Early Tertiary bedrock of Landscape D. Close to the edge of this Tertiary material, local upfolds at Shalbourne (c8) and Kingsclere (c9) have brought Early Cretaceous bedrock upwards to be level with the Late Cretaceous Chalk. These upfolds can be regarded as a continuation of the Vale of Pewsey structure further west.
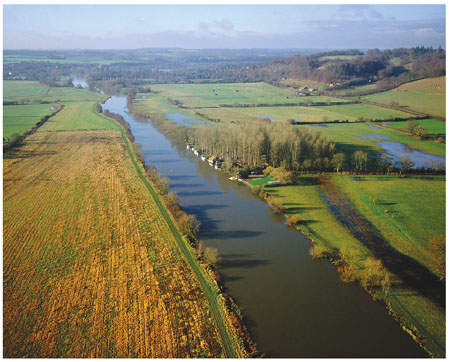
FIG 196. The River Thames just upstream from Reading and downstream from Pangbourne. (Copyright Dae Sasitorn & Adrian Warren/www.lastrefuge.co.uk)
Watership Down, made famous as the title of Richard Adams’ 1972 book, is a north-facing Chalk edge south of Newbury, on the southerly-sloping (at about 3 degrees) fold limb of the Kinsclere Upfold (c9). The northern limb of the upfold slopes more steeply, at about 25 degrees to the north, showing that the general movement there was down towards the north. This sense of local movement is consistent with the movement that might be expected on the northern edge of the large London Basin downfold (Fig. 182).
Landscape D: The Kennet Valley with Early Tertiary bedrock
The final Landscape of Area 10 is defined by its bedrock of Early Tertiary sediments, marking the western end of the London Basin downfold (Figs 180 and 182). The town of Reading has grown where the River Thames emerges from its valley incised into the Chalk to the north and first meets these Tertiary sediments (Fig. 196). The sediments are largely flat-lying except locally, along the southern margin of the Basin, where they have been tilted by folding in the Kingsclere upfold (c9). The River Kennet is the central drainage feature of most of this Landscape, although further west its headwaters and tributaries (particularly the Lambourn) drain large valleys with numerous dry side branches in the Chalk Downs.
The Early Tertiary sediments consist of between 100 and 200 m of muddy and sandy sediment. Some of this was deposited by streams and in swamps, but most of it, particularly the London Clay, accumulated in what appears to have been an arm of the sea occupying the London Basin.
To the south, topographic surfaces in the Chalk Downs have been suggested to represent coastal erosion peneplains formed at about 200 m above sea level about 5 million years ago (Late Miocene or Pliocene), but the definition of the surfaces, and their age, are very speculative.
Many of the slopes visible in the slope map (Fig. 189) on the valley floors in this Landscape are clearly the result of river erosion into Early Tertiary or Chalk bedrock. In some cases they may be fragments of earlier river floodplains now represented as terraces. These have been mapped and correlated with the ‘staircases’ of terraces identified in the middle and upper Thames (see Fig. 192 and Landscape B respectively). It is relatively easy to distinguish some of the higher floodplains as dating from the Anglian glacial (about 470,000 years old), and lower ones as post-Anglian, representing episodes in the Late Pleistocene history, although local correlations are difficult to confirm in many cases. Despite the difficulties, the way the River Kennet has generally cut downwards through time and climate cycles is clear.
AREA 11: LONDON
One hundred years ago, more people lived in London (Figs 197 and 198) than in any other city on Earth. Although London now rates as only fifteenth in a recent survey of the populations of the world’s cities, it is indisputably still one of the greatest in terms of its historical and economic importance. In fact, a recent report based on the 2001 British census suggests that, in economic and social terms at least, the whole of Southern England can be regarded as fringing Greater London!
The proportion of the ground covered by buildings, roads and railways in London is so great that it often obscures the local landscape (Fig. 199). It is therefore necessary, in the maps, to take away the layers of man-made ‘cover’, in order to see the natural features beneath.
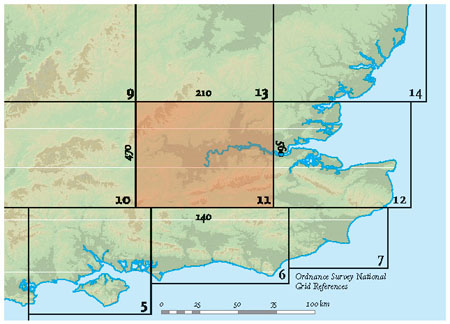
FIG 197. Location map for Area 11.
As Figures 200 and 201 show, London has grown in the natural basin created by the Chiltern Hills to the northwest and the North Downs to the south. The centre of this basin, including most of Greater London, is dominated by the River Thames and its floodplain, along with a number of isolated hills. In spite of the remarkable growth of Greater London, the river still dominates the scenery at its heart, and has created most of the local slopes and hilly viewpoints. Towards the west end of the basin, around Bracknell, are the Thames Basin Heaths, while to the east the River Thames broadens out into a wide estuary (Area 12). The Thames and its estuary have been key factors in London’s remarkable growth and development.
I have divided this Region into seven Landscapes, indicated by the letters A to G on Figure 201.
Landscape A: The Vale of Aylesbury
This Landscape is defined largely by its low elevation relative to the Chiltern Hills to the southeast. The bedrock consists of largely Late Jurassic mudstone (mainly Kimmeridge Clay and Portland Beds) covered by mudstones of the Early Cretaceous Gault Clay, so it is not surprising that the land is relatively low-lying and lacks obvious topographic features. This Landscape links with more mudstone lowlands to the west (Landscape B of Area 10) and with the Clay-Greensand-Gault belt to the northeast (Landscape B of Area 13).
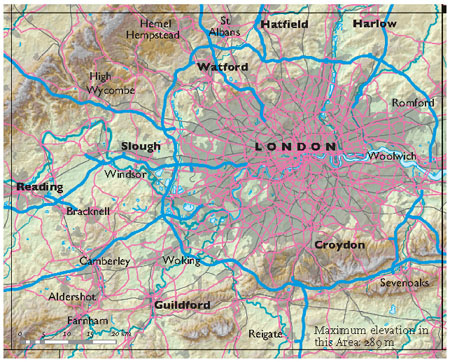
FIG 198. Natural and man-made features of Area 11.
Landscape B: The Wealden margin
South of the spectacular Chalk hills of the North Downs, there is a distinct belt of hills formed because of the resistance to erosion of the Lower Greensand of Early Cretaceous age. The Greensand is rich in quartz grains held together by mineral cement, and seems to have resisted erosion more effectively than the overlying and underlying mudstones. In fact, the Greensand has resisted erosion so well in this Area that Leith Hill (b1) has an elevation of about 290 m – distinctly higher than the Chalk hills of the North Downs (Landscape D), which reach a height of only 173 m at Box Hill (d4). The Greensand has again resisted erosion to the east of the River Mole, south of the M25 and M26 motorways, and the resultant hills reach over 200 m in elevation south of Sevenoaks.
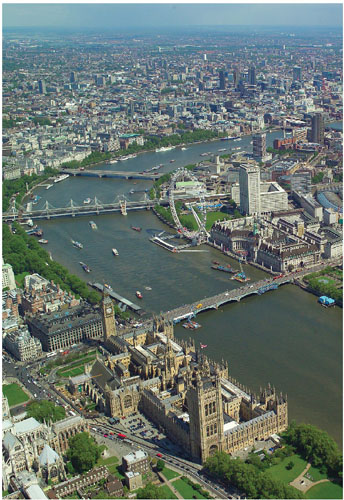
FIG 199. View from Westminster over central and eastern London, looking along the Thames towards the sea. (Copyright London Aerial Photo Library)
South of the Lower Greensand ridge, earlier Cretaceous bedrock has again influenced the topography, particularly towards the centre of the Weald Uplift. Here the tough, sandstone-rich Hastings Beds create more hilly topography, surrounded by the more readily eroded Weald Clay. As described more fully in Area 6, the hills here are prominent, but lack the linear pattern of the Lower Greensand ridge to the north.
Landscape C: The Chiltern Hills
The Chilterns are the northeasterly continuation of the Marlborough and Berkshire Downs (Landscape C of Area 10). The Chalk bedrock that has produced the Chilterns slopes gently downwards to the southeast beneath the London Basin and has been eroded to produce distinctive features in the Chiltern scenery. The first of these is the Chiltern Edge (c1), which faces to the northwest and results directly from the greater strength of the chalk material, in the face of river erosion, compared with the older and weaker underlying mudrocks. Southeast of the scarp, the Chiltern plateau (c2 and c3) dips very gently to the southeast and is divided into distinct sectors by a remarkable series of branching, largely dry valleys, picked out beautifully in Figures 201 and 208. These dry valleys were formed during Ice Age times when freezing of the ground mobilised the near-surface Chalk and prevented water from soaking away, creating surface streams that cut downwards into the plateau. Railways and roads heading northwest from London make good use of these valleys to take travellers across the Chilterns, avoiding the steepest slopes and highest ground.
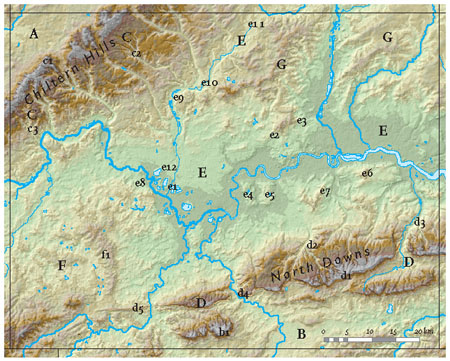
FIG 201. Map of Area 11, showing Landscapes A to G and localities (b1, c1 etc.) mentioned in the text.
The Chiltern plateau is unlike other Chalk uplands in that it is often very heavily wooded, lacking the airy, open character of the Berkshire Downs a short distance to the southwest. Indeed, the region supports the most extensive beech woodland in the country, including examples of ‘hanging woodlands’ where trees thrive even on the steep slopes of dry valleys. This difference is due to a combination of natural and human factors. Firstly, ice sheets never extended from the north to cover the Chiltern plateau, although further east they did extend well into the London Basin. This means that the Chilterns were able to develop and preserve a thick weathering blanket of Clay-with-flints, covering the plateau with soils that have encouraged vegetation more actively than the typically thin Chalk soils in other areas. Secondly, during the eighteenth and nineteenth centuries, beech trees were planted and managed here in order to supply the rapidly growing furniture industry then developing in London. This contrast between thick forests and more typical Chalk grassland gives the Chilterns a very distinctive charm.
Landscape D: The North Downs, Hog’s Back and Greensand
The North Downs form the southern limb of the London Basin Syncline or downfold (Fig. 202). Here the upper surface of the Chalk slopes gently to the northwest, just as the Chilterns form the northern limb and slope to the southeast. Otherwise the Chalk hills of the North Downs have much in common with the Chilterns, though there are some important differences. In the east they are broad – similar in width to the Chilterns – extending further east into Area 12 and ultimately reaching the coast between Folkestone and Deal. To the west, the hills narrow dramatically, and there is a very distinctive scarp facing southwards (e.g. at Botley Hill, d1). These features reflect the form and position of the Chalk bedrock layer that underlies the Downs, influenced by its long history of folding and faulting.
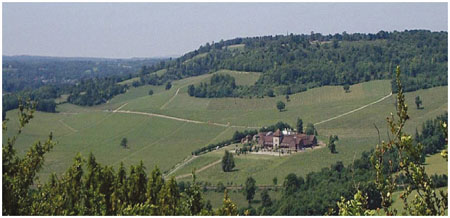
FIG 202. The Chalk scarp of the North Downs, as seen from Box Hill near Dorking (Fig. 201, d4). Denbies Vineyard is on the south-facing slope beneath. (Copyright R. C. Selley, 2004. The Winelands of Britain, Petravin Press)
The clearly branched dry valley patterns cut into the Chalk hills are similar to those of the Chilterns. Two very clear examples are the valley that provides the main railway and road route across the scarp between Croydon (d2) and Reigate, and, further east, the large valley of the River Darent (d3), now paralleled by the M25.
A very distinct difference compared with the Chilterns is the presence of a second clear scarp to the south of the Chalk scarp, due to erosion of a bedrock layer lower than the Chalk in the bedrock succession. This Lower Greensand layer is part of Landscape B, just described above.
In the western part of the area, particularly west of the centre of Guildford, is the Hog’s Back (d5), a remarkably straight Chalk ridge that separates the Thames Basin in the north from the Wealden area in the south. The crest of the ridge rises up to 70 m above the ground to the north and is capped by the A31 road. The ridge is an eroded stepfold or monocline that represents the transition between two major asymmetric folds: the London Basin downfold or syncline to the north, and the Weald Uplift or anticline to the south (Fig. 203). The reason for the narrowness and the straightness of the Hog’s Back ridge is the presence of large faults beneath this region, separating the London Basin from the Wessex Basin (see the general introduction to this chapter). Movement along these faults, combined with compressional folding, has rotated the strong Chalk layer so that, in places, it is now sloping at up to 55 degrees to the north. As a result of this, the Chalk outcrops at the surface in a long, narrow band cut by straight fracture surfaces. Because the Chalk is strong, and sloping in this way, it has resisted river erosion more successfully than the softer material to the north and south, so producing this prominent ridge.
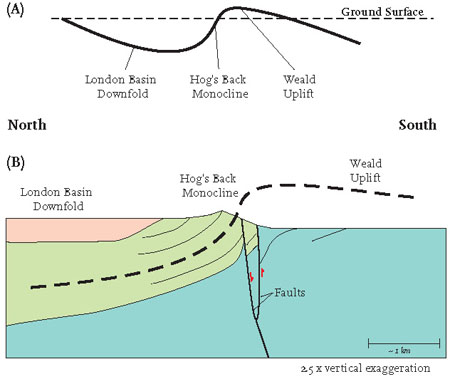
FIG 203. Sketch sections showing (A) the location of the Hog’s Back monocline in the overall fold pattern and (B) more detailed pattern of folding and faulting around the Hog’s Back.
Landscape E: The Thames Valley and the London hills
In the Early Tertiary, sands and marine muds were deposited over the Chalk in the centre of the London Basin downfold, forming bedrock deposits such as the London Clay and Bagshot Beds that underlie much of London. Later crustal compression in Middle Tertiary times involved further gentle movements of the downfold, along with steep folding over a few localised faults, which produced structures such as the Hog’s Back.
Landscape erosion then picked out the harder Chalk on the north and south edges of the basin, creating the Chilterns and North Downs. This created a drainage network that focused river erosion on the central part of the basin. In time, the ancestors of the Thames, Colne and Lea developed to form the main stems of today’s branching river pattern (Fig. 200). These rivers have cut progressively downwards into the Tertiary bedrock, forming floodplains with alluvial sediment at a variety of different levels, often described as a ‘staircase’ of river terraces. The staircases provide a record of the river history of the London Basin over the past million years or so.
The terraces form much of the flat land upon which Greater London is built. Slough (e12), for example, has been constructed upon the ancient Boyn Hill Terrace and sits above the level of the present-day floodplain. The terraces also contain extensive deposits of sand and gravel that have long been worked and used as a source of aggregate. The abandoned gravel pits (e1) have often filled with water and in time become valuable wetland habitats, recreational parks and water treatment works, such as those in the vicinity of Heathrow Airport (e1), and between Windsor (e8) and Richmond Hill (e4). The Quaternary terraces of the Thames Valley are amongst the best studied in the country and provide an excellent record of the switching of the River Thames back and forth across its floodplain. In addition, the terraces in the lower reaches of the Thames record the most recent rise in sea level associated with the end of the last (Devensian) cold episode, which flooded the lower Thames Valley to form the Thames Estuary.
Each terrace deposit is the remains of a sheet of old floodplain material that formed when the river was flowing at the level of the terrace. Each step of the staircase reflects an episode of downward cutting by the local river channel, while the succession of steps, from highest and oldest down to lowest and youngest, shows how the rivers have cut downwards into the landscape as time has passed (Fig. 204). It has sometimes been possible to suggest ages for the terraces in terms of the stages of the oxygen isotope timescale (see Chapter 2, Fig. 13). The youngest and lowest terrace material was deposited during the rise of sea level that has occurred over the last few thousand years.
Figures 201 and 208 help to pick out the scattered, isolated hills that are distinctive features of the London Basin. Examples include Parliament Hill on Hampstead Heath (e2; Fig. 205) and Highgate Cemetery (e3) to the north of the Thames. To the south of the present Thames are Richmond Hill (e4), Wimbledon Common (e5), Shooter’s Hill (e6) and Crystal Palace (e7). Most of these hills are features that became isolated and left behind as the staircase of river terraces was being formed. The importance of these upstanding river-terrace hills is enormous in providing present-day Londoners with a sense of natural landscape, wildlife and recreation.
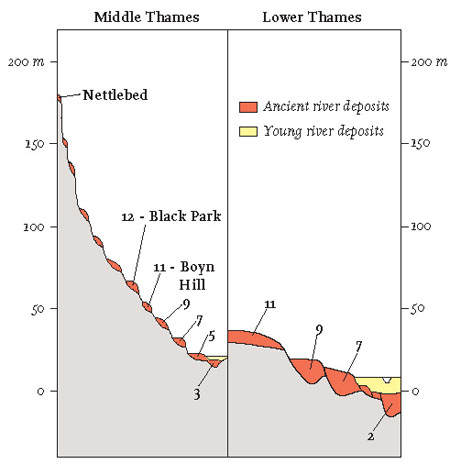
FIG 204. Diagram representing the terraces in the middle (Nettlebed to Slough) and lower (Area 12) parts of the Thames valley, with their ages in terms of oxygen isotope stages.
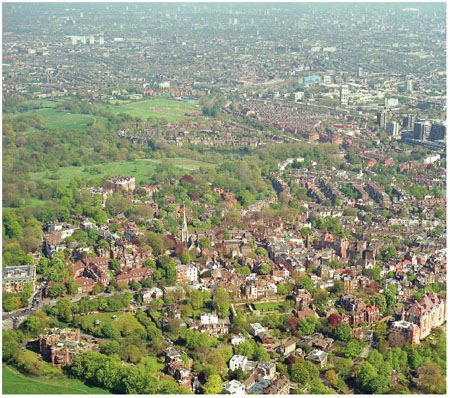
FIG 205. Looking eastwards over Highgate Ponds and Parliament Hill on Hampstead Heath (Fig. 201, e2). (Copyright London Aerial Photo Library)
At the western end of the Thames Valley Basin, northeast of Bagshot Heath (f1), the present-day Thames flows past another isolated hill. This one is crowned spectacularly by Windsor Castle (e8), the largest fortified castle in the world that is still inhabited by the (royal) family that owns it. This hill owes its existence to the presence of strong Chalk that was raised up as a small anticline or upfold above faults in the bedrock, probably during the Middle Tertiary (Fig. 206). The fold is relatively narrow and angular, meaning that the Chalk outcrops at the surface over an area only about 1 km across, creating a prominent, isolated hill and an ideal location for a castle (Fig. 207).
About 470,000 years ago, the Anglian cold episode resulted in ice sheets reaching their furthest southern position, leaving a distinctive mark on the London area. It was the only cold episode in the last 2 million years when ice extended as far south as London. As the ice advanced, it deposited a glacial till of boulders, sand and clay. In places, this till is closely associated with river-deposited gravels, showing that material was often transported locally by meltwater streams that ran beneath and in front of the ice. It is the presence of the till that indicates how far south the ice sheets came.
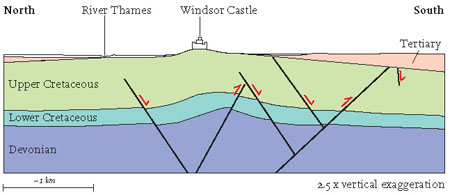
FIG 206. The geological structure under Windsor Castle (Fig. 201, e8).
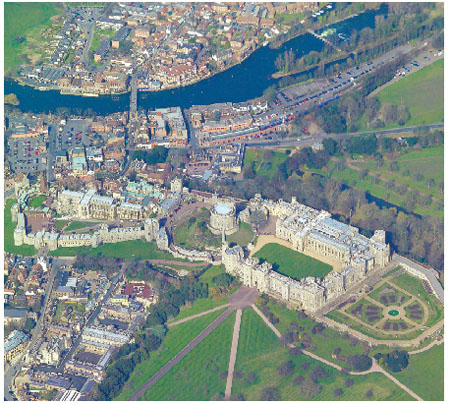
FIG 207. Looking westwards over Windsor Castle (Fig. 201, e8) and the River Thames. (Copyright London Aerial Photo Library)
Investigations of Quaternary deposits in the Vale of St Albans (e9) have identified glacial till overlying gravel deposits that appear to have been laid down by an ancestor of the River Thames. This suggests that, rather than flowing generally eastwards as it does today, the early River Thames used to flow in a generally northeasterly direction towards Essex and Suffolk. When the Anglian ice later advanced into the area from the northeast, the path of the original Thames was deflected to approximately its present-day position some 30–40 km to the south, creating two glacial lakes at the ice front as it did so (Fig. 208). The evidence for these lakes is found in a series of finely laminated silts and clays in the Ware and Watford (e10) areas north of London. The laminations in these sediments are known as varves, and they are typically formed by annual freeze-thaw cycles experienced by large lakes in cold regions. By counting the number of cycles, sedimentologists have been able to establish that the lakes must have existed for several hundred years.

FIG 208. Slope map showing the limit of the Anglian Ice, routes of the past and present Thames and the ice front lakes at Ware and Watford.
With the Thames diverted to the south, a number of large outwash streams developed at the ice front, flowing southwards into the new Thames. As the climate became milder at the start of the next interglacial, these rivers became charged with large volumes of meltwater, cutting valleys to eventually form the rivers Colne and Lea as we know them today. Flow rates in the Thames itself also increased and a number of very coarse gravel deposits date from this time, carried into position by the fast-flowing waters. Examples include the coarse gravel beds of the Black Park terrace (Fig. 204).
As the climate warmed further and the ice retreated, large blocks of ice buried within the till melted, causing subsidence and eventually creating a number of small lakes known as kettle holes (Fig. 209). Over the course of the subsequent interglacial, these small lakes were filled with peat and silt, as well as pollen from the surrounding vegetation. They therefore provide an excellent record of climatic conditions during the warm phase, and so are often of considerable interest to climatologists. A number of kettle holes were discovered during construction work at Hatfield north of London (e11) where they appear as isolated patches of interglacial sediment set within the surrounding glacial till.
Landscape F: The Thames Basin Western Heaths
The Tertiary fill of the London Basin has influenced the landscapes mainly in the areas surrounding Landscape C, with its river floodplains and their terraces. The Bagshot Beds (Fig. 181) are sandy deposits which overlie the London Clay in parts of the Basin, especially in the southwest, where they define Landscape F. The sand content of the bedrock here gives rise to nutrient-poor, acidic soils that favour heathland vegetation and pasture, and are of little use for agriculture. The Bagshot Beds mostly outcrop around the Reading-Aldershot-Woking area, also known as the Thames Basin Heaths. The area has been widely taken over for military training purposes, particularly around the Sandhurst and Aldershot military centres, in the valley of the Blackwater river. The waters of the Blackwater flow northwards into the River Loddon beside the hills of Bagshot Heath (f1) and enter the Thames to the east of Reading.
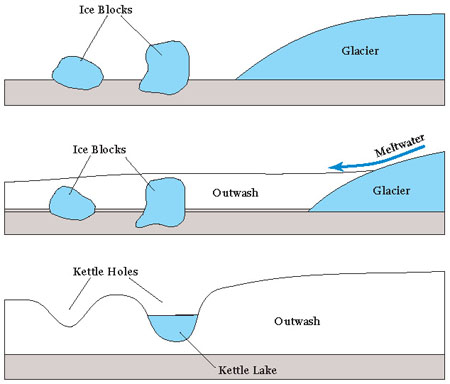
FIG 209. Diagram illustrating the processes of kettle-hole formation.
To the south, where the Chalk scarp of the Hog’s Back meets the lower-lying Heaths, water stored within the higher Chalk strata escapes to the surface in a series of freshwater springs. These springs are commonly associated with ecologically important natural habitats, and also seem to have had an influence upon early human settlement patterns in this area.
The Bagshot Beds also outcrop on Hampstead Heath in north London, and around Brentwood and Rayleigh in south Essex (see Area 12).
Landscape G: The Hertfordshire Plateau
The Hertfordshire Plateau, between the rivers Colne and Lea, extends northwards into the southern part of Area 13. It is underlain by Tertiary bedrock, most widely the London Clay, with a cover of Quaternary alluvium. Historically it was heavily cultivated, growing a variety of crops including hops and wheat to sustain London, making Hertfordshire famous as the best corn county in England. Over the last 50 years urbanisation has crept north from London, and the area is now a zone of commuter homes and new towns.
As with other Landscapes in this Area, the scenery in Landscape G has been strongly influenced by an episode when the pre-Anglian Thames flowed through it, leaving spreads of gravel at high levels on the Hertfordshire Plateau. The arrival of the edge of the Anglian ice sheet, with lobes extending down the Vale of St Albans and as far as Finchley and Hornchurch (Fig. 208), must have modified the landscape considerably, and the subsequent history of ice-sheet front lakes and kettle holes has been mentioned already.
AREA 12: THE THAMES ESTUARY
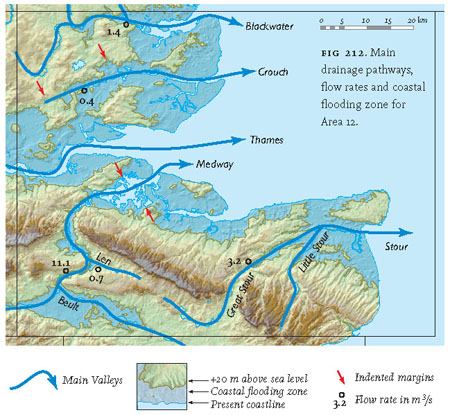
The general introduction to this Region has explained how Greater London occupies the centre of a wide and gentle downfold in the bedrock. The formation of this downfold began more or less at the same time as this Area (Figs 210 and 211) first emerged from the sea, after a long episode of Chalk accumulation. In Early Tertiary times, marine sediments started to accumulate in the Area once again, though this time they were limited to the large embayment of the sea formed by the continuing downfolding of the basin. This sedimentation ceased in mid-Tertiary times, and was followed by a long episode of erosion by rivers that has created much of the present-day landscape of low-lying ground intersected by estuaries (Fig. 212). The River Thames has been the central feature of this erosion, and has also been the main reason for London’s remarkable growth to become the commercial hub of England.
This Area, centred on the Thames Estuary, represents a continuation of the London Basin downfold that we have examined in Areas 10 and 11, although its geometry changes eastwards from the simple downfold structure that cradles Greater London. The southern margin of the downfold is still clearly defined in Area 12 by the North Downs, but the northerly Chalk margin curves off first to the northeast and then to the north as it crosses East Anglia (see Chapter 2, Fig. 9). As a result, the northern half of Area 12 is underlain by Early Tertiary bedrock, marking the centre of the London Basin downfold. This pattern in the bedrock (Figs 213 and 214) provides the best division for more detailed examination of local scenery, and forms the basis for dividing the Area into four Landscapes, marked A to D in Figure 215. Whereas the main features of the Landscapes in the southern part of Area 12 reflect the different resistance to river erosion of the Greensand and Chalk bedrock, the features of the northern parts directly reflect the recent history of river and coastal movement.
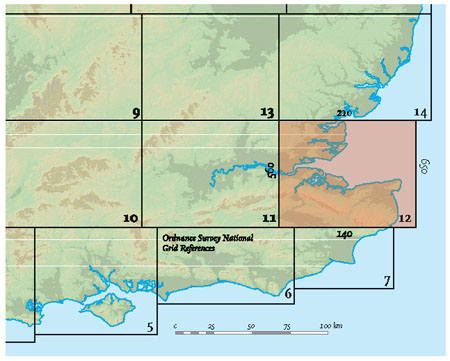
FIG 210. Location map for Area 12.
Landscape A: The Northern Weald
At the beginning of this chapter I introduced the Weald as being exposed within a large uplift, created by upward movement of the Cretaceous bedrock. In the area around Maidstone, the northern Weald succession can be seen ranging southwards from Late Cretaceous Chalk in the North Downs, to the Early Cretaceous Hastings Beds around Royal Tunbridge Wells.
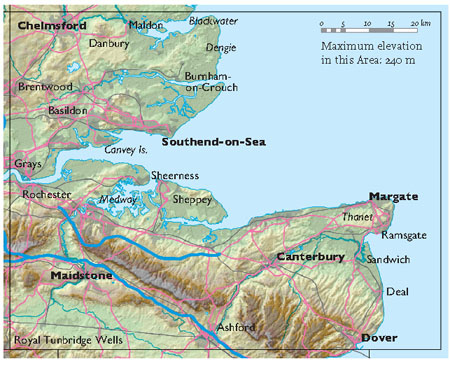
FIG 211. Natural and man-made features of Area 12.
South of the North Downs Chalk hills (see Landscape B), there are a number of hills and valleys that correspond to Early Cretaceous resistant sandstones and weaker mudstones respectively. Moving southwards corresponds to working downwards in the rock succession because of the gentle northward slope of the bedrock. The following features can be observed:
- A low-lying linear bench that tends to have been eroded in the Early Cretaceous Gault Clay, south of the North Downs scarp. Some parts of the M26 and M20 motorways follow this feature. The low ground has been eroded at least partly by the River Len, a tributary that joins the Medway in Maidstone (a1), and by the Great Stour upstream of the valley it has carved through the North Downs.
- A ridge of hills eroded from the Early Cretaceous Lower Greensand, which is about 100 m thick in the Maidstone area but thins easterly, resulting in lower elevations of the hills. At locality a2, 5 km south of Maidstone, the Lower Greensand scarp has a particularly distinctive relief of about 100 m.
- A further belt of low ground (a3) that has been eroded preferentially in the relatively weak Weald Clay by the upper Medway and its tributary the River Beult.
- A general area of hilly country around Royal Tunbridge Wells (a4). Here the bedrock is the more erosion-resistant Tunbridge Wells Sandstone, which forms part of the Hastings Beds (see Area 6). Unusual sandstone bluffs have weathered out to produce features similar in form to the granite tors of Southwest England, which are much prized by outdoor groups and rock climbers.
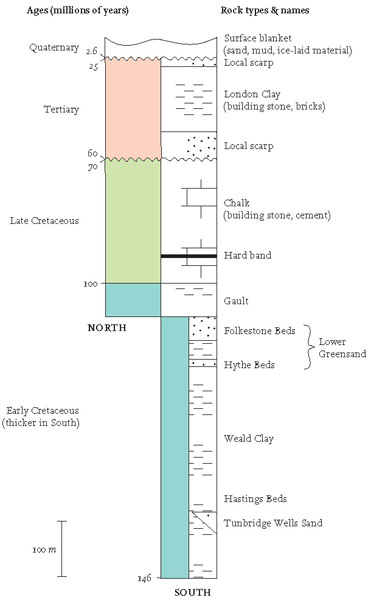
FIG 213. Bedrock succession for Area 12.
The Weald Uplift continues south and west of this Area, and is examined in more detail in Areas 6, 7 and 11. The origin of the Wealden bedrock as a southerly-building Early Cretaceous delta is discussed in Chapter 5, Area 6.
Landscape B: The North Downs and Isle of Thanet
The North Downs are the most clearly defined and easily followed topographic feature of this Area. The Downs rise to heights of over 190 m above sea level and have the typical shape of a hill range formed by erosion of a tilted layer of resistant bedrock: the north slope of the Downs is relatively gentle, following the northerly dip of the Chalk layers, while the southerly slope is a steep scarp, because here the Chalk has tended to collapse along internal fracture surfaces, which are often steeply inclined.
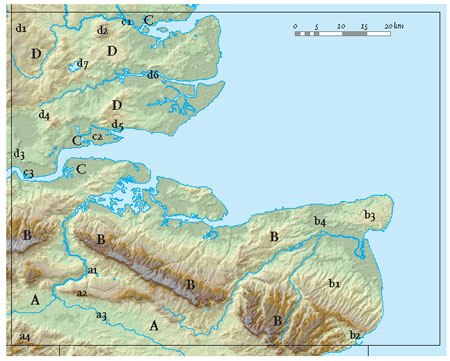
FIG 215. Map of Area 12, showing Landscapes A to D and localities (a1, a2 etc.) mentioned in the text.
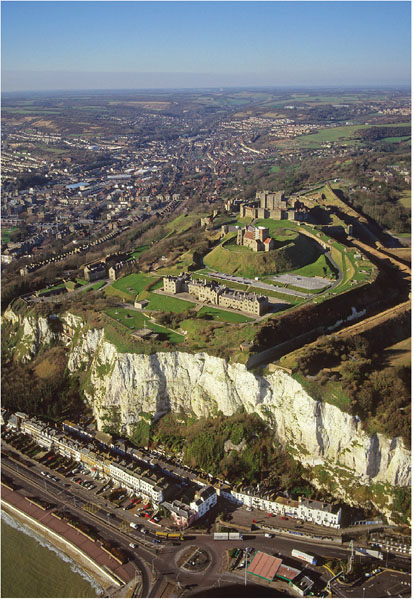
Another feature of the North Downs, clearly seen in Figure 215, is the way that the northerly slope is covered with distinct valleys running directly down-dip. In some areas, for example at locality b1, just north of Dover, the regularity and parallel trend of the valleys is remarkable, even though the down-slope dip is only about 1 degree. Figure 216 looks northwestwards up the well-defined large valley that cross-cuts the linear valleys developed on the high Chalk ground that it has traversed. This suggests that the main valley has been carved very vigorously compared with the linear, parallel, higher valley features, and this may have been caused by pulses of sea-level lowering. The White Cliffs of Dover are also shown in the photograph, but represent a much younger episode of erosion: the way in which they spectacularly cut across the fortifications of the castle shows just how recently the carving of the cliff has been active.
FIG 216. The White Cliffs of Dover (Fig. 215, b2) with their fortifications, castle and Roman lighthouse. (Copyright Dae Sasitorn & Adrian Warren/www.lastrefuge.co.uk)
Further west in the North Downs, the Chalk valleys are more branched and appear to have formed by backwards erosion of upper valley ends, which were shaped by multiple collapse events creating the branches. All the valleys appear to have been carved and enlarged under Ice Age conditions when the subsurface was permanently frozen, as today most of the valleys are dry and so could not have been carved under modern climatic conditions. Many of the valleys contain head, the name given to a mixture of Chalk blocks and chalky mud produced by Ice Age slumping and land-slipping of the bedrock down-slope.
Only two rivers cut right across the North Downs in Area 12. To the west, the Medway flows through Maidstone before passing through the Medway Gap and entering its extensive estuary (see Landscape C). To the east, another breach in the North Downs has been cut by the Great Stour branch of the Stour, flowing through the Downs and then on to Canterbury and the sea south of Ramsgate.
The resistant Chalk ridge of the North Downs has, throughout history, provided a key transport route between London and the shortest sea crossing to continental Europe. The shortest crossing, only some 30 km in length, runs from the resistant Chalk cliffs of Dover (b2) and Folkestone (Area 7) on the English side, to the similar landscape of Calais and Boulogne on the French side. On the English side, the North Downs have provided the obvious inland routes because they separate the flat lands and estuaries of the south shore of the Thames from the heavily wooded and often wet country of the Weald (Landscape A) to the south.
For example, the Pilgrim’s Way from Winchester to Canterbury (Fig. 217) is a historically important route that runs along the southern slopes of the North Downs, avoiding the highest plateau edge. King Henry II is sometimes regarded as the first to undertake the pilgrimage to Canterbury, after hearing of the murder there of Archbishop Thomas Beckett in 1170.
North of the main North Downs lies the Isle of Thanet (b3; Fig. 218), an isolated and distinctive Chalk landscape feature of the East Kent coastline. Here the Chalk layers have been moved into an upfold that has been eroded and now forms a gentle range of hills up to 50 m in elevation. The layering in the Chalk slopes at almost 10 degrees along the southern margin of the Isle. Between the North Downs and Thanet, the Chalk has been downfolded, and is buried under soft-weathering Tertiary sediments, forming the low-lying lands of the Sandwich-Pegwell Bay area.
The Isle of Thanet was a true island up until very recently. In Roman times the Wantsum Channel (b4) separating it from the mainland to the west was up to 3 km wide, and the Vikings were able to sail into Canterbury in the eighth century. Over time, the channel has silted up, aided by the land reclamation efforts of the Church in the twelfth and thirteenth centuries, and by the sixteenth century the channel had ceased to be navigable. The Great and Little Stour now flow out to the sea eastwards to the south of the Isle of Thanet (Fig. 212).
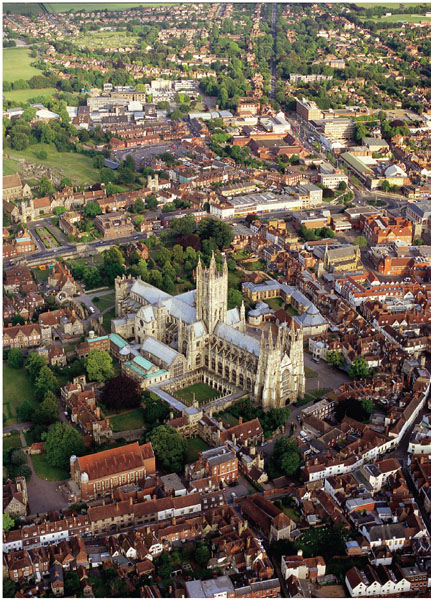
FIG 217. Canterbury Cathedral, with Roman and medieval city and walls. (Copyright Dae Sasitorn & Adrian Warren/www.lastrefuge.co.uk)
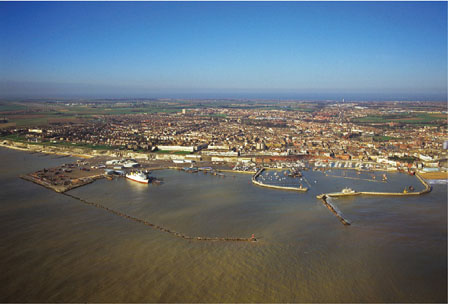
FIG 218. Looking northwestwards across the Isle of Thanet (Fig. 215, b3) and Ramsgate on the Chalk cliffs. (Copyright Dae Sasitorn & Adrian Warren/www.lastrefuge.co.uk)
Landscape C: The Thames and tributary estuaries
The intricate pattern of tidal channels and islands that is so typical of this Landscape extends from the Blackwater Estuary in Essex (Fig. 219) to the Medway and the Isle of Sheppey in Kent. The Landscape has formed by the flooding of river valleys by the recent (Flandrian) rise in sea level. The bedrock of the estuary is London Clay, but this is buried under large thicknesses of recent marine, estuarine and freshwater muds.
Sea level has risen by over 100 m worldwide in the last 20,000 years, since the end of the last (Devensian) cold episode of the Ice Age. Sea-level rise relative to the local land surface may have been even higher in this particular area, due to a seesaw effect between the northwest and the southeast of Britain: northern and western Britain have been rising since they are no longer being depressed by the weight of the ice sheets; meanwhile, south and east England, on the other end of the ‘seesaw’, have been gradually subsiding.
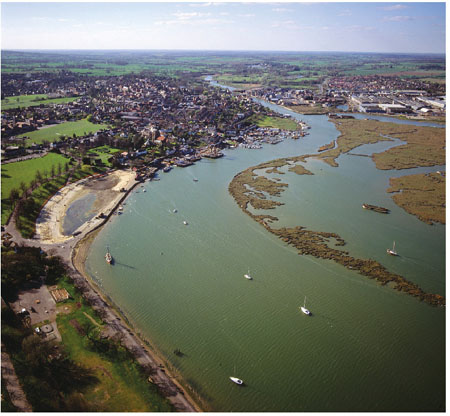
FIG 219. Maldon (Fig. 215, c1) on the upper Blackwater estuary. (Copyright Dae Sasitorn & Adrian Warren/www.lastrefuge.co.uk)
The idea that this area may recently have been tilted eastwards at the same time as worldwide sea level was rising is supported by the sedimentation pattern of the region. Over the last 10,000 years, more than 30 m of marine and estuarine sediment has accumulated where Canvey Island (c2) now is, whereas at Tilbury (c3), 20 km further up the Thames, only 10 m of sediment has accumulated. During the last 10,000 years, a number of peat beds formed further up the Thames, representing distinct phases of swampy river conditions. Similar beds have not been found further downstream, suggesting that downward movement and marine conditions were more continuous there.
One fascinating feature of the shoreline of this Landscape is the Medway Estuary, which is remarkable for its width and its large number of islands. Most of the islands appear to have grown recently as mud and sand have been brought into the estuary by the tides, creating isolated salt marshes and other expanses of intertidal sediment. The width of the estuary suggests that it formed under Ice Age conditions, prior to the recent rise in sea level, as an extensive, flat-lying lowland. This lowland area may have grown in size through freeze-thaw slumping of its hilly margins, similar to the areas of south Essex described below (Landscape D). In the aerial photograph (Fig. 220), Rochester’s Norman castle and cathedral can be seen in the foreground, overlooking the River Medway.
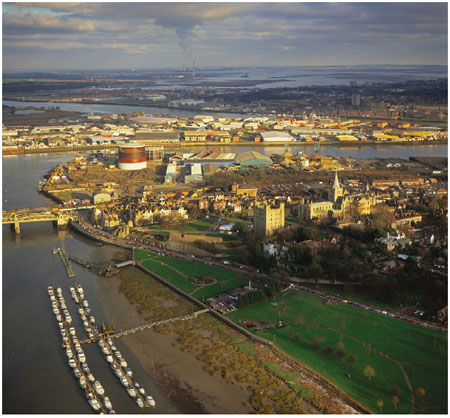
FIG 220. The Medway river and estuary, with Rochester castle and cathedral. (Copyright Dae Sasitorn & Adrian Warren/www.lastrefuge.co.uk)
The rising sea level did not just flood valleys and streams. Sea storms moved large quantities of soft sand and mud, which were then deposited against the new coastlines. The ancestral Thames and its associated tributaries also supplied large quantities of mud and sand to the coastline, transported from further upstream. Plants stabilised the sediment, and eventually it developed into wide expanses of salt marsh and estuarine mud flats.
The efforts of humankind have also had a large impact on the estuary: man-made sea walls encourage the deposition of sand and mud, accelerating the growth of the salt marshes and mud flats. The new land is reclaimed from the sea and new sea walls are built further seaward as the process of reclamation continues. The Romans were the first to drain the wetlands for agriculture, although the fields largely returned to marshland when the empire crumbled. Since the early Middle Ages, land has been systematically reclaimed from the sea and protected by sea banks. Historically the land was used for farmland, especially wet pasture. During the last century, the land has been further used for oil-storage depots, military training ranges and tourism (yachting, marinas, water and jet-skiing) as well as for intensive arable farming on the fertile loamy soils.
Landscape D: South Essex and the Northern Thames Basin
Most of South Essex is underlain by flat-lying horizontal layers, mainly mudstones of Tertiary age. Patches of the sandy Bagshot Beds underlie Ice Age deposits in the northwest corner (d1), but most of the region is underlain by London Clay that is covered by Quaternary river and ice-laid deposits. Around Tilbury (c3), near the River Thames, the older Chalk layer is exposed at the surface, as shown in Figure 214.
Much of the landscape of Essex does not directly reflect contrasts in the erosional strength of the underlying bedrock. It has a distinctive topography that reflects most obviously the variety of processes that have shaped it over the last few million years. The River Thames has been the primary influence on the shape of this Landscape, accounting for much of the erosion of south Essex, although deposition by the Anglian ice has also played an important role. Consideration of the landforms can help to work out which processes have been involved.
An undulating plateau (Fig 215 d1), sometimes reaching 100 m above sea level, forms the corner of this Landscape, northwest of the Brentwood-Chelmsford A12 trunk road. Much of this plateau is underlain by Anglian ice-laid material, and the undulations may reflect surface-blanket topography left by the melting ice, although it must have also been modified later by small stream systems.
To the southeast of the plateau there are more distinctive ridges and slope features, mostly trending southwest-northeast. The first of these hilly features is a knoll centred on Danbury (d2), which is linked to a ridge continuing northeast towards Tiptree in Area 14. The slopes and ridges were carved by the Thames or one of its branches before the arrival of Anglian ice, which seems to have extended southeastwards only as far as this Danbury-Tiptree Ridge.
Southeast of the Danbury-Tiptree Ridge, the next distinct topographic feature is a series of lowlands that extend all the way from Thurrock (d3), near the Thames in the southwest, to Maldon (c1) in the northeast. This is the Valley of Romford, another old course of the River Thames, with very distinct margins to the northwest and southeast (Fig. 221). The northwest margin is a strongly indented southeast-facing scarp which forms the edge of the Hanningfield Plateau (d7), whereas the southeastern margin is the Rayleigh-Dengie Ridge. The lowlands are also crossed by distinctive smaller ridges at Purleigh (northwest of d6) and the Langdon Hills (d4). The northwestern margin of these lowlands contains a series of arcuate hollows which probably formed when freeze-thaw processes in the largely clay bedrock triggered land-slipping down slopes. On a more general scale, the lowlands appear to have encroached on the surrounding hills by a combination of Ice Age land-slipping processes and removal of the slumped mud by river action.
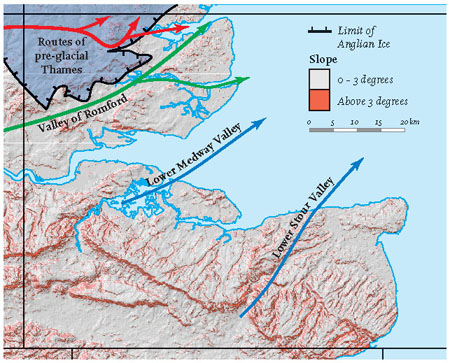
FIG 221. Slope map of Area 12, showing the extent of Anglian ice, along with former and present drainage pathways.
To the southeast of the Valley of Romford, erosion has picked out slopes that are often capped by the more sandy Claygate Member, which forms the uppermost part of the Early Tertiary London Clay Formation. Hadleigh Castle (d5), shown in Figure 222, has been built on a particularly distinctive point of the 70 m high Southend scarp. It is from here that John Constable captured remarkable light effects in his views towards the mouth of the Thames Estuary (see Area 14).
An interesting insight into more recent landscape development comes from the flat Dengie and Rochford peninsulas, north and south of the Crouch Estuary (d6). Field boundary patterns, apparently dating from Iron Age times, about 2,000 years before the present, show a remarkably parallel alignment on the two sides of the tidal Crouch Estuary. This observation, along with evidence of early bridging and fording of the channel, confirms that a very recent rise in sea level must have taken place, drowning ancient fields and crossing places to form today’s 400 m wide estuary.
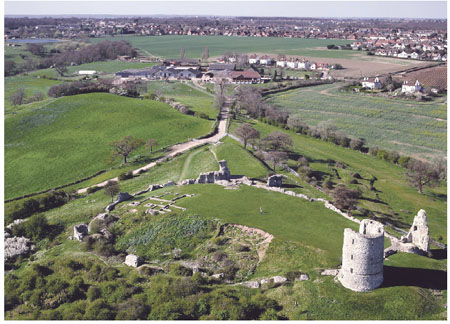
FIG 222. Hadleigh Castle (Fig. 215, d5), 7 km west of Southend-on-Sea. (Copyright Dae Sasitorn & Adrian Warren/www.lastrefuge.co.uk)
