Appendix E: Cost–Benefit Analysis
Introduction
Completing a cost–benefit analysis is a critical step for successful project management execution. It details the potential risks and gains of a proposed solution through a comparative assessment of the program’s benefits against the costs associated with implementing it. If the results of this assessment identify that the benefits of the program outweigh the costs incurred to operate it, then the organization will be able to demonstrably agree to follow through with the implementation.
While completing a cost–benefit analysis requires those involved to maintain a quantitative perspective on the outcome, the activities involved in this process can be viewed as somewhat of an art form than a science. Although performing a cost–benefit analysis can be a challenging task to complete, organizations that are willing to invest resources, effort, and time into brainstorming, researching, and analyzing data can generate an assessment that is thorough, accurate, and relevant.
What Is Cost–Benefit Analysis?
Cost–benefit analysis involves the estimation and evaluation of the benefits associated with alternative courses of action. This assessment involves identifying and comparing the net present value (NPV)1 of benefits against the projected benefits and selecting the best solution according to specified criteria. The goal of the cost–benefit analysis is for organizations to make an educated decision on whether implementing a solution is worth investing their resources, time, and effort.
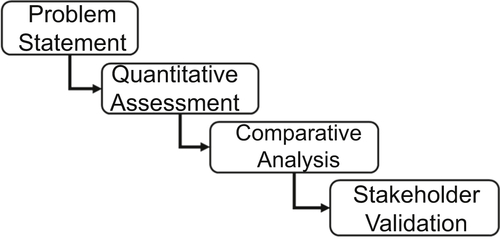
All activities and steps performed in the cost–benefit analysis can be grouped into four major phases, as illustrated in Figure E.1, including:
• Problem statement documents an in-depth analysis of the current situation
• Quantitative assessment assigns monetary value to all known cost and projected benefits
• Comparative analysis assesses if projected benefits outweigh known costs and identifies what alternate solutions exist
• Stakeholder validation determines the reliability of the decision generated from the analysis
Problem Statement
The first phase of the cost–benefit analysis workflow is extremely important in any decision-making process. Documenting the problem statement is the only way an organization can identify alternate and appropriate solutions. This task involves analyzing and having a good understanding of the issues, risks, and baseline scenarios for why the cost–benefit analysis is required.
Contained within the problem statement, organizations should include specifications of the objectives they are setting for this analysis and the plan they will follow to achieving these objectives. It is important that when defining these specifications, the outputs are precise and concrete as possible so the desired future state stands alone and successful achievements can be measured. By setting these specifications too broad, focus on the original problem statement will be lost and the cost–benefit analysis will lead to inappropriate assumptions and incorrect results.
This phase of the workflow involves generating all possible alternative solutions and, if required, narrowing down the list by removing options that are not feasible; including solutions that do not align with basic budgetary, legal, or organizational restrictions. As a means of narrowing down the list of alternatives, organizations should answer the following questions:
• How will performing this analysis meet our objectives?
• Will this analysis involve new capital expenditures?
• Will there be a need to replace existing tangible assets?
• Will there be a need to enhance existing tangible assets?
• What are the constraints of this analysis?
• What stakeholders will be affected by this analysis?
• How will stakeholders be affected by this analysis?
Ideally, organizations should limit the list of alternatives that they will assess further to a minimum of two and a maximum of five. By reducing the list of alternatives before performing quantitative analysis allows organizations to better manage resources, time, and costs.
Quantitative Assessment
With the problem statement documented and alternatives identified, the second phase of the cost–benefit analysis workflow is to quantify all relevant costs and benefits. Completing a detailed and accurate quantitative assessment of costs and benefits, for each alternative, should not be taken lightly. This phase requires that organizations invest its resources, time, and effort into identifying and thoroughly understanding all relevant effects of the solution, both positive and negative, and assign a monetary value to it.
Identifying Costs
Dismissing, overlooking, or assuming any cost or benefit relating to an alternative can significantly impact the organization’s ability to accurately determine which alternative should be recommended as the final solution. To mitigate this, organizations must ensure they are comparing “apples-to-apples” by categorizing costs as either tangible2 or intangible3 and categorizing benefits based on commonalities.
Tangible Costs
Using the service catalog as the source, a thorough and itemized list of quantifiable costs must be made. Where actual costs cannot be taken from the service catalog, as discussed in Appendix D: Service Catalog, factual research should be completed to determine estimates. Types of tangible costs included, but are not limited to, the following:
• Capital expenditures, or physical assets, such as property or equipment
• Software expenses such as licensing
• Shipping, handling, and transportation fees
• Remuneration overhead such as employee salary or training expenses
• Premises payments such as utilities, insurance, and taxes
• Outside data processing such as professional services and contingent workforce
Most likely, there could be a span of several years before an alternative has been fully implemented where ongoing costs will need to be carried forward and incurred until completion.
Intangible Costs
Associated costs can also include those that are not quantifiable. Even though these costs do not have any directly quantifiable value and cannot be bought or sold, based on factual evidence organizations are able to arrive at a hypothetical monetary value for these items. Types of intangible costs included, but are not limited to:
• change in customer dissatisfaction
• drop in employee morale
• decline in quality of product/service
Projecting Benefits
Benefits are positive effects that are realized from implementing a solution in response to issues or risks. They are achieved through any means of enhancement to the way an organization performs a business function.
Benefits can also be presented as being either tangible or intangible. Identifying benefits is done in the same way that cost contributors are documented in the previous step; although projecting them relies more on the educated estimates than direct facts. Generally, benefits can be grouped into one of the following categories:
• Cost savings or avoidance
• Error reduction
• Operational efficiencies
• Increased flexibility
• Improved planning and control
Tangible Benefits
Similar to costs, tangible benefits are the components of business functions or information technology that can be measured directly through known valuation. Referring back to the service catalog as the definitive source for measuring tangible value, these types of benefits can be realized as one of the following potentials:
• Increased operational efficiencies
• Decreased operational funding
• Reduced workforce overhead
• Reduced rate of budgetary increase
• Lower software costs and maintenance
• Lower physical equipment costs and maintenance
• Lower outside data processing fees
• Lower internal development costs
Intangible Benefits
Also similar to costs, intangible benefits do not have any directly quantifiable value and organizations will have to assign a hypothetical monetary value to these types of benefits. As indicated previously, making assumptions on the monetary values can be challenging to determine the value of intangible benefits as one of the following potentials:
• Improved asset utilization
• Improved resource control
• Improved business planning
• Improved organizational flexibility
• Quicker access to information
• Higher quality of information
• Enhanced organizational training, awareness, and learning
• Increased goodwill within workforce
• Increased job satisfaction
• Enhanced decision-making capabilities
• Quicker decision-making process
• Reduce error rates
• Improved organizational image
• Improved customer satisfaction
• Increased customer loyalty
Guessing as a means of estimating the quantitative value of intangible benefits has the potential to significantly impact the organization’s ability to accurately determine which alternative should be recommended as the final solution. Instead, organizations can approach the valuation of intangible benefits in any of the following manners:
• Organizations may decide that it would be acceptable to leave intangible benefits entirely out of the cost–benefit analysis. This decision can be related to the degree of difficulty in assigning monetary values or that intangible benefits do not demonstrate significant improvements to business functions.
• Leave intangible benefits out of the cost–benefit analysis but their potential effects to business functions in an appendix. This way, they do not have direct influence to the assessment but can be presented as an additional consideration for selecting an alternative solution.
• Identify a stand-in measurement that can be used to include the intangible benefit valuation in the cost–benefit analysis. In this case, a stand-in measurement could be taken as the value of a similar benefit or cost that is more easily assigned a monetary value. Caution must be given when selecting a stand-in measurement to ensure that it provides an accurate and equivalent approximation of the actual benefit or cost.
• By conducting a survey of key stakeholders, the valuation of the intangible benefits can be determined. This survey is designed to ask stakeholders to assign a monetary value to the intangible benefit which can then be used for inclusion in the cost–benefit analysis.
• Use of a shadow price4 to function as the unit of measurement to generate estimates on the monetary value of the intangible benefit. No rules or procedures exist for determining a shadow price; requiring that organizations employ an experienced matter expert to generate the valuation. The use of this option should only be explored when none of the preceding approaches will provide an accurate and equivalent approximation of the intangible benefit.
Comparative Assessment
With all identified costs and benefits assigned a common unit of measurement, each alternative solution documented in the problem statement can now be accurately assessed.
Discounting Future Value
Before starting the comparative assessment, organization should take special consideration where there are either costs or benefits that span across several years. In these cases, it is important that organizations take note that the immediate and present value (PV) of an alternative will diminish over its lifespan.
The process of discounting can be applied to reduce the monetary value of future costs and benefits back to a common time dimension that will be used for the assessment. Discounting allows organizations to realize the immediate value of an alternative, over the future value, and provides a way of reflecting the opportunity costs. In preparation, the organization should document the following series of parameters to be used in the baseline for discounting:
• The total evaluation period5 for the alternative
• Which year is to be used as the base discount year6
• What discount rate will be used for the evaluation period
• Which price year7 is appropriate to use for cost estimates
• Which price year is appropriate to use for the level of inflation8
• If analysis of relative prices is needed for specific cost items
Discounting is performed on the finance principle of time value of money (TVM)9 assumed that value or monies or cash flow depends on the period in which they are received. In other terms, this principle suggests that monies received in the future are worth less than monies received today because monies received today can be invested and begin to accrue interest immediately. This allows organizations to determine the economic worth of the alternatives under assessment.
Present Value (PV) Assessment
The PV of costs or benefits is the representation of costs and benefits received in the future, discounted back into today’s current value. The PV of each cost and benefit should be calculated for each alternative being considered as a solution. The resulting PV can then be used for selecting criteria to identify which alternative is most valuable to the organization. The PV of costs and benefits is calculated as:

where V is the cost or benefit represented in the evaluation period t, and d is represented as the discount rate. At a minimum, the PV should be calculated and used as the primary decision criteria for identifying which alternative provides the best return on investment.10
Tables E.1 and E.2 show examples of estimated costs and benefits for two alternatives identified through defining the problem statement. For the purposes of this example, an assumption is made that the discount rate has been set at 3%. The final NPV calculations for these two alternatives, presented in Tables E.3 and E.4, clearly demonstrate that the benefits of both alternative outweigh the present value of costs; with the second alternative being larger.
Table E.1
Cost–Benefit Analysis for Alternative #1
| V0 ($) | V1 ($) | V2 ($) | V3 ($) | |
| Costs | ||||
| Capital | 10,000 | 2000 | 1000 | 1000 |
| Expenses | 9000 | 1000 | 1000 | 1000 |
| Workdays | 2000 | 1000 | 1000 | 0 |
| Benefits | ||||
| Process automation | 0 | 6000 | 4000 | 3000 |
| Increased productivity | 0 | 12,000 | 9000 | 9000 |
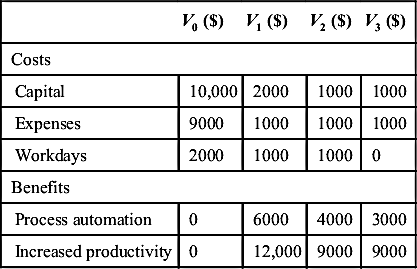
The values illustrated in Tables E.1 and E.2 are high-level representations of individual costs and benefits. An NPV template has been provided as a reference in the Templates section of this book.
Having arrived at the final NPV calculations for each alternative, organizations can elect to use additional criteria for determining which alternative is the best solution. These additional criteria should be used as a supplemental assessment and not as a replacement of the NPV.
Table E.2
Cost–Benefit Analysis for Alternative #2
| V0 ($) | V1 ($) | V2 ($) | V3 ($) | |
| Costs | ||||
| Capital | 8000 | 1000 | 1000 | 1000 |
| Expenses | 9000 | 2000 | 2000 | 1000 |
| Workdays | 2000 | 1000 | 0 | 0 |
| Benefits | ||||
| Increased productivity | 0 | 8000 | 5000 | 3000 |
| Reduced workforce | 0 | 6000 | 9000 | 9000 |
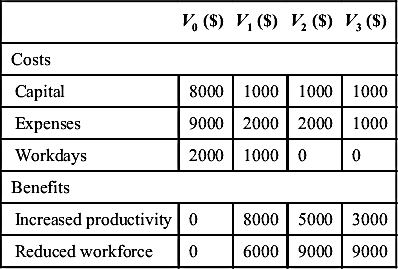
Table E.3
Present Values (PV) for Alternative #1
| Costs | ||
| PV = | ((10,000 + 9000 + 2000)/(1 + 0.03)0) + ((2000 + 1000 + 1000)/(1 + 0.03)1) + ((1000 + 1000 + 1000)/(1 + 0.03)2) + ((1000 + 1000 + 0)/(1 + 0.03)3) | = 29,542 |
| Benefits | ||
| PV = | ((6000 + 12,000)/(1 + 0.03)1) + ((4000 + 9000)/(1 + 0.03)2) + ((3000 + 9000)/(1 + 0.03)3) | = 40,711 |
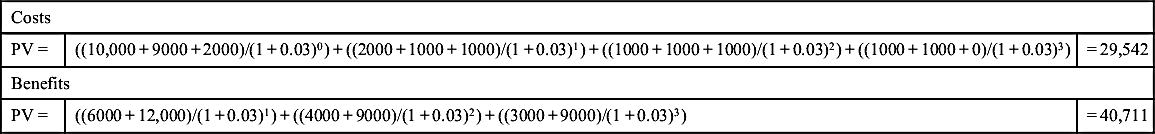
Table E.4
Present Values (PV) for Alternative #2
| Costs | ||
| PV = | ((8000 + 9000 + 2000)/(1 + 0.03)0) + ((1000 + 2000 + 1000)/(1 + 0.03)1) + ((1000 + 2000 + 0)/(1 + 0.03)2) + ((1000 + 1000 + 0)/(1 + 0.03)3) | = 27,542 |
| Benefits | ||
| PV = | ((8000 + 6000)/(1 + 0.03)1) + ((5000 + 9000)/(1 + 0.03)2) + ((3000 + 9000)/(1 + 0.03)3) | = 37,770 |

Benefit–Cost Ratio
Organizations can use these criteria to select the alternative that provides the maximum ratio of benefits in comparison to costs and is calculated as the PV of identified benefits divided by the PV of known costs. This calculation is presented as follows:

where B is represented as the total value of identified benefits and C is represented as the total value of known costs.
The benefit–cost ratio (BCR) calculation for the alternatives noted in Tables E.1 and E.2 are presented below in Table E.5.
Net Present Value of Net Benefits
Organizations can use these criteria to select the alternative that provides the largest NPV of net benefits and is calculated as the present value of identified benefits minus the present value of known costs that have been discounted back to the present. This calculation is presented as follows:

where B is represented as the value of identified benefits, C is represented as the value of known costs, r is the discount rate, and t is the number of evaluation periods that the benefits and costs occur in.
The calculation for the alternatives noted in Tables E.1 and E.2 are presented in Tables E.6 and E.7.
Internal Rate of Return11
Organizations can use these criteria to evaluate the rate of growth a project is expected to generate. Determining the rate of growth is most commonly performed through trial and error until a discount rate resulting in a zero value NPV is found.
To help in the identification of this rate, financial calculators should be used.
Payback Period12
Organizations can use these criteria to select the alternative that recovers its costs in the shortest amount of time. The major concern with using this calculation is that it does not take into consideration the time value of money (TVM); potentially leading to inconsistent results when cash flows occur in later time periods. However, the advantage of this calculation is that organizations can arrive at a value quickly because it requires no knowledge of the PV of costs or benefits.
The calculation for the alternatives noted in Tables E.1 and E.2 are presented in Tables E.8 and E.9.
An NPV is a recommended part of cost–benefit analysis that supports business decision-making. The overall ranking of all alternatives to ultimately identify a preferred solution demands that the NPV, and supplemental criteria (ie, BCR, Internal rate of return, etc.), is completed as thoroughly as possible. However, while the NPV ranking provides organizations visibility to which alternative will provide the best value, each alternative must be subjected to validation of the robustness under different scenarios.
Sensitivity Analysis
Obtaining a unique figure is not always the simplest of tasks when there are so many positive and negative influences on the final NPV calculation. Having finally arrived at an NPV for each alternative, these results must be subjected to further analysis with the purpose of determining how sensitive the NPV is to changes in key variables, such as resource overhead.
The sensitivity analysis performed here allows decision-makers within the organization to test the robustness of the results to collect additional information about how the solution will perform under different scenarios. Keep in mind that the analysis performed here does not reduce the project risk, instead better illustrates the actual feasibility of a successful solution implementation to the organization’s decision-makers.
Creating a series of scenarios, most of which will be subjective to every organization, should focus on worst cases where assumptions and estimates are scrutinized. While there are many ways of performing sensitivity analysis, the most commonly used method is to validate the degree of error and reliability of costs, benefits, and other parameters (ie, discount rate) recorded in the final NPV and supplemental criteria.
By creating additional NPV and criteria documents that illustrate both high and low values, the degree to which these documents differ identifies how susceptible alternatives will be to changing values or parameters. By modifying a single value or parameter, the ranking of preferred alternatives could change leading to a different solution being identified as the most valuable.
Organizations must be cautious when performing sensitivity analysis where there are a large number of values and parameters included in the NPV and supplemental criteria. Where a value or parameter will be subjected to this sensitivity analysis, a degree of error must be completed using both high and low comparisons; resulting in (X)2 for the number of outputted documents.
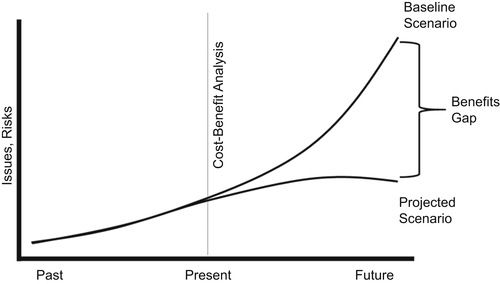
Gap Analysis
Graphic aids, such as a gap analysis, are excellent tools for helping stakeholders to clearly understand the differences between continuing to operate with the current risks and issues in comparison with implementing the highest ranked alternative. Working from the baseline and future scenarios created while documenting the problem statement, the costs and benefits of each identified solution(s) can be used to visually demonstrate the value of implementing an alternative as illustrated in Figure E.2.
To ensure that the gap analysis accurately captures the differences between current and future state scenarios, the baseline has to be properly defined and relevant. Having a baseline scenario does not mean that nothing will happen to the current situation over time. The reality is that business moves on as usual and in the current situation, the risks and issues identified in the problem statement could still be subjected to legal, regulatory, or corporate policies; regardless of the future state scenario.
On this account, the impact of changes in the current situation must be properly reflected in the baseline scenario. Organizations have to make a distinction between what they consider as “do nothing” and “do minimum” when it comes to the level of interactions that will happen in the current situation that do not take into account the future state scenario.
Investing in an alternative that demonstrates the highest ranked value can be misleading; not because cost, benefits, or parameters have been inaccurately recorded, but because the NPV could be hiding the fact that even without implementing an alternative the current situation might not remain constant. Using an optimized baseline scenario that accounts for changes in the current situation, a more accurate comparison to the future state scenario can be performed.
Stakeholder Validation
There are usually several different stakeholders that will be affected when the selected alternative is implemented. Each group of stakeholders should be identified and an assessment of whether they will gain (ie, operational efficiencies) or lose (ie, private costs) as a result of the implemented solution is done. Communication to stakeholders on their involvement should contain detailed information so that it is clearly understood who will be the beneficiaries, who will be the losers, and by what amount. Whether positive and negative, different types of impact that should be communicated to stakeholders as part of the overall communication plan include:
• Determining the ability to remain profitable when a reduction in workforce from enhanced operational efficiencies influences economic opportunities
• Identifying change, whether an increase or decrease, in operational (eg, processes), regulatory (eg, taxes), and individual (eg, consumer) costs as a result of changes in the way core business functions are performed
In addition to impact assessment, the final recommendations from the cost–benefit analysis should be formally documented and presented in the form of a business case. This business case should contain sufficient details about the cost–benefit analysis so that stakeholders have enough details to support their decision-making on whether the organization should proceed with implementing the final recommendation. A formalized business case template has been provided in the Templates section of this book.
Summary
By completing a cost–benefit analysis, organization can gain a better understanding of the benefits and potential risks of implementing a solution. While performing this analysis can be challenging at times, it is important that resources, effort, and time are invested to generate results that are thorough, accurate, and relevant.