Chapter 4
Standard Core Variables for Continental Shelf Prehistoric Research and Their Availability
Nicholas C. Flemming
National Oceanography Centre, Southampton, UK
Introduction: The Concept of Core Variables
The collection of seabed data and its archival and analysis to document or recreate submerged terrestrial landscapes suffers from a paradox: the experts who have been collecting seabed data for many decades have seldom thought of identifying terrestrial features or storing the data in a way that preserves the submerged terrestrial signal; while experts in Pleistocene geomorphology on land are not usually familiar with marine geophysical data sources. This chapter considers the routine sources of seabed data and how best to extract paleolandscape information from them.
For seabed prehistoric research we need to transform the usual methods of describing the characteristics of the seabed and sub-seabed structures into descriptors of submerged Pleistocene terrestrial landscapes in a systematic way. We are analyzing in most detail the last 20,000 years, the period during which the sea level rose from about –135 m to the present level about 5000 years ago, but earlier terrestrial features need to be included in some projects. Ideally, we would like to reconstruct the post-Last Glacial Maximum (LGM) landscape in detail at intervals of 2000 years, showing the paleo-sea level, coastline, and drainage patterns etc., with a local spatial resolution of 50 m to 100 m. Aspects of this type of work are carried out frequently at a local scale in academic research papers (e.g. Lambeck et al. 2004; Hubbard et al. 2009; Peeters et al. 2009; Stoker & Bradwell 2009), but there is no standard terminology, data set, or classification, that permits a search for “Submerged paleolandscapes”, and components thereof. For example, even if a bathymetric data set when plotted out showed linear depressions that are probably drowned river valleys, this would have to be done by eye, and it would not be possible to search digitally for submerged rivers. If we consider large varieties of scale, and possibly a third dimension of valleys buried under sediment, the advantages of being able to search automatically would be substantial.
Each sea basin of the European area has characteristics which are unique, and together they span a wide range of conditions. The Baltic, for example, is a low salinity, estuarine, periglacial environment with a low tidal range; the Atlantic coasts are high-energy environments with a high tidal range; and the eastern Mediterranean has relatively high salinity, low precipitation, limited tidal range and low sediment accretion. To describe the seabed conditions thoroughly in each locale will require detailed and high-resolution knowledge of the sediments, paleoshorelines, tectonics, core stratigraphy, palynology, foraminifera, ice-cap thickness, ice flow lines, ice edge, and so on. The subsequent chapters in this volume on each sea basin will consider variables at this specificity.
Nevertheless, there are some variables which are fundamental to the study and understanding of all areas, and which are almost always available, albeit at relatively poor resolution. Such low or modest resolution presentations also provide a broad overview of the landscape covering wide areas.
The concept of Core Variables defines the highest possible resolution of each of the selected variables which can be obtained relatively cheaply and with free, or cheap, access, and which is available uniformly in all European sea areas. Some allowances will be made for availability of different scales or resolutions in some sea areas. In each case, the highest resolution data may only be available by contacting the data originator.
The publication of such a core list can also be used to put pressure on data holders to reduce restrictions on use, and increase the resolution of freely available data sets. Many of the data types required for prehistoric research are required in a form which is not commercially valuable, and therefore it should be possible to increase the availability by working closely with data holders and data managers.
The steps for defining and selecting a Core Variable are to:
- review the existing data types and integrated data sets which exist in a standard form already at a relevant resolution, and covering most of the European shelf;
- identify the data or product holders for (1) and access restrictions if any;
- establish whether the existing integrated data sets have sufficient resolution to reveal submerged terrestrial landscape features;
- document future plans and projects for refining resolution and/or increasing freedom of access to the data;
- interact with data holders and management groups to promote improvements which will support future continental shelf prehistoric research.
Suggested Core Variables for All European Sea Areas
In the following discussions regarding access to European-scale data sets and metadata through the EMODnet system, I am grateful to Alan Stevenson who has provided some of the text and graphics based on his contribution to the European Marine Board Publication Position Paper 21 “Land beneath the Waves” (Flemming et al. 2014:88-92, Chapter 5). Since 2008, data have been aggregated and compiled for the European Regional Seas under the European Commission's EMODnet program. The network consists of a consortium of organizations within Europe that assembles marine data, data products and metadata from diverse sources in a uniform way. The main purpose of EMODnet is to unlock fragmented and hidden marine data resources and to make these available to individuals and organizations (public and private), and to facilitate investment in sustainable coastal and offshore activities through improved access to quality-assured, standardized and harmonized marine data. EMODnet is an initiative from the European Commission Directorate-General for Maritime Affairs and Fisheries (DG MARE) as part of its Marine Knowledge 2020 strategy (ec.europa. eu/maritimeaffairs/policy/marine_knowledge_2020).
There are presently eight sub-portals in operation that provide access to marine data and metadata under the following themes: Bathymetry, Geology, Physics, Chemistry, Biology, Coastal Mapping, Seabed Habitats and Human Activities, accessible from the EMODnet website (www.emodnet.eu). The sub-portals providing access to integrated data of most value to continental shelf Pleistocene landscapes are: Bathymetry, Geology, and to a certain extent Seabed Habitats and Human Activities. The Coastal Mapping sub-portal also has potential in this regard, but is currently in its early stages and thus difficult to evaluate. Bids and proposals to expand the Geology sub-portal to include reconstructions of the submerged landscapes of the European continental shelf at various time-frames have been formally submitted and are currently being evaluated (2017).
The following variables are fundamental to submerged landscape analysis, and are also supported at the European level by programs such as SeaDataNet, EMODnet, and Geo-Seas. Within this context, we can envisage the following seven Core Variables as key supports for submerged Quaternary landscape research:
- bathymetry, to support landscape and topography reconstruction;
- coastlines, accurate digital coastal data since many prehistoric sites are in shallow water;
- solid geology, bedrock outcrops, surface mapping;
- sediments, seabed sediment characteristics, sediment thickness;
- seabed geomorphology, features and terrestrial landscape;
- sub-bottom acoustic data, availability and access;
- sub-bottom core metadata and grab metadata.
Although currently not supported directly, it should be possible in the near future to search for and identify data in terms of seabed features, as discussed previously.
Integrated data sets and metadata across basins will help to avoid the requirement for experts in each country to search for high-quality data on a piecemeal basis. This is particularly important near median lines and boundaries. It is not yet feasible to include paleo-sea-level data as a Core Variable since, as shown in Chapter 2, the science of interpreting field data and generating realistic glacio-isostatic adjustment (GIA) models, combined with local tectonics and other earth movements, means that a centralized and agreed archive of spatially high-resolution site-specific local relative sea-level curves is still not achievable. Large volumes of data are available in widely scattered sources and programs, but qualifying factors are often needed in their interpretation.
Characteristics and Sources for Core Variables
Bathymetry
This is the most fundamental and, at first sight, the simplest variable. Reliable navigational charts have been published for over 100 years, and numerous industries have carried out detailed modern seabed surveys for specialized purposes. One might expect that a topographic map of the seabed, comparable to a topographic contoured map on land at a scale of 1:50,000, should be readily available at a modest cost, showing valleys, outcrops, gradients, sand banks, at least in coastal waters out to a depth of 100 m to 200 m.
This is not the case, either on paper or digitally. Published navigational charts are not scientific representations of or approximations to the seabed, with the implied scientific margins of error and probability. Nor do they usually resolve the shape of features such as valleys or rock outcrops on the seabed. A navigational chart published by a national hydrographic office is a legal instrument governed by national and international regulations, which, if used properly, ensures that a ship will not strike the seabed by mistake, and that it can proceed safely from Port ‘A’ to Port ‘B’. In order to achieve their legal purpose, the compilers of charts make the following assumptions and adjustments:
- the benchmark from which depths are measured is the lowest level that the tide drops to in that area, independently of meteorological effects (Lowest Astronomical Tide, LAT). In tidal waters this is a different reference level for each chart sheet. The LAT benchmark is cross-referred relative to a fixed terrestrial geodetic benchmark or ordnance datum. The tidal amplitude is also shown on the paper chart;
- the assumed sound velocity for calibration of echo-sounding surveys in shelf seas is set at a standard speed which tends to make the seabed seem slightly shallower than it really is. The correction for the actual regional and climatic variation of sound speed in sea water is only made for water depths greater than 200 m;
- even on the larger-scale paper charts, say 1:50,000, actual depth soundings are only displayed at intervals of about 2 cm on the chart sheet, or 1 km on the seabed. This does not reveal small irregularities of the seabed, and gives a smooth undulating impression of the topography;
- for gridding and contouring digital terrain model (DTM) computations, the depth used for each cell is the shallowest recorded depth in that cell, not the average depth. This creates a safe product for navigation, but results in a further ‘shoal bias’ (i.e. an emphasis on shallow areas) for the entire smoothed topography. The Master of a vessel does not wish to be told that the estimated depth beneath the keel is ‘X’ m with a standard deviation of ±5 m. The form of the seabed represented by a hydrographic chart is in effect a ‘drape’ lying across the shallowest points, and this is logical for safe navigation;
- the further effect of these conventions is that no abrupt changes of depth, and no steep gradients, appear on a navigational chart. Charts never show a vertical cliff underwater, but they often exist (Flemming 1972; Collina-Girard 2002);
- there is no need for a navigational chart to indicate unusual depths, but there is every need to show unusual shallows. Thus narrow depressions, small valleys, gullies, and features such as karstic sinkholes seldom show on charts. Only the broadest depressions and major drowned valleys or shelf-edge canyons appear when the printed soundings are contoured;
- in the continental shelf waters of many European countries there are large parts of the seabed which have not been sounded in the last 50 years or more (Fig. 4.1). Even the most well-surveyed areas have usually only been surveyed with single-beam echo sounders with tracks hundreds of meters apart, and only small areas have been surveyed with multibeam. Some European countries now have active national programs to increase the application of multibeam surveying (e.g. UK program MAREMAP).
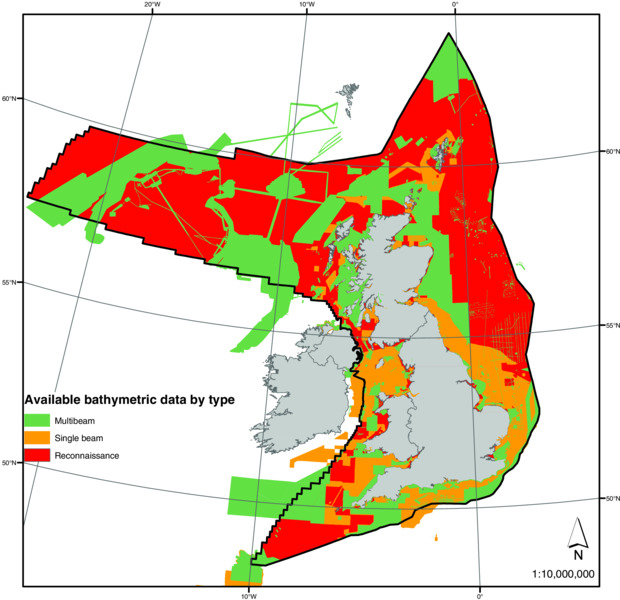
Figure 4.1 Map showing typical progressive improvement in resolution and accuracy of seabed bathymetric surveys. Gray-green tint is modern multibeam that would resolve abrupt drowned landscape features; yellow is the area mapped by single-beam sonar; the red area has been mapped using reconnaissance soundings. This map only shows data available in the public domain, and does not show all commercial surveys. The map contains public sector information, licensed under the Open Government Licence v2.0, from UKHO, BGS. Map compiled by Rhys Cooper, BGS.
For the reasons listed, the accuracy of delineation of the topography of the seabed using published charts is limited. The raw data holdings in the national hydrographic offices would permit more accurate products, but these are not needed for safety of navigation, and therefore a case has to be made for the necessary expenditure. Commercial organizations can thus obtain more accurate and complete data sets on request, and for a fee, and compile special seabed maps for their particular applications.
The requirements of the research community in continental shelf prehistoric archaeology are very demanding, even by commercial standards. We need to be able to look at the topography over wide coverage areas, of the order of 10 km to 100 km, so as to appreciate the general trend of features such as ridges, banks, terraces, paleocoastlines and valleys, and then, ideally, to zoom in to features at a scale of 10 m to 50 m, so as to resolve fossil beaches, cliffs, cliff-terrace junctions, gullies, minor stream beds, moraines, coral terraces, or shell middens. This ideal is not at present achievable, although it is technically feasible.
This section therefore addresses the availability of data sets which provide some uniformity over wide areas, where the data quality control is documented (metadata), and freedom of access is generous, if not always free.
Assuming that the bathymetry itself is available in a form which describes the topography of the seabed, there are further complications in detecting and describing the drowned terrestrial landscape. These are caused by (a) the overlying postglacial marine sediments deposited on the LGM terrestrial surface, and (b) coastal wave action during marine transgression and modern bottom currents and wave action, which may have eroded the original LGM terrestrial surface away (see for example, Bridgland 2002: 30). Thus the topographic surface defined by the bathymetry comprises three types of terrain: (i) the original unaltered LGM terrestrial land surface; (ii) modern marine sediments of unknown thickness covering the original land surface (which may also have been eroded); and (iii) exposed areas where the original LGM land surface has been eroded away.
Notwithstanding these uncertainties, the topography of the seabed as it is now must be the starting point of submerged landscape analysis. The URL for access to EMODnet generalized European bathymetry is: www.emodnet-hydrography.eu/content/content.asp? menu=0030005_000000.
The overall objective of the EMODnet Bathymetry Project is to fill in the gaps of the EU's low-resolution bathymetry map and to assemble a complete inventory of high-resolution seabed mapping data held by public and private bodies. Working together with research institutes, monitoring authorities and hydrographic offices, the project will collect hydrographic data sets and compile DTMs at a resolution of 0.125 arcminutes by 0.125 arcminutes for each geographical region (Fig. 4.2). The DTMs are then loaded and integrated into a spatial database with a powerful, high-end bathymetric data-products viewing and downloading service that is complemented by Web Map Services (WMS) to serve users and to provide map layers to, for example, the other EMODnet portals, the prototype European Atlas of the Seas, and the broad-scale European Marine Habitats map. The portal includes a metadata discovery and access service that gives clear information about the hydrographic survey data used for the DTM, their access restrictions and distributors. The system also includes a mechanism for requesting access to basic measurements data.

Figure 4.2 Bathymetry from EMODnet bathymetry portal, 2015. This is a searchable data set that can be zoomed in to a resolution of 0.25 x 0.25 arcminutes. It also provides information on sources of higher resolution digital data.
The resolution provided by EMODnet digital terrain modeled bathymetry is at present 0.25 arcminutes, or approximately 500 m. This is much better than global contoured charts such as General Bathymetric Chart of the Oceans (GEBCO) or the 2-minute resolution of the Naval Research Laboratory Digital Bathymetry Data Base (DBDB2 — see also www7320.nrlssc.navy.mil/DBDB2_WWW/), but is still rather crude for the purposes of accurate identification of small river valleys, moraines, or paleoshoreline features such as a lagoon or a dune ridge. Discussions are continuing to find ways of releasing higher resolution bathymetry in a form which would have no commercial value. At present, the EMODnet Bathymetry portal provides procedures for requesting higher resolution data through SeaDataNet, and the data provider will probably require the user to sign a licensing contract which restricts the use and publication of the data. The following URL gives maps at 1:250,000 scale for UK adjacent seas: www.bgs.ac.uk/products/digbath250/sample.html
Other international data resources include the International Hydrographic Organization (IHO), which co-ordinates the activities of national hydrographic offices.
The Baltic Sea Bathymetry Database (BSBD) is an effort to gather data in one place and distribute it for the areas of all Baltic Sea countries. This website offers complete, homogeneous and up-to-date Baltic Sea bathymetry data from all Baltic Sea national hydrographic offices under the umbrella of the Baltic Sea Hydrographic Commission. The BSBD project is co-financed by the European Commission Trans-European Transport Network (TEN-T). Land heights and water depths have been calculated for two regular spherical grids from available data. The data are available at the following URL: www.io-warnemuende.de/topography-of-the-baltic-sea.html
For the Mediterranean there are many different examples of published bathymetric datasets but they tend to concentrate on the deepwater gross topography, and not on the smaller features of the continental shelf. Much of the international collaboration is through long-established scientific bodies concerned with the geophysics of the deep ocean floor, and tends to leave the continental shelf to the navigational authorities, with the problems already listed above. One of the files in the above compilation is the IHO-IOC-ICBM 1000 m and 500 m resolution multibeam of the deep-sea Mediterranean, but this does not provide data on the shelf.
The bathymetry of the whole Mediterranean at a scale of 1: 1,000,000 is available in 10 sheets, downloadable from the following website, and reproduced in condensed format as Fig. 4.3: www.ngdc.noaa.gov/ mgg/ibcm/images/93001.jpg

Figure 4.3 Small-scale reproduction of the IOC-IBCM bathymetry of the Mediterranean. Credit with permission: IBCM Project, Intergovernmental Oceanographic Commission, International Hydrographic Organization, and Head Department of Navigation and Oceanography, Russian Federation.
The chart set is described by the US National Centers for Environmental Information (NCEI — formerly the National Geophysical Data Center (NGDC)) as follows:
This bathymetric chart is published by the Charts Division of the Head Department of Navigation and Oceanography in Russia under the authority of the Intergovernmental Oceanographic Commission (IOC) of UNESCO. Originally compiled from ninety 1:250,000 scale British Admiralty Mercator plotting sheets for oceanic soundings, it presents the bathymetry and land topography as 200 m contours with supplemental 20 m, 50 m, and 100 m contours at sea. Several versions are available; a 10-sheet set (each 74 x 90 cm) at 1:1,000,000 scale at 38 degrees N, and a photo-reduction to 1:5,000,000 scale. This chart, with an inset of the entire Black Sea at half scale, is also the basemap for a Geological/Geophysical series with Bouguer gravity anomalies (IBCM-G), seismicity (IBCM-S), thickness of Plio-Quaternary sediments (IBCM-PQ), unconsolidated bottom surface sediments (IBCM-SED), and magnetic anomalies (IBCM-M). Digital variants and explanatory brochures for these series are in preparation. The digitized marine contours are available on CD-ROM as part of the British Oceanographic Data Centre's GEBCO Digital Atlas (International Bathymetric Chart of the Mediterranean: A Regional Ocean Mapping Project of the Intergovernmental Oceanographic Commission. www.ngdc.noaa.gov/mgg/ibcm/ibcm. html. Maintained by NOAA/NGDC WDC for MGG, Boulder).
Relevance of electronic charts: ECDIS
International Hydrographic Organization regulations require that ships carry either an up-to-date set of hard-copy paper charts, or an approved Electronic Chart and Display System (ECDIS). Performance standards for electronic charts were adopted in 1995, by resolution A.817 (19), which was amended in 1996 by resolution MSC.64 (67) to reflect back-up arrangements in case of ECDIS failure. Additional amendments were made in 1998 by resolution MSC.86 (70) to permit operation of ECDIS in Raster Chart Display System (RCDS) mode, that is, substituting a direct copy of the raster paper chart for a fully interactive electronic system. The amendments to Resolution A.817 (19) state that some ECDIS equipment may operate in RCDS mode when the relevant chart information is not available in vector mode.
Since ECDIS and RCDS displays are intended for safe navigation, the reservations outlined previously in terms of absolute correct depths relative to a stable datum or benchmark and mean sea level all apply. ECDIS/RCDS displays can be a convenient way to scan and search bathymetric data, but they suffer from shoal bias, and may not reveal details of regionally increased depth, or sudden changes of gradient.
Available multibeam surveys, areas covered
EMODnet will develop a metadata map showing the areas covered by all available multibeam surveys on the European shelf. This will combine data on governmental and commercial multibeam surveys. Access to the data is not yet negotiated or under discussion. Figure 4.1 shows a typical national map illustrating the proportion of the national area of jurisdiction which has been mapped systematically with multibeam. The proportion mapped by multibeam is small, and, since the swath width is narrower for shallow water, the rate of coverage for the shallow parts of the European shelf will take many years.
Coastlines and coastal processes
The majority of submerged prehistoric sites found so far are in shallow water, often less than 10 m deep, as shown in Chapter 3. Where the coast itself is complex, with marshes, lagoons, extensive mudflats, or scattered rocky shoals, it is often difficult to obtain a large-scale coastal map which is sufficiently accurate to locate the site in a realistic context in relation to its surroundings. This is especially true for identifying the boundaries of the upper and lower limits of the tidal zone or wave action. Many prehistoric sites have been found intertidally, indicating that there has been a relative change of land–sea level.
Digital representation of the coastline cartographically is complex because the coast itself is complex, and probably contains self-similar patterns at all scales like a fractal. Where the coast is steep and the shore narrow, it is a relatively simple matter to define the coastline by a convention such as the mean sea level, or high-water mark of the Highest Astronomical Tide. The representation digitally is then a matter only of grid resolution. In practice, especially where gradients are low, or there are many coastal rock outcrops, reefs, or marshy islands, for example in the Waddenzee or the Danube Delta, the definition of a map with lines representing the boundary between land and sea becomes extremely complex.
The European Commission DG MARE has invited tenders to develop a prototype digital map of Europe's coastal zone (the land/sea boundary) for inclusion in EMODnet. The contract will have a particular focus on use of high-resolution topographic/bathymetric data and the development of European standards for relevant mapping datums, including a defined coastline boundary at Highest Astronomical Tide and Lowest Astronomical Tide levels. As a prototype, the contract will deliver maps for selected parts of Europe to demonstrate the use and integration of available data and how this can be interfaced with data for terrestrial and deeper water mapping.
Digitized coastlines which are globally available (GEBCO, Central Intelligence Agency World Data Bank II, Flanders Marine Institute/Vlaams Instituut voor de Zee (VLIZ), Global Self-consistent, Hierarchical, High-resolution Geography Database (GSHHG), etc.) are crude when magnified to the local level, often with resolution in steps of 5 km to 10 km. The present EMODnet bathymetry and digitized coastline is at 500 m, but even this is very coarse when studying a local site. Because of the growing political pressure for sophisticated multi-agency coastal management, some countries have programs dedicated to improving the cartographic representation of the coastal zone, linking terrestrial mapping, coastal aerial photography and space remote-sensed (RS) images of the intertidal zone, to charts, and bathymetry, with consistent benchmark datum and geoid (e.g. Guariglia et al. 2006). These programs are not complete.
A comparison of a Google Earth RS image and the 1:25,000 map of the same coastal section illustrates the problem. Figure 4.4 shows Cap Lévi, near Cherbourg in northern France, where there is a submerged Paleolithic site offshore (Cliquet et al. 2011) just east of Biéroc. The aerial photograph taken at an intermediate tidal level shows the rocky foreshore and some offshore rocks breaking the surface. Figure 4.5 shows the same area on the 1:25,000 scale map.
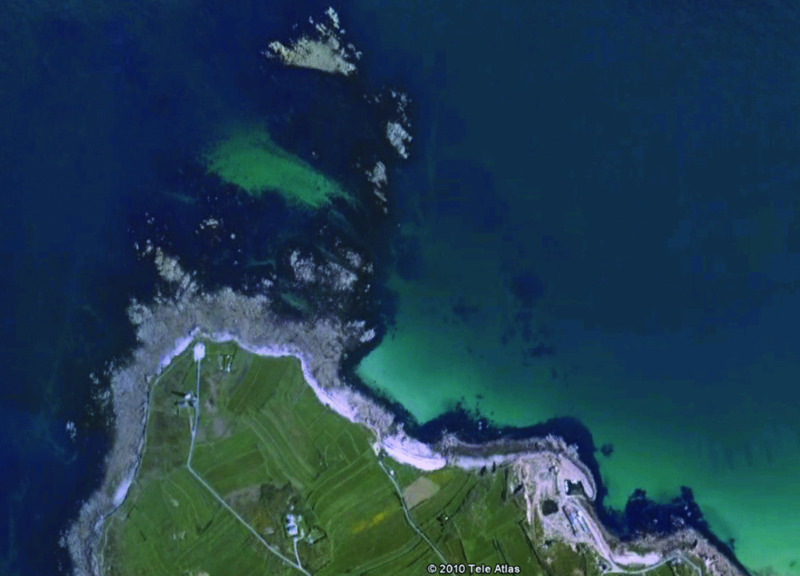
Figure 4.4 Cap Lévi, northern France, near Cherbourg. There is an underwater Paleolithic archaeological site in this area (Cliquet et al. 2011), but accurate definition of the coastline is problematic, due to the large tidal range, and the complex topography. Image from Google Earth, IGN France, Tele Atlas. Reproduced with permission.
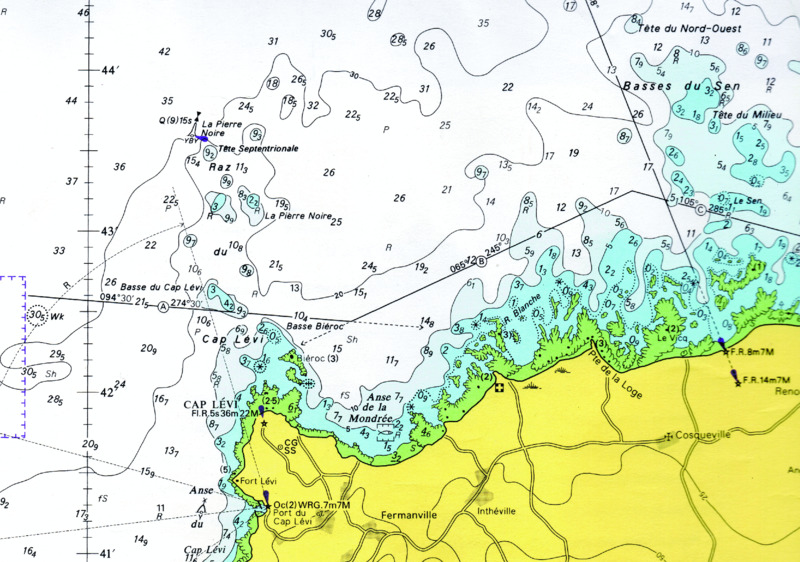
Figure 4.5 Navigational chart representation of Cap Lévi and the bathymetry close to the Paleolithic site off Biéroc. This is from Admiralty Chart 1106 at a scale of 1:50,000. The scale on the left is in arcminutes, where 1 minute = 1850 m. Printed soundings are typically separated by several hundred meters.
The grid of blue lines in Fig. 4.5 shows 1-km spacing. The map represents the coast quite well, with outlines of the rocks at a lower tidal level than in the photograph. The navigational chart for the area shows less coastal detail than the Institut national de l'information géographique et forestière (IGN) map. Digital representation of the coastline at 500 m would remove all the significant detail, and even at 100 m much would be concealed. Thus a European digitized coastline which was useful for coastal submerged and intertidal prehistoric research would have to contain nested scales from the low-resolution overall data set to regional and subregional high resolution.
Coastal processes: coastal behavior and erosion
The EMODnet-Geology Project aims to classify all coastal types in each country at 1:250,000 scale including information on rates of sedimentation and erosion. The central parameter in the final description of coastal behavior is the rate of shore-normal coastline migration. The starting point for information compilation is the EUROSION (a European initiative for sustainable coastal erosion management) database supplemented by data held by the EMODnet partners and sources such as Coastal Erosion and Protection in Europe (Pranzini & Williams 2013) which includes information on Europe's coast on a country-by-country basis.
EUROSION was a project commissioned by the European Commission, which started in January 2002 and ended in May 2004. The project integrated natural and human-induced causes of erosion (storms, seismic movements, reduced sediment supply from rivers due to dams, coastal defenses etc.); different uses of both the terrestrial and marine environments of the coast, ranging from biodiversity and landscape conservation to tourism, industry and transport; and the different levels of management from the local level up to European and regional sea management. Through supporting the Integrated Coastal Zone Management (ICZM) Practitioners Network and facilitating access to relevant data and information, EUROSION offers a follow-up to the EU demonstration program on ICZM.
Solid substrate geology and Quaternary geology
The EMODnet-Geology portal is constructed by a group of national geological survey organizations to provide access to data and metadata held by each organization. The data and map products include information on the seabed substrate (see Fig. 4.6 for example) including rate of accumulation of recent sediments; the seafloor geology (bedrock and Quaternary geology) and all boundaries and faults that can be represented at a compilation scale of 1:250,000 wherever possible. There is an index map showing the scale at which each country has compiled geological maps.
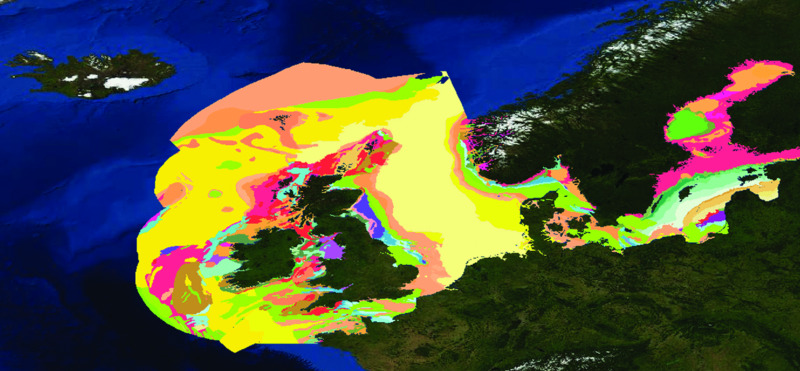
Figure 4.6 EMODnet solid seabed geology portal. Example of bedrock stratigraphy map for northern Europe (EMODnet-Geology Project). From www.emodnet-geology.eu/geonetwork/srv/dut/catalog.map. Reproduced with permission.
The portal also includes information on the lithology and age of each geological unit at the seabed, for minerals, and for geological events and their probability of occurrence. All the interpreted information is based on primary information owned by the project partners, supplemented with other information available in the public domain.
A map of available offshore Quaternary geology information is being compiled using data held by the geological survey organizations of Europe. The proposed map and supporting information will include the age, lithology, genesis, geomorphology, and information about the Quaternary geology at the time of the LGM, where possible. The work will link to the IQUAME 2500 project.
The European national geological services are collaborating to produce offshore data in a project called Geo-Seas. Additionally, at a fully international level, agencies are collaborating through a portal network called OneGeology, available at the following URLs: www.geo-seas.eu/content/content.asp?menu=0030011_000000andportal.onegeology.org/
Sediments
Recent sediments on the continental shelf are important factors in locating prehistoric sites, either on the exposed seabed, or buried in the sedimentary column, see for example Fitch et al. (2005), Gaffney et al. (2007) and van Heteren et al. (2014). The following variables are of particular relevance:
- sediment grain size, type, and sorting on the seabed;
- thickness to the bottom of modern marine sediments, LGM;
- thickness to the base of the Pleistocene.
The British Geological Survey (BGS) collaborated with its opposite numbers in the Netherlands and Norway during the 1980s to produce a series of seabed sediment maps of the North Sea at a scale of 1:250,000. These maps, and the associated cores, are a useful tool for assessing the archaeological potential and sensitivity of areas of the sea floor, providing classification of surface sediments by grain size, thickness of active marine sediments, thickness of Holocene deposits, standard cross-sections, information on tidal currents, sand waves and sand ripples, carbonate percentage, and other items of information which vary from sheet to sheet. Some sheets, but not all, include copious technical notes, sections, core profiles, and analyses of sources, references, and comments on the various facies. All sheets show positions of platforms and pipelines at date of publication. The data sets are available electronically under license, with information at the following site: www.bgs.ac.uk/discoverymetadata/13605549.html
In general, seabed sediment data at low resolution can be obtained from EMODnet, and high-resolution data by contacting national geological agencies. An example of the EMODnet data access display is shown in Fig 4.7.
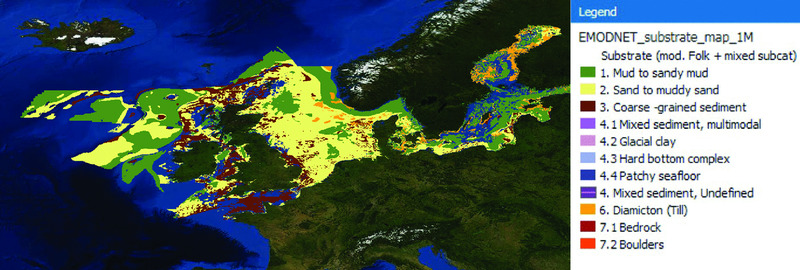
Figure 4.7 EMODnet seabed sediments. From www.emodnet-geology.eu. Reproduced with permission.
European-scale data on Quaternary marine and coastal features
This section is concerned with European-scale data sets and mapping programs which include Quaternary landscape features. A later section will review the interpretation of individual submerged features. The International Union for Quaternary Science (INQUA) has five commissions (Coastal & Marine Processes; Humans & the Biosphere; Palaeoclimates; Stratigraphy & Chronology; Terrestrial Processes, Deposits & History) which provide leadership in different spheres of research, and are responsible for ensuring that INQUA scientists remain at the forefront of their fields. INQUA currently funds projects of relevance to marine archaeology under each theme. These include:
- – MEDFLOOD: MEDiterranean sea-level change and projection for future FLOODing (www.med flood.org/);
- – PALSEA2: PALeo-constraints on SEA-level rise 2 (people.oregonstate.edu/∼carlsand/PALSEA2/Home. html);
- – Humans and biosphere: Modeling human settlement, fauna and flora dynamics in Europe during the Mid-Pleistocene Revolution (1.2–0.4 Ma);
- – Cultural and paleoenvironmental changes in Late Glacial to Middle Holocene Europe: gradual or sudden?
- – DIG – 1st Workshop on DInaric Glaciation: Early/ Middle Pleistocene glaciations of the northeast Mediterranean;
- – SEQS (Section on European Quaternary Stratigraphy) Framing European Quaternary Stratigraphy;
- – UNESCO-IUGS-IGCP521-INQUA501 WG12. Black Sea-Mediterranean corridor during the last 30 ky: sea level change and human adaptation.
The IQUAME 2500 Project is a joint initiative of the Commission for the Geological Map of the World (CGMW)/INQUA/BGR — Bundesanstalt für Geowissenschaften und Rohstoffe [German Federal Institute for Geosciences and Natural Resources], which is reviewing the International Quaternary Map of Europe (Asch & Müller (2008). Through common partners such as the BGS, links are being made between the IQUAME 2500 Project such that the EMODnet-Geology Project group will provide the marine input to the map thereby developing a baseline Quaternary geology map of both the land and marine areas of Europe. The projects will compile information on the age, lithology and genesis of Quaternary deposits as well information on glacial maxima.

Figure 4.8 Three types of paleo-geomorphology revealed by reprocessing commercial seismic data from the central North Sea. A tunnel valley scoured by melt water under a previous ice sheet has been infilled by sediment and is then overlain by a low gradient river and marshes. Image provided by V. Gaffney.
Sub-bottom acoustic data
Each chapter on regional sea areas in this volume will provide examples of the use and interpretation of sub-bottom acoustic data in the search for buried Quaternary landscapes and shorelines. In the EMODnet system sub-bottom profiler data and metadata are accessed through the Seabed Habitats sub-portal. Enormous volumes of sub-bottom data are held by commercial organizations in support of offshore engineering, foundations, port excavation, pipelaying, and the construction of wind farms. Examples of the interpretation of sub-bottom acoustic profiles and 3D reconstructions for research into prehistoric landscapes are provided by Fitch et al. (2005), Gaffney et al. (2007; 2009; Figs. 4.8 & 4.9), and van Heteren et al. (2014) for the North Sea. Examples from the Mediterranean include Lykousis (2009), and Lobo et al. (2014).
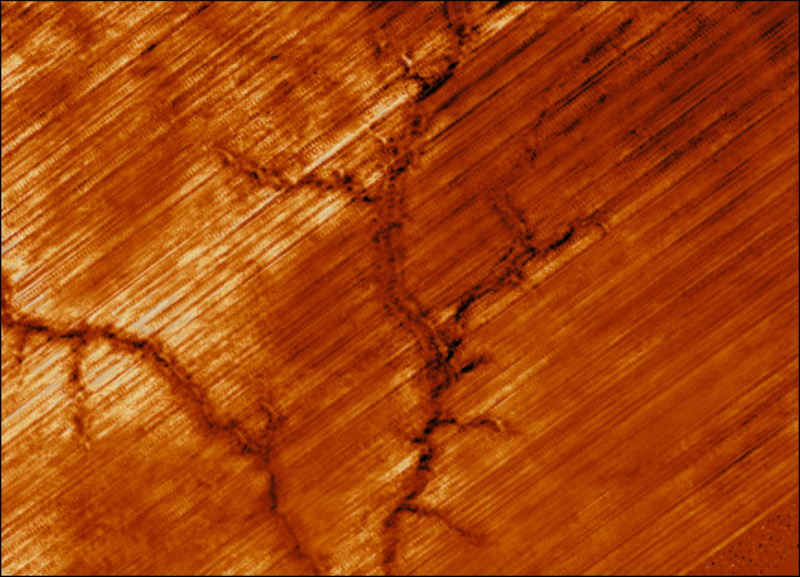
Figure 4.9 Buried river-drainage system revealed with the sediment column of the central North Sea. Gaffney et al. (2007). Reproduced with permission.
Seabed core data
The EuroCore project holds data on cores taken from sea depths greater than 200 m, and therefore these are not relevant to Pleistocene low sea-level landscapes. Cores taken on the continental shelf are physically held in stores operated by national geological services, and the metadata are also held in comprehensive searchable data systems at the national level. The example for the BGS catalogue of marine sample sand cores is at this address: www.bgs.ac.uk/discoverymetadata/13603048.html and French core data can be identified in this database: www.ifremer.fr/sismer/UK/catal/base/edmed_an.htql?CBASE=GMCAR
Examples of Seabed Features Relating to Terrestrial Landscapes
Geomorphological or dynamic features of the seabed may themselves be related either to modern marine sediments or to previous terrestrial landscapes. Thus the identification and classification of features is a necessary stage in constructing a paleolandscape. As explained in the section on bathymetry, navigational charts and low-resolution digital terrain mapping can give an excellent impression of the gross topography of large sea areas, but they are not so effective at revealing individual geomorphological features. Objects of interest are shown in Table 4.1.
Table 4.1 Examples of seabed features of interest relating to formerly terrestrial landscapes.
| Submerged terrestrial landscape features which may be identified | Dynamic modern seabed marine sediment morphology, bedforms |
| River valleys Glacial valleys Braided and sinuous patterns of river drainage Moraines, eskers, glacial deposit features Ice cap margin thrust features Ice tunnels River deltas Cliffs, either sea coast eroded or vertical fault scarps Cliff-terrace junctions Periglacial features, patterned ground, roches moutonnées, etc. Coastal dune ridges, often calcified or indurated eolianite Lagoons and marshes, coastal islands and coastal sand bars Freshwater lake basins, ice--dammed lake basins Peat bog Coral terraces, or vermettid terrace Caves, karstic sinkholes, sea caves in cliffs Submerged freshwater springs Drowned forests Beach terraces Beachrock |
Sand banks Sand waves Sand or gravel ripples Mobile sand dunes or barchan features Density flows of sediments, and sediment fans Turbidity flows Sand ribbons, transport streams Shell gravels Iceberg scour marks Methane pock-marks Low gradient silt or mud Lag deposits (possibly derived from terrestrial mixed sediments) Tsunami deposits Bedrock outcrops, scarps, bedding, etc. |
The types of landforms or marine bedforms that can potentially be identified from a seabed topographic map depend on the procedures used to compile the map, and its resolution. Lead-line soundings from over 100 years ago produce widely-spaced point soundings, and therefore could only reveal topographic highs and lows at the coarsest level. If point soundings are 1 km apart, the smallest hill or valley which can be defined is a curve 2 km to 3 km across. Analogue paper-recording echo sounding, common from the 1930s to 1980s, provided a continuous visual record of depth and gradient, and thus, if required, could be used to identify the sharp changes in gradient which often indicate structural surface features. Digital recording single-beam echo sounding does not show changes of gradient unless a deliberate effort is made to view profiles and plots of the raw data. Even then, the recorded data points may be separated by 100 m or more. Most plotting, gridding, contouring and presentation algorithms remove abrupt changes of gradient, and result in smooth curves, but special programs to detect rapid changes of gradient can be applied (see pages 99–100). Side-scan sonar, used widely from the 1960s to the present day, also reveals the edges of topographic structures, but is not often used to support topographic mapping. Swath bathymetric or multibeam surveys do reveal high-resolution topography with the edges of features defined by changes of gradient, (Figs. 4.8–4.11) but only if the data are not aggregated into cells and gridded with smoothing or coarse algorithms. The raw data must be examined to find the tell-tale edges of features.
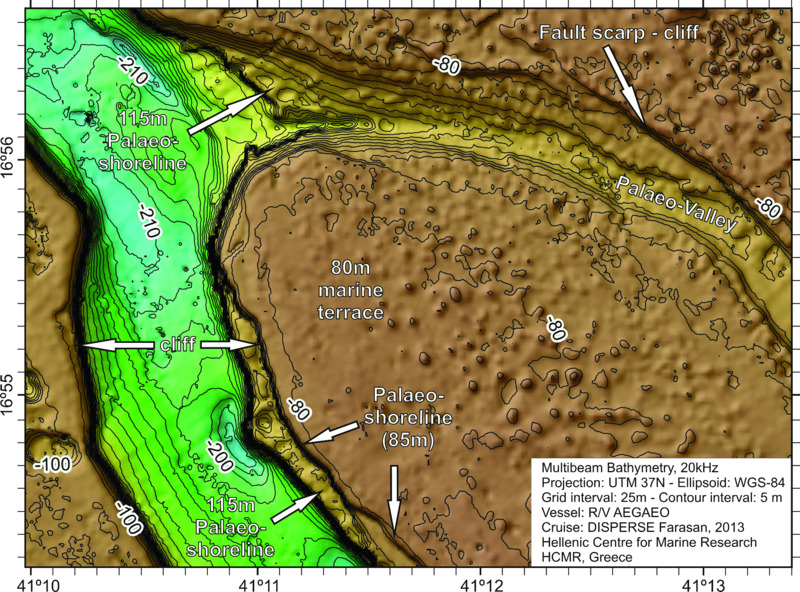
Figure 4.10 Multibeam image of rugged rocky topography with steep cliffs, close to the Farasan Islands, Red Sea. This image was compiled during a survey of prehistoric submerged landscapes during the DISPERSE (Dynamic Landscapes, Coastal Environments and Human Dispersals) project. Note the ability of the technology to reveal vertical and near-vertical features, and to delineate abrupt changes of gradient and flat terraces. The landscape exhibits faulting due to underlying salt karst, coastal erosion terraces from past low sea levels, and drainage courses indicating past river flow. Image HCMR, courtesy of Sakellariou et al. (2015). From the Proceedings of the 11th Panhellenic Symposium of Oceanography and Fisheries. Reproduced with permission.
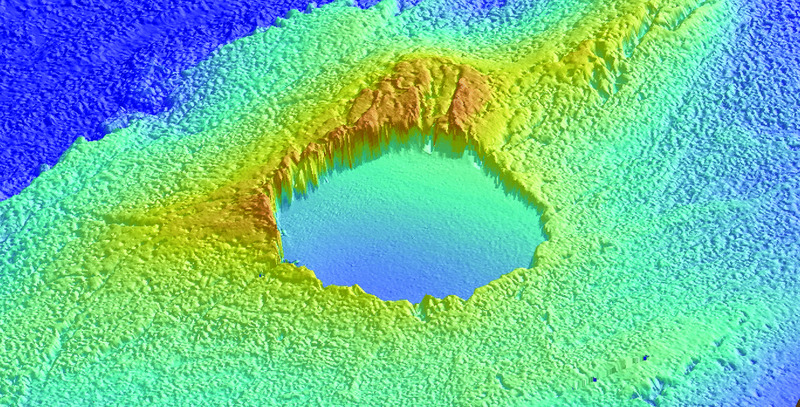
Figure 4.11 A recent survey by the University of Malta and the UK National Oceanography Centre (NOC) of limestone ridges near Malta unexpectedly revealed the clear form of a collapsed sinkhole. Tim Le Bas (NOC), from Micallef et al. (2013). Reproduced with permission from John Wiley & Sons Ltd.
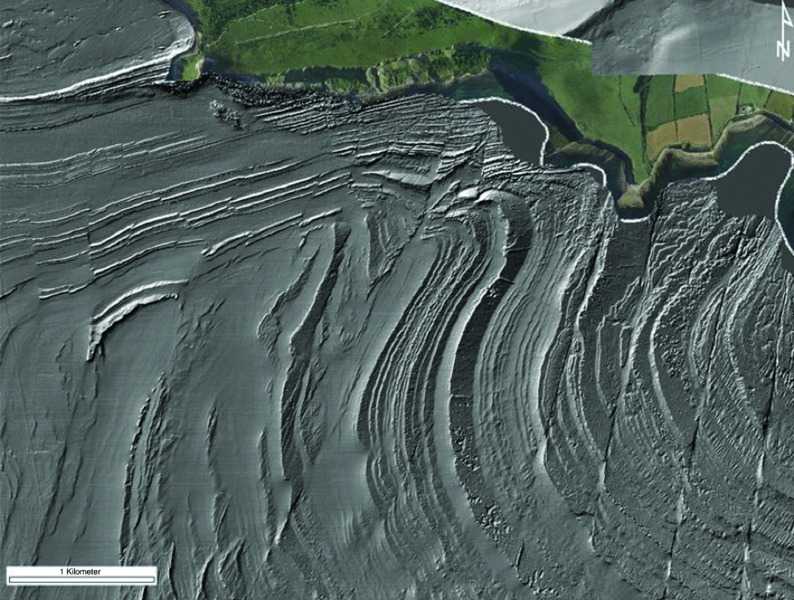
Figure 4.12 The plunging anticline in Kimmeridge Bay, Dorset coast, English Channel. Data binned in 1-m intervals, and then ‘hill-shaded’. The structure of bedrock swept almost clean of marine sediments is apparent. Image courtesy of J.Dix, University of Southampton.
Many geomorphological features which we identify instantly on land are defined by a line-boundary which is the intersection of two surfaces of different gradients. Whether it is a scarp-fault of sheer rock, a river bank, the junction between a talus scree and the underlying terrace, or the flat alluvial-filled basin of a dead lake, the feature is defined by line boundaries, although they may not be straight lines, or confined to a single plain. High-resolution multibeam is providing the data that resolves these indicators, but it will take many years to map the whole European shelf by this method. An example of a feature which is revealed with sharp edges and vertical surfaces is one of the submerged karstic sinkholes recently discovered off the coast of Malta (Fig. 4.11).
The discrepancy in information produced by widely spaced soundings regarding geomorphological bedforms, whether marine or terrestrial in origin, can further be illustrated by Figs. 4.9 to 4.13. Each of these images has been chosen to show the true detail available to analyze bedform, and the extremely false impression that would be obtained by having a representation based on point soundings spaced by 1 km to 2 km.
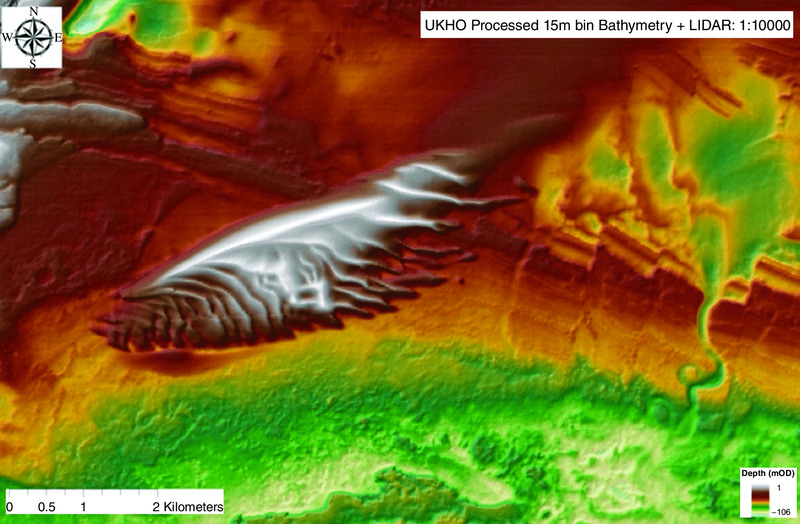
Figure 4.13 This color-coded bathymetric image of the seabed near Portland Bill, Dorset coast, shows the dune-rippled surface of the Brambles Bank, underlying bedrock with dipping strata and fault offsets, and a sinuous eroded river valley. Image courtesy of J. Dix, University of Southampton, from UKHO processed data.
Automatic Feature Recognition
There is a substantial literature on the association between terrestrial landscape and occupied site distribution for a wide range of prehistoric periods, although precise individual site location cannot be predicted from underwater landscape. It follows that the ability to recognize geomorphological features underwater automatically would be a useful and efficient tool if it could be used reliably with digital data sets. This is not yet possible, but rapid progress is being made in the study of automatic geomorphometrics. Goodwyn et al. (2010) use a rule-based system and predictive modeling to classify areas of the UK seabed as potentially rich or poor in containing prehistoric sites, and similar studies have been conducted for Dutch and German waters to indicate and classify areas that need extra protection. For image interpretation on land, research has been conducted to extract features automatically such as rivers, stream beds, watershed, roads, buildings, etc. (for example, see Quackenbush (2004)). Automatic recognition of coastlines is also considered by Guariglia et al. (2006). Given high-resolution digital terrain data on land with a resolution of 1.0 m to 0.25 m, geomorphometric analysis can extract the underlying lithological geology and fracture patterns (Coblentz et al. 2014). Micallef et al. (2007; 2013) refer extensively to similar literature in their analyses of the digital terrain data around Malta. This note can only provide a brief mention of this subject, and the bibliographies of the papers cited provide access to the wider literature.
Recommendations
Digital archives of core environmental seabed variables on a European scale provide the potential support for a wide range of research topics in continental shelf prehistoric research projects, both at the basin scale linking large regional groups of coastal states, and more locally where two or three states may wish to collaborate on prehistoric sites at high resolution. Additionally, a shared system with common access would make such research projects easily accessible to third parties. Through EMODnet, SeaDataNet, and other European programs and projects, the data management work necessary to achieve this objective has started. The process of merging national and commercial data sets, with the associated necessity for checking accuracy and metadata conventions, will continue for several years. Bathymetry is most nearly available in the required form; geological variables, both bedrock and sedimentary, are in preparation and well advanced. Coastline mapping is receiving research funding and investment, but seems to be still a problem at the detail required. At the subregional and local levels where very large scales and high resolution are required, national and institutional data sets are necessary and often available in hard copy, but not always digitized.
References
- Asch, K. & Müller, A. 2008. International Quaternary Map of Europe. Bundesanstalt für Geowissenschaften und Rohstoffe, in cooperation with the INQUA Commission for the International Quaternary Map of Europe.
- Bridgland, D. R. 2002. Fluvial deposition on periodically emergent shelves in the Quaternary: example records from the shelf around Britain. Quaternary International 92:25-34.
- Cliquet, D., Coutard, S., Clet, M. et al. 2011. The Middle Palaeolithic underwater site of La Mondrée, Normandy, France. In Benjamin, J., Bonsall, C., Pickard, C. & Fischer, A. (eds.) Submerged Prehistory. pp. 111-128. Oxbow Books: Oxford.
- Coblentz, D., Pabian, F. & Prasad, L. 2014. Quantitative Geomorphometrics for Terrain Characterization. International Journal of Geosciences 5:247-266.
- Collina-Girard, J. 2002. Underwater mapping of Late Quaternary submerged shorelines in the Western Mediterranean Sea and the Caribbean Sea. Quaternary International 92:63-72.
- Fitch, S., Thomson, K., & Gaffney, V. L. 2005. Late Pleistocene and Holocene depositional systems and the palaeogeography of the Dogger Bank, North Sea. Quaternary Research 64:185-196.
- Flemming, N. C. 1972. Relative chronology of submerged Pleistocene marine erosion features in the Western Mediterranean. The Journal of Geology 80:633-662.
- Flemming N. C., Çağatay M. N., Chiocci F. L. et al. 2014. Land Beneath the Waves: Submerged Landscapes and Sea Level change. A Joint Geoscience-Humanities Research Strategy for European Continental Shelf Prehistoric Research. Chu N.-C. & McDonough N. (eds.) Position paper 21 of the European Marine Board: Ostend, Belgium.
- Gaffney V., Thomson, K. & Fitch, S. (eds.) 2007. Mapping Doggerland: The Mesolithic Landscapes of the Southern North Sea. Archaeopress: Oxford.
- Gaffney V., Fitch, S. & Smith, D. 2009. Europe's Lost World: the Rediscovery of Doggerland. CBA Research Report 160. Council for British Archaeology: York.
- Goodwyn, N., Brooks, A. J. & Tillin, H. 2010. Waterlands: Developing Management Indicators for Submerged Palaeoenvironmental Landscapes. Report prepared under the Marine Aggregates Levy Sustainability Fund (Ref No. MEPF 09/P109). ABP Marine Environmental Research.
- Guariglia, A., Buonamassa, A., Losurdo, A. et al. 2006. A multisource approach for coastline mapping and identification of shoreline changes. Annals of Geophysics 49:295-304.
- Hubbard, A, Bradwell, T, Golledge, N. et al. 2009. Dynamic cycles, ice streams and their impact on the extent, chronology and deglaciation of the British–Irish ice sheet. Quaternary Science Reviews 28:758-776.
- Lambeck, K., Anzidei, M., Antonioli, F., Benini, A. & Esposito, A. 2004. Sea level in Roman time in the Central Mediterranean and implications for recent change. Earth and Planetary Science Letters 224:563-575.
- Lobo, F. J., Ercilla, G., Fernández-Salas, L. M. & Gámez, D. 2014. The Iberian Mediterranean shelves. In Chiocci, F. L & Chivas, A. R (eds.) Continental Shelves of the World: Their Evolution During the Last Glacio-Eustatic Cycle (Geological Society Memoir No. 41). pp. 147-170. Geological Society: London.
- Lykousis, V. 2009. Sea-level changes and shelf break prograding sequences during the last 400 ka in the Aegean margins: Subsidence rates and palaeogeographic implications. Continental Shelf Research 29:2037-2044.
- Micallef, A., Berndt, C., Masson, D. G. & Stow, D. A. V. 2007. A technique for the morphological characterization of submarine landscapes as exemplified by debris flows of the Storegga Slide. Journal of Geophysical Research F (Earth Surface) 112: F02001, doi:10.1029/2006JF000505.
- Micallef, A., Foglini, F., Le Bas, T. et al. 2013. The submerged paleolandscape of the Maltese Islands: Morphology, evolution and relation to Quaternary environmental change. Marine Geology 335:129- 147.
- Peeters, H., Murphy, P. & Flemming, N.C. (eds.) 2009. North Sea Prehistory Research and Management Framework (NSPRMF) 2009. English Heritage and RCEM: Amersfoort.
- Pranzini, E. & Williams, A. (eds.) 2013. Coastal Erosion and Protection in Europe. Routledge: Abingdon.
- Quackenbush, L. J. 2004. A review of techniques for extracting linear features from imagery. Photogrammetric Engineering & Remote Sensing 70:1383-1392.
- Sakellariou, D., Bailey, G., Rousakis, G. et al. 2015. Quaternary geology, tectonics and submerged landscapes of the Farasan continental shelf, Saudi Arabia, South Red Sea: Preliminary results. Proceedings of the 11th Panhellenic Symposium of Oceanography and Fisheries, 13th – 17th May 2015, Mytilene, Lesvos Island, Greece, pp. 985-988.
- Stoker, M. & Bradwell, T. 2009. Neotectonic deformation in a Scottish fjord, Loch Broom, NW Scotland. Scottish Journal of Geology 45:107-116.
- van Heteren, S., Meekes, J. A. C., Bakker, M. A. J. et al. 2014. Reconstructing North Sea palaeolandscapes from 3D and high-density 2D seismic data: An overview. Netherlands Journal of Geosciences 93:31-42.