1 Introduction
Recent advances in machine learning and deep learning enable the design and implementation of novel data analysis pipelines that allow fusing heterogeneous data sources to extract novel insights and predictive patterns. These approaches seem particularly suitable to help increasing our insights in the relationships between the urban landscape of cities and the behavior of their residents, with particular focus on well-being and healthcare indexes. In this context, it can be of interest of health care planners and city decision-makers to have instruments able to find clusters of city areas that share similar urban structures and to analyze some behavioral indexes of their residents, in particular to see potential correlations and to plan similar interventions in the different clusters, even if such clusters contain areas that are geographically far. We have applied such approach in the context of the PULSE (Participatory Urban Living for Sustainable Environment) EU-project1. PULSE aims at developing a set of models and technologies to predict and manage public health problems in cities and promote health. It follows a participatory approach where citizen provide data through personal devices that are integrated with information from heterogeneous sources: open city data, health systems, urban sensors and satellites. The project deals with various issues concerning air quality, lifestyle and personal behavior and it aims to investigate the correlations between the exposure to atmospheric pollutants, the citizen habits and the health of the citizen themselves, focusing on asthma and type 2 diabetes. PULSE is being implemented in 5 major cities all over the world. Within PULSE, we are implementing a data analytic platform that will provide public health decision makers with advanced approaches to jointly analyze maps and geospatial information with health care data and air pollution measurements.
In this paper we will describe the results obtained with a prototypical component of such platform, designed to couple deep learning analysis of geospatial images of cities and some healthcare and behavioral indexes, showing that in New York City urban landscape significantly correlates with the access to healthcare services.
2 Deep Learning and Transfer Learning Models
Deep neural models provide flexible instruments to perform non-linear approximation of a variety of multivariate functions and to extract latent variables from a data set. In a nutshell, deep neural models are neural networks with many layers, able to map non-linear functions with a number of parameters that is typically lower than their equivalent models with one layer only. Such models are particularly attractive since they can be used to perform clustering, regression and classification starting from data sets made of images, texts, time series.
In dependence of the nature of the input data set, different architectures can be exploited, ranging from the combination of many Convolutional layers in the case of images to the use of Long-term/Short-term networks in the case of time series and speech/text data.
Recently, an increasing number of papers are using deep learning to examine the relationships between the urban landscape and some environmental or citizens’ behavioral data [1–3].
One of the main limits of deep learning models is related to the need of very large data sets in order to be able to gain advantage of their capability of encoding even the finest details that can be important to map input data, without getting trapped into noise and poor parameters estimates.
Rather interestingly, in order to deal with this problem, it is possible to resort to an increasing set of pre-trained deep learning models that can be used for the task of transfer learning [4], i.e. models that are able to represent the input space into a set of latent variables on the basis of a mapping mechanism, usually a deep neural network, learned on a large (external) data set, so that the relationships between such latent variables and the outcomes can be later learned on a specific and smaller data set. A well-known example is Inception-v3, a convolutional neural network trained on more than a million images from the ImageNet database (http://www.image-net.org). The network has 48 layers and can classify images into one thousand object categories, including trees and many animals. Another interesting example is represented by the Painters [5] networks, developed to automatically classify Paintings of famous artists. In principle, any of those methods can be used following the transfer learning paradigm to represent images coming from urban landscape of New York City.
3 Data and Methods

NAIP image of NYC.
As it will be explained in the following, the reason for the downsampling is that the big image has been subdivided into tiles and the neural network adopted can accept images having maximum size of 299 pixel; we had to tune the ground resolution in order to have meaningful tiles, embracing a sufficiently-sized area.
500 cities measures grouped by category. The 27 measures include 13 health outcomes, 9 prevention practices and 5 unhealthy behaviors.
Category | Measure |
|---|---|
Health outcomes | Arthritis among adults aged ≥18 years Current asthma among adults aged ≥18 years High blood pressure among adults aged ≥18 years Cancer among adults aged ≥18 years High cholesterol among adults aged ≥18 years who have been screened in the past 5 years Chronic kidney disease among adults aged ≥18 years Chronic obstructive pulmonary disease among adults aged ≥18 years Coronary heart disease among adults aged ≥18 years Diagnosed diabetes among adults aged ≥18 years Mental health not good for ≥14 days among adults aged ≥18 years Physical health not good for ≥14 days among adults aged ≥18 years All teeth lost among adults aged ≥65 years Stroke among adults aged ≥18 years |
Prevention | Current lack of health insurance among adults aged 18–64 years Visits to doctor for routine checkup within the past year among adults aged ≥18 years Visits to dentist or dental clinic among adults aged ≥18 years Taking medicine for high blood pressure control among adults aged ≥18 years with high blood pressure Cholesterol screening among adults aged ≥18 years Mammography use among women aged 50–74 years Papanicolaou smear use among adult women aged 21–65 years Fecal occult blood test, sigmoidoscopy, or colonoscopy among adults aged 50–75 years Older adults aged ≥65 years who are up to date on a core set of clinical preventive services by age and sex |
Unhealthy behaviors | Binge drinking among adults aged ≥18 years Current smoking among adults aged ≥18 years No leisure-time physical activity among adults aged ≥18 years Obesity among adults aged ≥18 years Sleeping less than 7 h among adults aged ≥18 years |
The measures include major risk behaviors that lead to illness, suffering, and early death related to chronic diseases and conditions, as well as the conditions and diseases that are the most common, costly, and preventable of all health problems.
3.1 The Data Analysis Pipeline
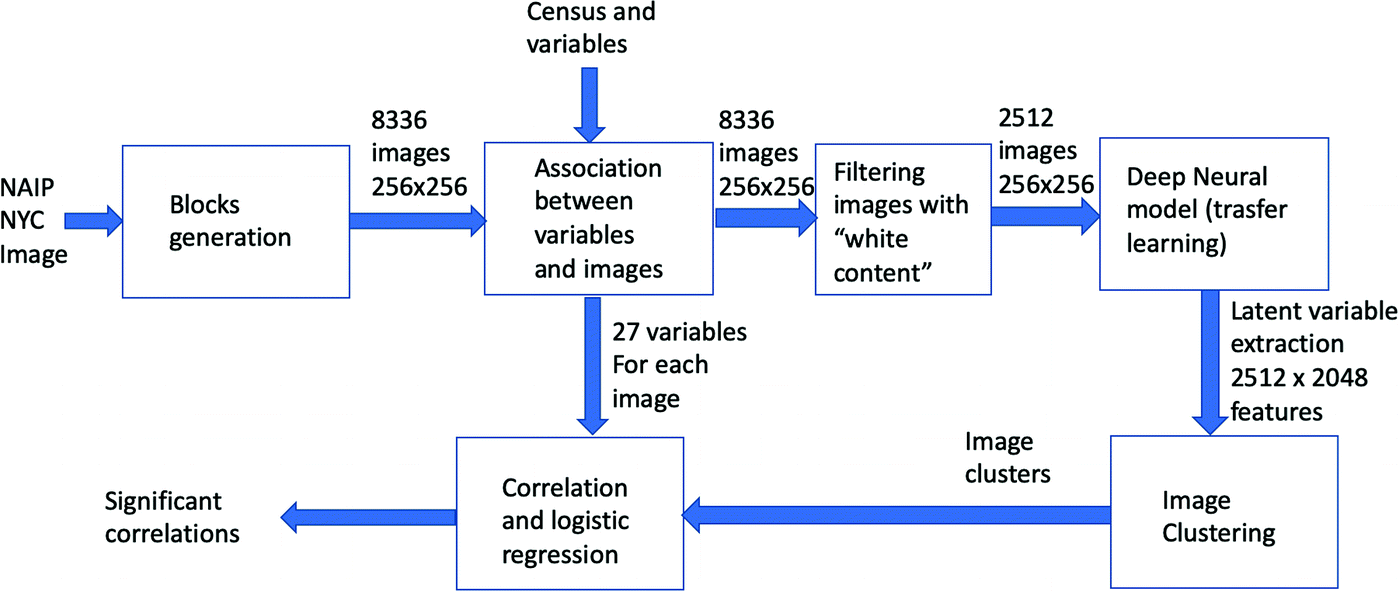
The data analysis pipeline
3.2 Image Blocks

The quantification of the healthcare index value (SLEEP) of a block.
It is possible to note that some of the squares have white areas, corresponding to unmapped zones, due to the irregular borders of the image and to the presence of sea, rivers. Due to the availability of the vector map of the borders of NYC, we have been able to quantify, for each tile, the amount of its surface lying inside the borders of the city; we then filtered the original tile set and maintained only those having a minimal overlapping of 90%.
3.3 Estimation of the Healthcare Indexes for Each Image Block

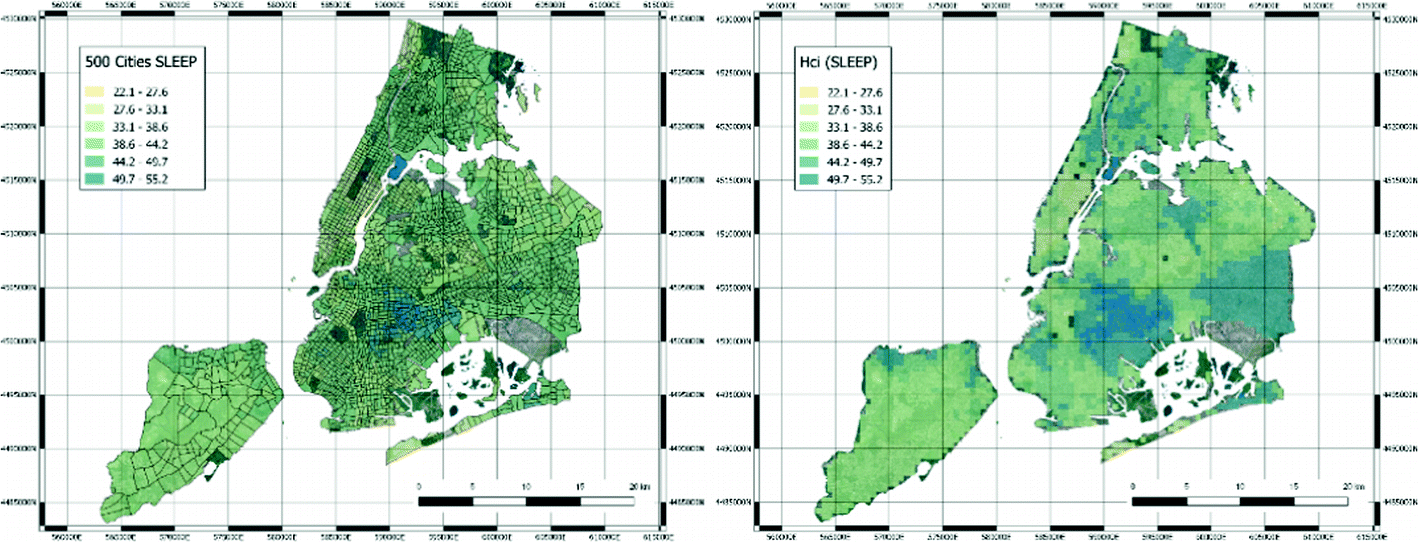
Original census tracts with the 500 Cities SLEEP index (left hand side) and derived quantification of the healthcare index values for SLEEP variable (right hand side).
In order to properly quantify hcis, the blocks with a white area greater than 10% of the image have been removed. The final number of image blocks used for the following analysis has thus lowered to 2512 images. Each image has been then processed by resorting to a deep neural model to extract a set of latent features.
3.4 Deep Neural Networks Processing and Clustering
As a deep neural network model used for transfer learning, we have selected the network developed for the 2016 Painters by number competition [6]. In such competition the goal was to learn how to discriminate the authors of paintings between 1584 unique painters, starting from a training set of 79433 instances; the test set was composed of 23817 instances. In this case, a deep neural network model was learned, with 23 layers, mostly convolutional layers with some max pooling layer. The Painters network computes a layer of 2048 latent variables before the final discrimination layer implemented with a soft-max non-linear function. Those latent variables can be used as a way to embed generic images in the latent space. Therefore, using the software Orange (https://orange.biolab.si) and its Python pipeline, we have processed all image blocks with the Painters model, thus obtaining a final data matrix of 2512 examples with 2048 features.
Such features have been used to cluster the image blocks by resorting to the well-known K-means clustering algorithm. The value of K has been derived with a grid search between 2 and 6 and taking the value that maximize the Silhouette coefficient.
3.5 Correlation and Statistical Analysis
The final step of the data analysis pipeline is represented by the search of statistical correlations between the clusters and their hcis. Univariate multinomial logistic regression was applied to estimate the probability to belong to a specific cluster given single variables’ values. Multivariate multinomial logistic regression was performed after removal of samples characterized by missing values. A backward stepwise selection procedure based on AIC was applied to identify the most informative set of variables jointly modulating the probability to belong to the clusters. Multinomial logistic regression and the stepwise selection procedure were implemented in the R packages “nnet” and “stats”, respectively. Analyses were performed by the R software tool version 3.5.1 (http://www.r-project.org).
4 Results
4.1 Clustering
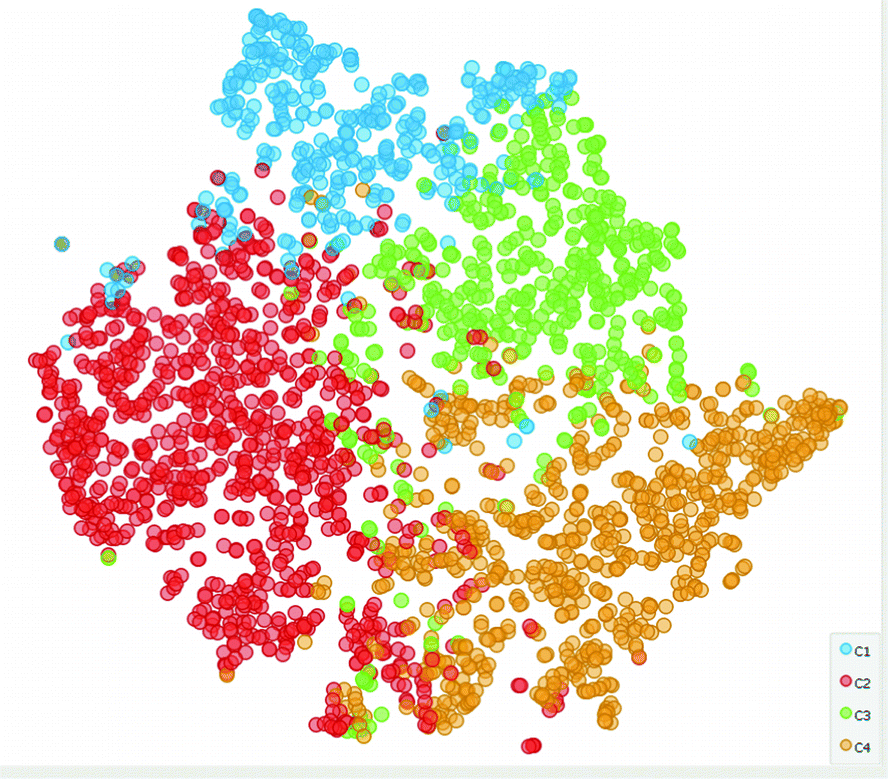
The tSNE representation of the data with colors identifying the four clusters.
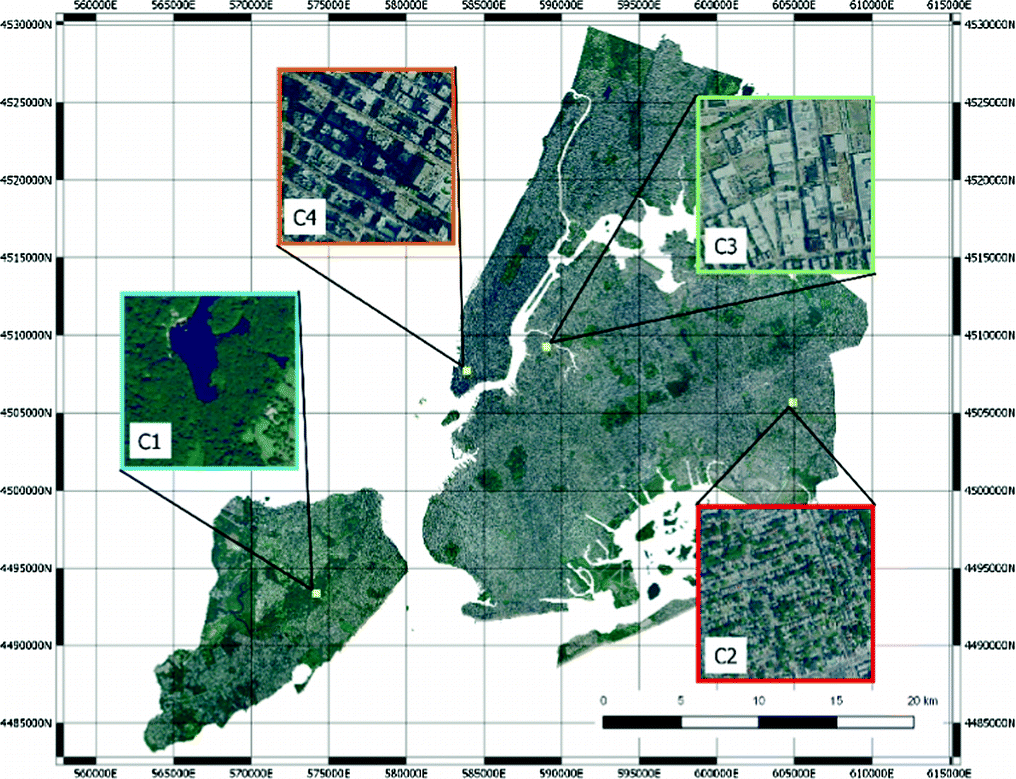
Four images representing the clusters.
4.2 Correlation and Statistical Analysis
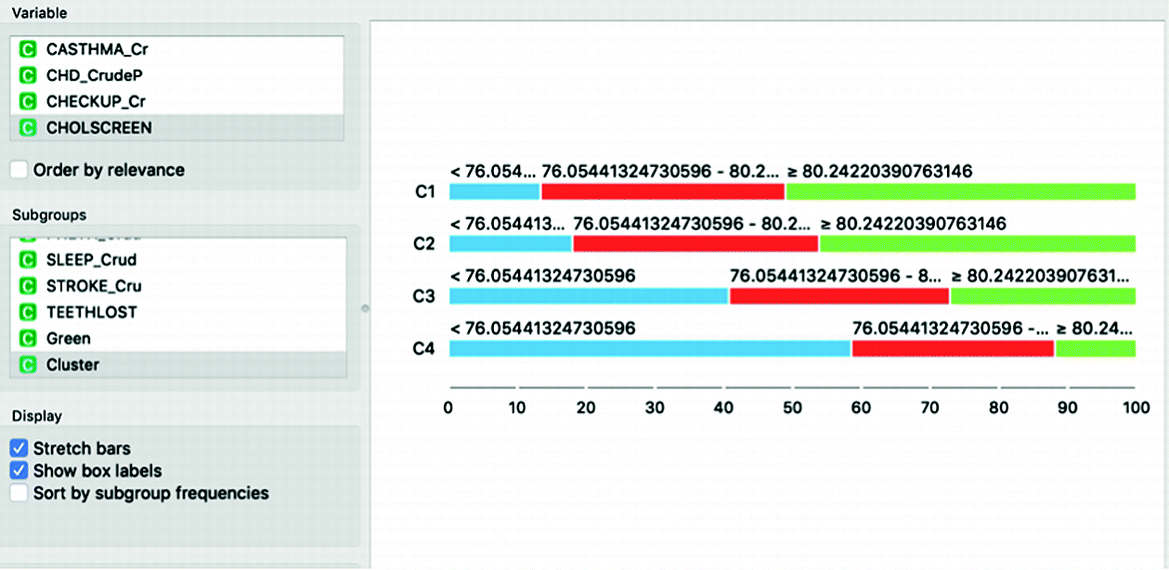
The different distributions of Cholesterol screening among adults aged ≥18 years in the different clusters. Inhabitants of cluster C1 have much higher propensity towards screening than those who live in Cluster C4.
In general, cluster C1, which is the one that groups green areas, has consistently better prevention and health indicators, but worse sleeping indexes and leisure time. Overall, there is a gradient with all indexes moving from cluster C1, to C2, to C3 and finally to C4, which are the residential areas with large buildings.
A multivariate multinomial logistic regression has been performed to assess if significant correlations are present even in the multivariate setting. In this case, after a stepwise feature selection process, 20 variables have been selected. Of those, five variables have been found to be significant (p ≪ 0.01) in all sub-regressions performed by the multinomial model: Colon screening (Fecal occult blood test, sigmoidoscopy, or colonoscopy among adults aged 50–75 years), Chronic obstructive pulmonary disease among adults aged ≥18 years, High cholesterol among adults aged ≥18 years who have been screened in the past 5 years, Chronic kidney disease among adults aged ≥18 years and finally Stroke among adults aged ≥18 years.
4.3 Mapping
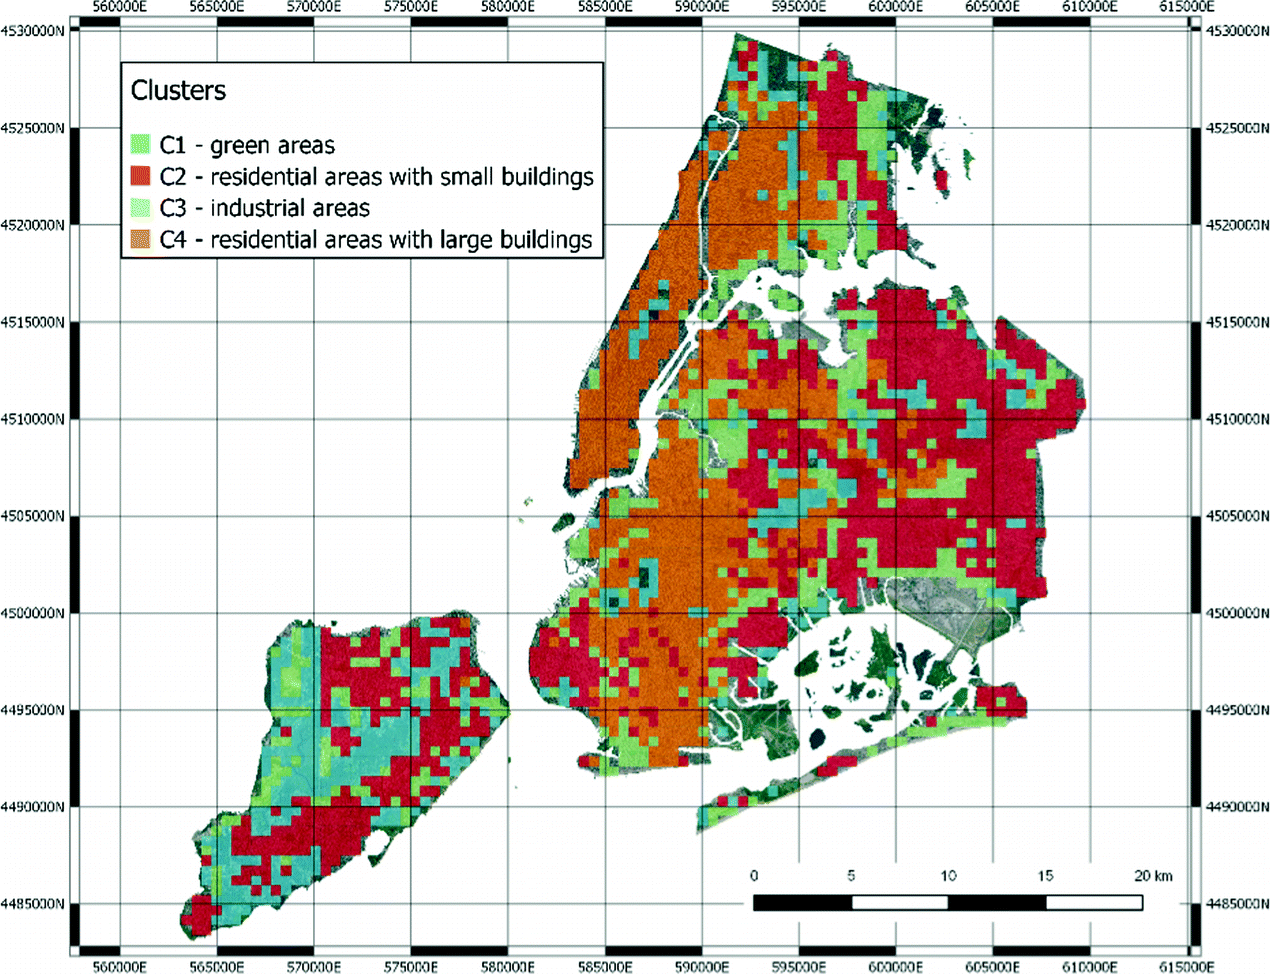
The clusters remapped in NYC. (Color figure online)
We can find green areas (C1), residential areas with larger buildings (C2), industrial areas (C3) and finally residential areas (C4).
5 Discussion and Conclusions
The data analysis pipeline described in this paper shows that it is possible to automatically correlate urban landscape with healthcare indicators at the whole city level. In the NYC case, such correlation seems particularly strong, probably because of social factors, which, in the US society, makes health indicators related to the urban areas where people live.
Our work has a number of implications.
First of all, it shows that deep neural networks designed to encode image data can be successfully reused within transfer learning approaches. Their application to represent urban landscape seems very effective.
Second, in the context of the PULSE project, the capability of finding clusters of similar urban landscape may allow to profile city areas, in which health care decision makers may plan similar interventions.
Finally, the combination of urban landscape and healthcare indicators is not only useful to hypothesize the intertwining of these two dimensions, but also to further profile urban areas by finding similar areas with similar behaviors of their inhabitants, thus allowing also life style interventions and more “precise” health care policies.
Of course, the analysis has some limitations. First of all, the “quantification” of the health care indexes in the city blocks have been performed by a weighted averaging of the indexes of the census tracts included in the blocks. The weights are computed taking into account only the spatial overlap and not the actual number of inhabitants of the blocks. Second, the results obtained are probably “proxies” of the wealth of the people living in the different areas. For this reason, results may be representative of specific cities and not generalizable to other ones.
Acknowledgement
The work is part of the project PULSE, H2020 - 727816, funded by the European Union.

Open Access This chapter is licensed under the terms of the Creative Commons Attribution 4.0 International License (http://creativecommons.org/licenses/by/4.0/), which permits use, sharing, adaptation, distribution and reproduction in any medium or format, as long as you give appropriate credit to the original author(s) and the source, provide a link to the Creative Commons license and indicate if changes were made.
The images or other third party material in this chapter are included in the chapter's Creative Commons license, unless indicated otherwise in a credit line to the material. If material is not included in the chapter's Creative Commons license and your intended use is not permitted by statutory regulation or exceeds the permitted use, you will need to obtain permission directly from the copyright holder.