You can't depend on your eyes when your imagination is out of focus.
—Mark Twain
We have evolved to be pattern-seeking animals. As we noted earlier, we come from ancestors who were constantly on the lookout for the causes of things. Of course, searching for relationships in the world is often beneficial because it can lead to new knowledge. Our built-in tendency to seek out causes is so great, however, that we start to see associations when none exist. We can thus come to believe that two things are related when, in fact, they are not. This especially occurs when we want or expect to see an association. Let's look at two cases where very intelligent people are making major financial and health decisions on the basis of erroneous associations.
CHARTING THE WATERS
Your stockbroker calls and exclaims, “I'm glad I caught you—it's time to jump in and buy stock in Natural Water Inc.!” When you ask why, he says, “I've just analyzed the company's past stock prices, and it's a classic case. I've seen this pattern a thousand times before. When a stock acts like this, it's ready to take off. Do yourself a favor and buy now!” After hearing such news, many of us would dig out our checkbook and throw our hard earned money into Natural Water's stock. But is it the right thing to do?
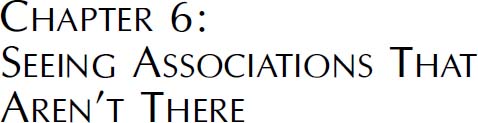
Stockbrokers who analyze changes in a company's stock price are using a technique known as a technical analysis. Technical analysts (also called chartists) believe they can see patterns in stock price charts that allow them to predict whether a stock will increase or decrease in the future. A chartist doesn't even care what type of business a firm is in—they could be selling computers or Barbie dolls. The trends detected in past stock prices are much more important for the technical analyst. You may have seen stock charts, like the one presented in figure 7. They are printed in financial newsletters, shown on news programs like CNBC, and are part of countless Internet financial sites. In fact, companies that create these charts have recently experienced a boom in sales.1
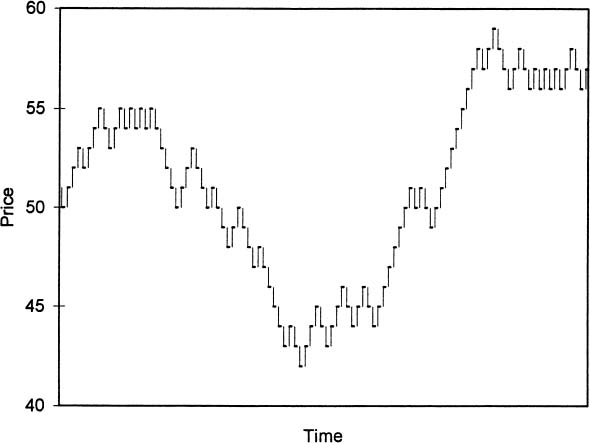
Figure 7. An example of a stock price chart showing the daily price changes for a hypothetical company.
Most investment houses employ technical analysts, who are well paid for their services. These analysts look for patterns like the “head and shoulders” formulation shown in figure 8.
With this chart, the price first rises, then falls a bit. Next, it goes up and down again, but slightly higher this time, forming a head. It then rises and falls somewhat, forming the shape of a shoulder on the right side. Chartists believe that if the price drops below the “neckline” it's a sure sign to sell. How do they know? They've seen the pattern many times before, and it usually results in a big price drop.
Chartists also use filter systems. For example, if they see a low point in a stock price, followed by a 5 percent (or some other percent) upswing, they think it's an upward trend. If the price peaks and then drops by 5 percent, it's a downward trend. A typical chartist rule goes something like, buy a stock that moves up by 5 percent from a low, and hold it until the price goes down 5 percent from a subsequent high.2 In fact, this technique is the foundation of stop-loss orders that many brokers recommend, where the client is advised to sell if the stock drops by some percent below the purchase price.
Figure 8. An example of a “head and shoulders” stock price chart. If the stock price drops below the “neckline,” chartists believe the price will continue to fall.
So, does charting work? Very intelligent people see patterns in past prices that they believe are associated with future price increases or decreases. However, those associations don't exist. Look again at figure 7. It seems like there are trends in the stock's price movements, doesn't it? The price starts at $50 a share, rises a bit, levels off, and then experiences a sharp drop to around $42. The stock price then has a period of rapid and consistent growth to around $59, drops a bit, and then appears to level off. With such trends, it seems like the stock's price changes are somewhat predictable. But the fact is, this chart was generated by a random process! Starting at $50, I used a random number generator, which was essentially like flipping a coin, to determine if this hypothetical stock was going to rise by a dollar or fall by a dollar each day. Chartists see all kinds of patterns in such random processes. In fact, Professor Burton Malkiel of Princeton University had his students create similar charts by flipping a coin. One chart showed an upward breakout from an inverted head-and-shoulders formulation, which a chartist would interpret as very bullish. Malkiel showed the chart to one of his analyst friends who almost jumped out of his skin, exclaiming, “What is this company? We've got to buy immediately. This pattern's a classic. There's no question the stock will be up 15 points next week.”3
Charting has been shown to be useless. A wealth of research, from as far back as the 1960s, demonstrates that technical analysis can't beat the market. The filter systems used by chartists have been tested, and, when trading costs are considered, they don't consistently beat a strategy of just buying and holding on to a stock. In fact, two financial economists, Arnold Moore and Eugene Fama, determined that only about 3 percent of the variation in daily stock prices can be explained by past stock prices, so past prices are quite useless in predicting future prices.4 And yet, technical analysts on Wall Street continue to see relationships between past and future stock prices when no relationship exists. And people continue to invest millions of dollars on the basis of the analysts' unfounded stock recommendations. In fact, chartists have recently been hired in increasing numbers. Why? Technical analysts recommend a lot of trades. As Malkiel notes, “Trading generates commissions, and commissions are the lifeblood of the brokerage business. The technicians do not help produce yachts for the customers, but they do help generate the trading that provides yachts for the brokers.”5
IT'S A HORSE—NO, IT'S A BAT
Take a look at figure 9. Do you see a dinosaur, a bird, a laughing face, a person flying?
The picture is a computer-generated image made to resemble an inkblot. Many clinical psychologists and psychiatrists use the Rorschach inkblot test, which consists of ten similar kinds of images, to diagnose whether a patient has certain disorders or tendencies, such as paranoia or suicidal tendencies. How do they do it? Patients state what they see in the images, and the psychologist interprets their responses as indicating certain deep-seated, unconscious thoughts that suggest some type of illness or social tendency.6

Figure 9. A computer-generated example of an inkblot. Clinicians have patients describe what they see in similar types of images in order to diagnose various psychological disorders or tendencies.
What did you see in the figure? If you saw something like buttocks, female clothing, or a person of indeterminant sex (e.g., looks like a man below the waist but a woman above), a clinical psychologist is likely to interpret your response as indicating you're homosexual (as Jerry Seinfeld would say, “Not that there's anything wrong with that”). In fact, psychologists Loren and Jean Chapman asked thirty-two clinicians about using the Rorschach test to determine male homosexuality (at a time when homosexuality was thought to be a disorder).7 The clinicians said that homosexuals were more likely to interpret the inkblots as buttocks, genitals, female clothing, human figures of indeterminate sex, and human figures with both male and female features.
So what's the problem? None of these responses are actually associated with homosexuality. Research has shown that just as many heterosexuals give these responses as homosexuals. And yet, the clinicians were convinced that they had discovered an association between these responses and homosexuality. Why the error? It just seems reasonable to assume that homosexuals would see such images—but that assumption is wrong. The clinicians' expectations of what they thought should correlate with homosexuality led them to perceive associations that weren't actually there.
To investigate these expectations further, Chapman and Chapman gave undergraduate students thirty cards.8 Each card had an inkblot, what one patient said about the inkblot, and different emotional, personality, or sexual characteristics of the patient. The students were asked if homosexuals made any particular response more often than other responses. The naive undergraduates thought that the signs mentioned by the psychologists (i.e., feminine clothing, anus, confusion between the sexes, etc.) were stated more by homosexuals. However, the thirty cases were constructed to be random. There was no association whatsoever between the patients' responses and their sexual orientation as listed on the cards. Yet, the students saw associations, and they were the very same associations that experienced clinicians see. Thus, untrained students and clinical psychologists are falling into the same trap—they see associations because of their false expectations.
In another compelling experiment, the Chapmans gave students thirty cards that contained a patient's response to an inkblot along with his emotional problem or a statement indicating he was homosexual.9 Two responses (i.e., seeing a monster or a part human/part animal creature) were always given when the patient stated he was a homosexual (i.e., a perfect correlation). Despite the perfect correlation, the students failed to see the association. Only 17 percent thought these two signs occurred more frequently with homosexuality, while 50 percent thought that seeing things like buttocks, genitals, and female clothing occurred more frequently, even though they were listed at random so no association existed. These studies demonstrate that if we think two variables are related, we'll often see a connection, irrespective of the evidence. This is what is known as illusory correlation—we see associations that don't actually exist.10
Other responses from the Rorschach test reveal similar problems. If a patient gives a reflection response like “I see a cat looking into a mirror,” clinicians typically interpret it to mean the person is narcissistic, even though studies have shown that there's no association between narcissism and reflection responses. The bottom line is, the reliability and validity of the Rorschach test has not been supported by scientific research. Therapists are seeing associations between responses and illnesses or personality traits because they expect to see them, not because they exist.11 And yet, people are being treated every day for a variety of mental health issues by clinical psychologists and psychiatrists who use the Rorschach inkblots. Furthermore, psychologists use the test to help courts decide which parent should get custody of a child, whether prisoners should be granted parole, or what should be done about convicted murderers.12 Hundreds of thousands of crucial decisions are made each year based upon the unreliable Rorschach.
Similar problems exist with other widely used projective tests. For example, with the Draw-a-Person test, a clinician interprets the psychological meaning of a face drawn by a patient. Chapman and Chapman asked clinicians what types of characteristics certain patients might draw, and found that 91 percent of them thought a paranoid patient would draw atypical eyes. However, controlled studies show that there is no difference between the eyes drawn by paranoid patients and by normal subjects. The perceived correlation by clinicians is purely illusionary.13 And yet, clinicians continue to use the test, even though they know the results of such studies. As one clinician commented, “I know that paranoids don't seem to draw big eyes in the research labs, but they sure do in my office.”14 We can only imagine the number of inaccurate diagnoses made because of clinicians' misguided beliefs in their ability to accurately perceive associations.
Seeing associations that aren't there also occurs in business and government. Graphologists maintain that they can tell many different things about an individual's personality by analyzing handwriting samples. They don't analyze the content of the writing, they analyze how a person crosses her Ts or loops her Os. Empirical research has demonstrated that graphology is completely useless.15 For example, one study had an “expert” graphologist evaluate a number of handwriting samples, with some of the samples presented more than once. The graphologist gave very different analyses to the same handwriting samples. It's scary to think that about 85 percent of the largest corporations in Europe, and about three thousand corporations in the United States, have, in the past, employed graphology in their personnel selection.16 You may have been denied a job because of a graphologist's unfounded judgment.
CONSIDER THE NEGATIVES
We all know that sugar can make children hyperactive. Just give a child a few candy bars and he'll start running, jumping, yelling, and generally bouncing off the walls. We've all seen it happen. In fact, researchers observed a number of children, paying close attention to whether they were hyperactive or not. They also noted if the children recently ate candy. Their findings are described in table 4. That is, 250 children were hyperactive after eating candy, while 50 were not. For those children who weren't hyperactive, 50 ate candy, while 10 didn't. Given this information, is hyperactivity associated with eating candy? What information is needed to determine if hyperactivity and sugar consumption are related?
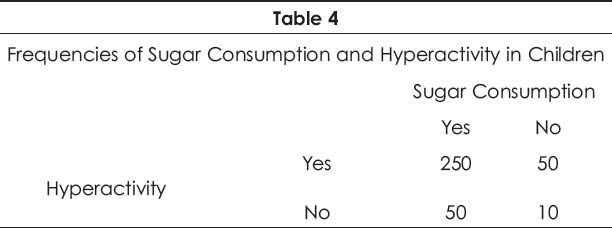
Many of us would say there's a positive association because the yes-yes cell is the largest. We focus on the 250 children that both ate candy and were hyperactive, and conclude there's a relationship because the number is considerably larger than the others. However, all the cells in the table are needed to determine if the two are related. We have to compare the ratio of hyperactivity to no hyperactivity when children eat sugar (250:50) and when they don't (50:10). There's a 5 to 1 ratio in both cases, so the children were 5 times more likely to be hyperactive whether they ate sugar or not. As a result, there's no association between hyperactivity and sugar consumption.
So why do we make the error? We don't attend to the negative cases in the table—the times when sugar consumption or hyperactivity is absent. Ignoring negative information is very common in our decision making, but when we do, we're likely to form erroneous beliefs. While this data was made up to demonstrate a point, research has shown that there is, in fact, no association between sugar consumption and hyperactivity. As another example, consider that many people believe that if a couple with fertility problems adopts a baby, they are more likely to conceive than a problem couple that doesn't adopt. The thinking is that their stress is alleviated, which makes it easier to conceive later on. However, clinical studies show it's not true. Why do we believe it? Our attention is drawn to the couples that conceive after adopting, and not to all those couples who adopt and don't conceive, or who conceive without adopting.17 To see if a relationship exists, we have to consider all the information—the positives and the negatives.
Medical professionals are not immune to this decision error. One study had nurses review 100 cases where hypothetical patient records indicated that a symptom and a disease was either present, or not present, in a patient.18 Like the data in table 4, there was no association between the symptom and the disease, but 86 percent of the nurses thought a relationship existed.
Erroneous connections are made for all types of beliefs. Politicians like us to believe that welfare has to be eliminated because it breeds fraud. As support, they point to the number of fraud cases involving people on welfare. But do people on welfare commit more fraud than people not on welfare? We would need to know before we accept their argument.19 In a similar vein, many people believe that God answers prayers because they remember the times they prayed and the event prayed for occurred. But how many times did someone pray and the event didn't occur? We typically ignore those cases. And so, when deciding if two things are related, we should think about table 4 and realize that we need to focus on more information than we normally do.
BUT IS IT THE CAUSE?
Let's assume for the moment that there is, in fact, an association between two variables. What's the best way to measure the degree of association? Statisticians have developed a measure of association called a correlation coefficient, and it ranges from -1 to +1. The closer the coefficient is to +1, the more two variables are related (i.e., if one variable goes up the other variable goes up). If the number approaches -1, the variables are inversely related (as one goes up the other goes down), while a zero means there's no association.20 Once again, statistics based on empirical data provide our best means to determine if two variables are related—but a few things must be kept in mind when interpreting a correlation.
Correlation Is Not Causation
Many people think that if two variables are correlated, then one variable causes the other. However, correlation does not imply causation. Just because a correlation exists between the amount spent on advertising and the sales generated by a given company, that doesn't mean the ads caused the sales. It could be that improved product quality generated more sales, and the advertising campaign happened to coincide with the improved product. In addition, causation does not necessarily imply a strong correlation. Intercourse causes pregnancy, but not all the time. However, our inherent tendency to look for causes leads us to draw causal inferences from correlations—a temptation we have to strongly resist.21
Directionality
In the 1990s researchers noticed a small correlation between student self-esteem—meaning their confidence and self-respect—and school achievement. Many people immediately assumed that one caused the other, and that the causal direction was obvious. Low self-esteem was thought to result in a plethora of problems, including poor school achievement, drug abuse, and teenage pregnancy. This belief led many educational programs to focus their attention on improving student self-esteem. However, if there is a causal association between self-esteem and school achievement, the causal link is just as likely to be in the opposite direction—superior school performance may generate high self-esteem.22 And so, even if a correlation exists because one variable causes the other, we don't really know if A causes B, or if B causes A.
A Third Variable
Correlations are sometimes spurious. That is, two variables may be related to one another not because there's a direct causal link, but because both variables are related to another, third variable. Studies indicate, for example, that student performance is associated with attending private or public schools. As a result, some people have concluded that private schools are better than public schools. We often hear from public officials and other special-interest groups that we should privatize the educational process or, at the very least, subsidize private schools because they're doing a better job of educating our youth. This argument has led politicians to advocate school vouchers and faith-based initiatives that give more money to private schools. However, support for the superiority of private schools comes from studies that simply correlate student performance and type of school attended. It could be that student performance depends on a number of variables that may be correlated with the type of school attended, such as the education and occupation of the students' parents, their socioeconomic status, the quantity of books in their home, etc.23
How do we know if a student's achievement is due to the type of school or to some other variable? With more advanced statistical procedures we can recalculate the correlation of two variables after we account for the influence of other variables.24 It turns out that when variables like a student's general mental ability and home background are removed, studies find virtually no association between student performance and the type of school attended.25 And so, the use of more advanced statistics allow us to make better-informed decisions on important social policy issues. Keep in mind, however, these more advanced procedures still can't tell us if there's a direct causal link between two variables—they can only improve our understanding of the associations that exist.
Selection Bias
Your local community is deciding whether to increase the funding for its school system. As expected, the debate on whether additional spending will result in better student performance heats up. Some people point to evidence indicating that teacher salary and class size are related to educational quality.26 Other people, however, with a different agenda point to studies that say there's little or no relationship between educational expenditures and students' performance on the scholastic aptitude test (SAT), a general achievement measure. So what should we believe? Does more money lead to better student performance or not? To make a more informed decision, we have to determine if there's a selection bias in the data analyzed. That is, we need to determine if the correlations are based on all the relevant data that should be considered, or if they are calculated on only a small sample of the data, specifically selected to bolster one's argument.27
Those who are against spending argue that when studies analyze data across the fifty states, there is little or no relation between spending and performance. In fact, they point out that if a study finds an association, it's often in the opposite direction, suggesting that higher spending actually leads to lower performance. What evidence do they have for this conclusion? A number of states with high teacher salaries actually have low average SAT scores, while other states with low salaries have high SATs. For example, students in Mississippi have higher SAT scores than students in California (by over one hundred points, on average). Given that Mississippi pays its teachers the lowest salaries in the nation, it seems pretty compelling that spending more will not increase student performance. In fact, some may argue that we should even cut teacher salaries!
But are schools really better in Mississippi than in California? Other measures show that California schools are superior, so why do we have lower SAT scores in California?28 The answer is that the SAT is not taken by every high school student. Some state university systems do not require the SAT, they use the American College Testing (ACT) program. Thus, only students who plan on attending college out-of-state take the SATs, and those students are likely to have higher academic achievement than the average student in the state. In addition, states with better educational systems typically have more students who want to go to college, so a greater proportion of students take the SAT, resulting in more students with average abilities sitting for the exam. In fact, a close examination reveals that only about 4 percent of high school students in Mississippi take the SAT, while 47 percent of students in California take the test.29 And so, there is selection bias in the data analyzed. The 4 percent from Mississippi represent the cream of the crop, and comparing those students to a much larger proportion of students from California is like comparing apples and oranges.
The bottom line is, if we don't critically analyze the data used to calculate a correlation, we can be misled into believing something that's not actually the case. This is especially true if we have a preconceived personal or political bias. For example, one conservative commentator fell into this trap when he argued against expenditures on education, citing the research indicating that greater spending does not lead to higher SAT scores. However, the states that he pointed to as having high scores—Iowa, North Dakota, South Dakota, Utah, and Minnesota—had SAT participation rates of only 5 percent, 6 percent, 7 percent, 4 percent, and 10 percent, respectively. These numbers are quite low given that about 40 percent of all high school seniors take the SAT in the United States. He used New Jersey as an example of low SAT scores and high educational expenditures, but 76 percent of high school seniors take the SAT in New Jersey.30
So what is the relation between spending and academic achievement? It turns out that when the proportion of students taking the test is considered in the analysis, states that spend more on education actually have higher scores. It's estimated that spending an additional $1,000 per pupil would yield a fifteen point increase in the average SAT score for a state.31
SUMMING UP
We make erroneous associations all the time, and those associations can be quite costly, both financially and in terms of our health. Sometimes we see nonexistent associations because we want or expect to see the association. As we saw earlier, our desires and expectations are extremely powerful forces in our perception and evaluation of the world. It turns out, however, that we don't even need a desire or expectation—we can erroneously conclude that two things are related because we just don't analyze the information we see as rigorously as we should. That is, we usually just look for instances when two things happen, and if we find a number of these cases, we quickly conclude they are related. As we saw in table 4, however, we also need to consider the negatives—pay attention to those times when a thing didn't happen. If we don't, we'll forever see associations that don't exist.
Even if we find that two things are empirically associated with one another, we still have to critically evaluate how the statistics demonstrating their association are calculated. Politicians and special interest groups are constantly attempting to convince us that their position on an issue is right, and they often use statistics, like correlations, to support their point of view. We can easily be fooled into believing something that's not true if we don't understand how those statistics are calculated. As Mark Twain said, “There are three kinds of lies—lies, damn lies and statistics.” Statistics typically provide us with the best information we can get to make informed decisions, but we have to know how the statistics were calculated and what they really mean. The moral of the story—look closely at the data before you choose to believe.