
Another classic GMAT setup involves a large group that is subdivided into two potentially overlapping subgroups. For example, let’s say that in a room of 20 people, there are 12 dog owners and 14 cat owners. Since 12 plus 14 is more than 20, the only way this situation makes any sense is if some people own both a dog and a cat. And it’s possible that some own neither. Essentially, there are four different subgroups to consider: (1) those who own a dog but not a cat, (2) those who own a cat but not a dog, (3) those who own both a cat and a dog, and (4) those who own neither a cat nor a dog. You could also combine some of these groups to consider both the total number of dog owners and the total number of cat owners.
There are three ways to work these problems. Let’s look at each.
Use the overlapping sets formula:
Group 1 + Group 2 − Both + Neither = Total
Example: An office manager orders 27 pizzas for a party. Of these, 15 have pepperoni, and 10 have mushrooms. If 4 pizzas have no toppings at all, and no other toppings are ordered, then how many pizzas were ordered with both pepperoni and mushrooms?
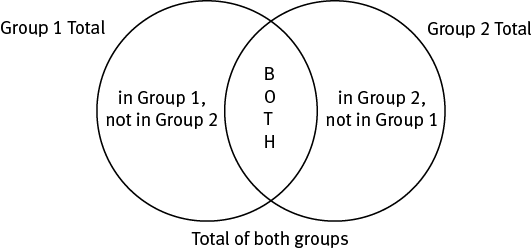
Organize the given information using a Venn diagram. This approach uses partially overlapping circles to represent the data visually:
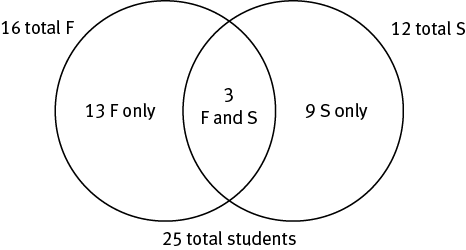
Example: All the students in a class study either Forensics or Statistics. There are 16 Forensics students, 3 of whom also study Statistics. How many Statistics students are in the class if the class has 25 students altogether?
Because 3 of the Forensics students also study Statistics, there must be 13 who study only Forensics. If the “Forensics only” and “Both” groups total 16 and there are 25 students in the class, then 25 − 16, or 9, students study only Statistics. Thus, 9 + 3 = 12, the total number of Statistics students. Putting all these numbers into the Venn diagram as you go helps you to see these relationships clearly:
Organize the given information using a chart. This way works best with complicated overlapping sets problems because it has a separate place for each of the nine data points you might be given. Take your time organizing the chart, and the problem will almost solve itself:
|
|
In Group 1 |
Not in Group 1 |
Total |
|
In Group 2 |
|
|
|
|
Not in Group 2 |
|
|
|
|
Total |
|
|
|
Example: A company has 200 employees, 90 of whom belong to a union. If there are 95 part-time nonunion employees and 80 full-time union employees, then how many full-time employees are in the company?
Start by putting the data into the chart, using a question mark to indicate the value that the question asks for:
|
|
In union |
Not in union |
Total |
|
Full-time |
80 |
|
? |
|
Part-time |
|
95 |
|
|
Total |
90 |
|
200 |
Now you can calculate the total number of nonunion employees (200 − 90 = 110) and the number of part-time union employees (90 − 80 = 10):
|
|
In union |
Not in union |
Total |
|
Full-time |
80 |
|
? |
|
Part-time |
10 |
95 |
|
|
Total |
90 |
110 |
200 |
And now either calculate full-time nonunion employees (110 − 95 = 15) or the total number of part-time employees (10 + 95 = 105):
|
|
In union |
Not in union |
Total |
|
Full-time |
80 |
15 |
? |
|
Part-time |
10 |
95 |
105 |
|
Total |
90 |
110 |
200 |
Either way, you can then calculate the total number of full-time employees (80 + 15 = 95 or 200 − 105 = 95):
|
|
In union |
Not in union |
Total |
|
Full-time |
80 |
15 |
95 |
|
Part-time |
10 |
95 |
105 |
|
Total |
90 |
110 |
200 |
There are 95 full-time employees.
Each of the three approaches has its pluses and minuses. Your own personal thinking style will respond best to one of these over the others. Practice all of them so you get a sense of which approach you like with different problems.
Now try the following example on your own, using Critical Thinking to assess which of the three approaches will be most effective:
A group of 25 children went to the circus, 60 percent of whom liked the clowns. If the number of preschool children who liked the clowns was 3 more than the number of preschool children who did not, and the number of preschool children was 1 larger than the number of school-age children, then how many school-age children did not like the clowns?
In your overview of the problem, you can see that there are some complex relationships going on; you shouldn’t try to understand them all at once. But notice that there are two ways in which children can be classified: preschool or school-age, liked or didn’t like the clowns. That makes this an overlapping sets problem.
The approach that offers the most flexibility, shows the most detail, and is therefore frequently the safest to use with this question type is this chart:
|
|
In Group 1 |
Not in Group 1 |
Total |
|
In Group 2 |
|
|
|
|
Not in Group 2 |
|
|
|
|
Total |
|
|
|
In this problem, the two groupings are preschool or school-age and likes clowns or doesn’t like clowns. So here’s the chart you’d use for this problem:
|
|
Likes clowns |
Doesn’t like |
Total |
|
Preschool |
|
|
|
|
School-age |
|
|
|
|
Total |
|
|
|
Now enter the information from the question stem:
|
|
Likes clowns |
Doesn’t like |
Total |
|
Preschool |
x + 3 |
x |
s + 1 |
|
School-age |
|
? |
s |
|
Total |
60% of 25 |
|
25 |
Two calculations can be done right away: 60% of 25 = (0.6)(25) = 15. Also, (s + 1) + s = 25. That means 2s + 1 = 25, so 2s = 24 and s = 12.
|
|
Likes clowns |
Doesn’t like |
Total |
|
Preschool |
x + 3 |
x |
13 |
|
School-age |
|
? |
12 |
|
Total |
15 |
|
25 |
The next two calculations suggested by the chart are the total number of children who don’t like clowns, 25 − 15 = 10, and the value of x. Use the equation (x + 3) + x = 13, or 2x + 3 = 13. That means 2x = 10, or x = 5. Then x + 3 = 8.
|
|
Likes clowns |
Doesn’t like |
Total |
|
Preschool |
8 |
5 |
13 |
|
School-age |
|
? |
12 |
|
Total |
15 |
10 |
25 |
Now you know the answer to the question . . . the number of school-age children who didn’t like the clowns is 10 − 5, or 5. You can fill in the number of school-age children who like clowns, too, just for fun.
|
|
Likes clowns |
Doesn’t like |
Total |
|
Preschool |
8 |
5 |
13 |
|
School-age |
7 |
5 |
12 |
|
Total |
15 |
10 |
25 |
Because this chart shows all nine possible data points in these problems, it allows
you to answer any question that might be asked. Fraction of school-age kids who liked the clowns?
It’s
 . Percentage of children who didn’t like the clowns who were also preschoolers? It’s 50%. Ratio
of school-age children who liked the clowns to preschoolers who didn’t? It’s 7:5.
. Percentage of children who didn’t like the clowns who were also preschoolers? It’s 50%. Ratio
of school-age children who liked the clowns to preschoolers who didn’t? It’s 7:5.
When overlapping sets questions involve proportions, be very clear about what the basis of the proportion is. For example, the number of preschoolers who didn’t like the clowns could be described as 20% (of the children), 50% (of the children who didn’t like clowns), or 100% (as large as the number of school-age children who didn’t like the clowns).
Now let’s use the Kaplan Method on a Problem Solving question dealing with overlapping sets:
You’re presented with a lot of information in this overlapping sets question. Don’t try to digest it all at once. Notice that the total group (registered voters) can be separated into two major categories (those who like Party A and those who like Party B) and that those categories are not mutually exclusive (which means that someone could be in both categories—in this case, that someone could like both parties). That’s the general setup for overlapping sets questions.
Use Critical Thinking to choose the best approach for this problem. This is a complicated question with many data points. The most powerful tool for understanding confusing or complicated overlapping sets is a chart:
|
|
Favorable B |
Not favorable B |
Total |
|
Favorable A |
? |
|
|
|
Not favorable A |
|
|
|
|
Total |
|
|
|
You need to calculate the percentage of registered voters who like both parties; in other words, the value in the upper left-hand box.
Start by putting the information into the chart. For simplicity’s sake, pick 100 for the total number of voters.
|
|
Favorable B |
Not favorable B |
Total |
|
Favorable A |
? |
20 |
|
|
Not favorable A |
|
35 |
|
|
Total |
|
|
100 |
The other piece of data is “1 registered voter has a favorable impression of both parties for every 2 registered voters who have a favorable impression only of Party B.” In other words, the ratio of “favorable A and favorable B” to “favorable B and not favorable A” is 1:2. So you have something else to put in the chart—let’s call that x and 2x.
|
|
Favorable B |
Not favorable B |
Total |
|
Favorable A |
x (?) |
20 |
|
|
Not favorable A |
2x |
35 |
|
|
Total |
|
|
100 |
Since this chart adds down (and across), you can fill in the rest easily enough:
|
|
Favorable B |
Not favorable B |
Total |
|
Favorable A |
x (?) |
20 |
20 + x |
|
Not favorable A |
2x |
35 |
35 + 2x |
|
Total |
3x |
55 |
100 |
Whether you use the Total column or the Total row, you have the same equation to solve for x:

The answer is (A).
Reread the question stem, making sure that you didn’t accidentally misread anything.