how many samples?
Choosing a statistical test |
CHAPTER 38 |
Having set out a battery of statistical tests in the preceding chapters, this chapter provides guidance to the researcher on which tests to use with particular kinds of data and for specific purposes, i.e. to address fitness for purpose. The chapter proceeds thus, indicating different considerations which researchers must bear in mind when selecting the most appropriate tests:
how many samples?
the types of data used
choosing the right statistic
assumptions of tests
The chapter provides several tables to guide the researcher in making choices here.
There are very many statistical tests available to the researcher. Which test one employs depends on several factors, for example:
the purpose of the analysis (e.g. to describe or explore data, to test a hypothesis, to seek correlations, to identify the effects of one or more independent variables on a dependent variable, to identify differences between two or more groups, to look for underlying groupings of data, to report effect sizes);
the kinds of data with which one is working (parametric and non-parametric);
the scales of data being used (nominal, ordinal, interval, ratio);
the number of groups in the sample;
the assumptions in the tests;
whether the samples are independent of each other or related to each other.
Researchers wishing to use statistics will need to ask questions such as:
What statistics do I need to answer my research questions?
Are the data parametric or non-parametric?
How many groups are there (e.g. two, three or more)?
Are the groups related or independent?
What kind of test do I need (e.g. a difference test, a correlation, factor analysis, regression)?
We have addressed several of these points in the preceding chapters; those not addressed in previous chapters are addressed here. In this chapter we draw together the threads of the discussion of statistical analysis and address what, for many researchers, can be a nightmare: deciding which statistical tests to use. In the interests of clarity we have decided to use tables and graphic means of presenting the issues in this chapter.
In addition to the scale of data being used (nominal, ordinal, interval, ratio), the kind of statistic that one calculates depends in part on first, whether the samples are related to, or independent of, each other; and second, the number of samples in the test. With regard to the first point, as we have seen in previous chapters, different statistics are sometimes used when groups are related to each other and when they are independent of each other. Groups will be independent when they have no relationship to each other, e.g. in conducting a test to see if there is any difference between the voting of males and females on a particular item, say mathematics performance. The tests that one could use here are, for example: the chi-square test (for nominal data), the Mann-Whitney U test and Kruskal-Wallis (for ordinal data), and the t-test and analysis of variance (ANOVA) for interval and ratio data.
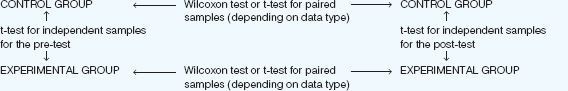
However, there are times when the groups might be related. For example we may wish to measure the performance of the same group at two points in time – before and after a particular intervention – or we may wish to measure the voting of the same group on two different factors, say preference for mathematics and preference for music. Here it is not different groups that are being involved, but the same group on two occasions and the same two on two variables respectively. In this case different statistics would have to be used, for example the Wilcoxon test, the Friedman test, the t-test for paired samples, and the sign test. Let us give a frequently used example of an experiment (Table 38.1).
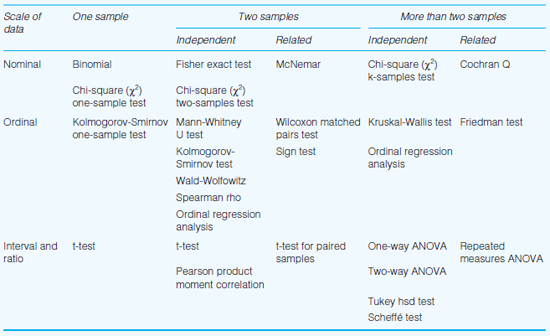
In preceding chapters we have indicated which tests are to be used with independent samples and which are to be used with related samples. With regard to the number of samples in the test, there are statistical tests which are for single samples (one group only, e.g. a single class in school), for two samples (two groups, e.g. males and females in a school) and for more than two samples, e.g. parents, teachers, students and administrative staff in a school. Tests which can be applied to a single group include the binomial test, the chi-square one-sample test and the Kolmogorov-Smirnov one-sample test; tests which can be applied to two groups include the chi-square test, Mann-Whitney U test, the t-test, the Spearman and Pearson tests of correlation; tests which can be applied to three or more samples include the chi-square test, analysis of variance and the Tukey test. We set out some of these tests in Table 38.2. It is essential to use the correct test for the correct number of groups.
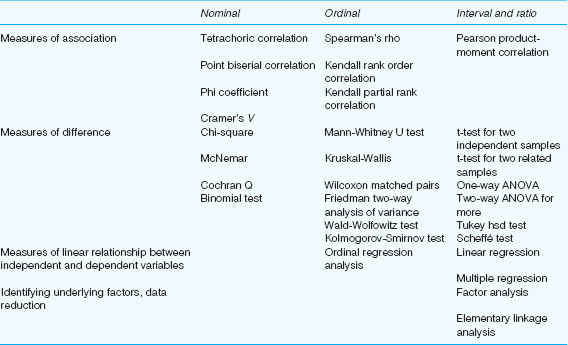
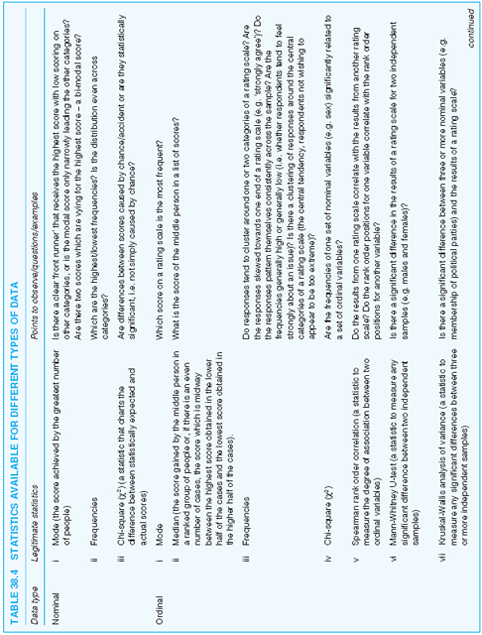
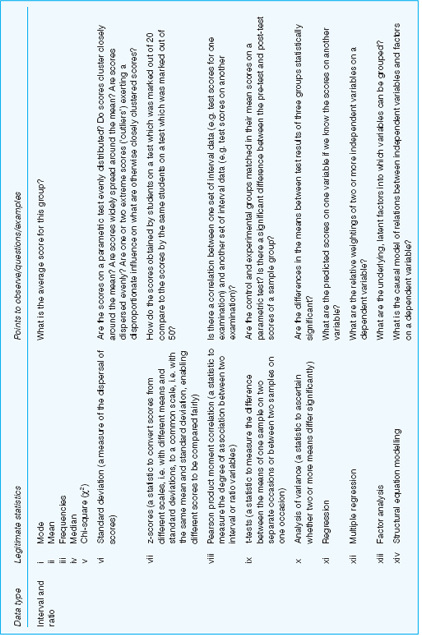
The statistical tests to be used also depend on the scales of data being treated (nominal – ratio) and the tasks which the researcher wishes to perform – the purpose of the analysis (e.g. to discover differences between groups, to look for degrees of association, to measure the effect of one or more independent variables on a dependent variable, etc.). In preceding chapters we have described the different scales of data and the kinds of tests available for different purposes. In respect of these considerations, Table 38.3 summarizes some of the main tests here.
The type of tests used also varies according to whether one is working with parametric or non-parametric data.
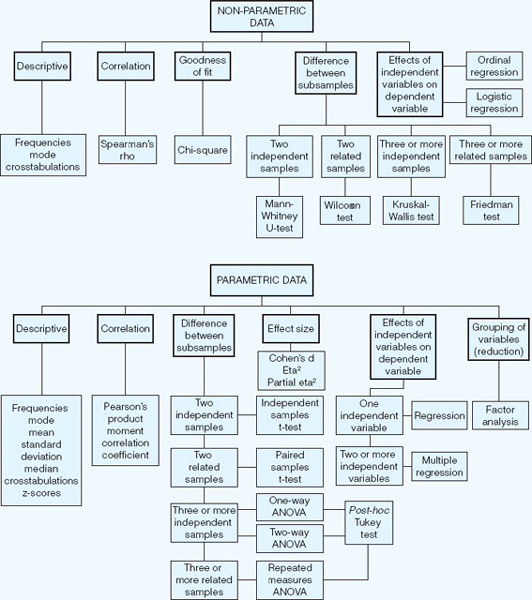
Figure 38.1 and Table 38.4 draw together and present the kinds of statistical tests available, depending on whether one is using parametric and non-parametric data, together with the purpose of the analysis. Table 38.4 sets out the commonly used statistics for data types and purposes (Siegel, 1956; Cohen and Holliday, 1996; Hopkins et al, 1996).
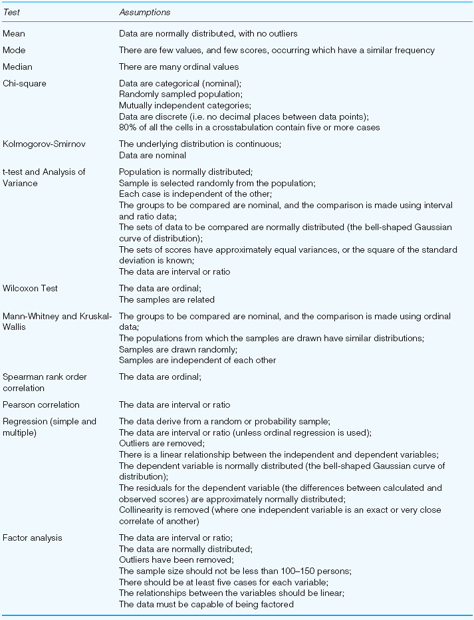
Statistical tests are based on certain assumptions. It is important to be aware of these assumptions and to operate fairly within them. Some of the more widely used tests have assumptions as illustrated in Table 38.5.
The choice of which statistics to employ is not arbitrary, but dependent on purpose.
 Companion Website
The companion website to the book includes PowerPoint slides for this chapter, which list the structure of the chapter and then provide a summary of the key points in each of its sections. In addition there is further information in the form of a short quiz for asking which statistics should be used for certain research questions, and a table of statistics that are permissible for different kinds of data. These resources can be found online at www.routledge.com/textbooks/cohen7e.