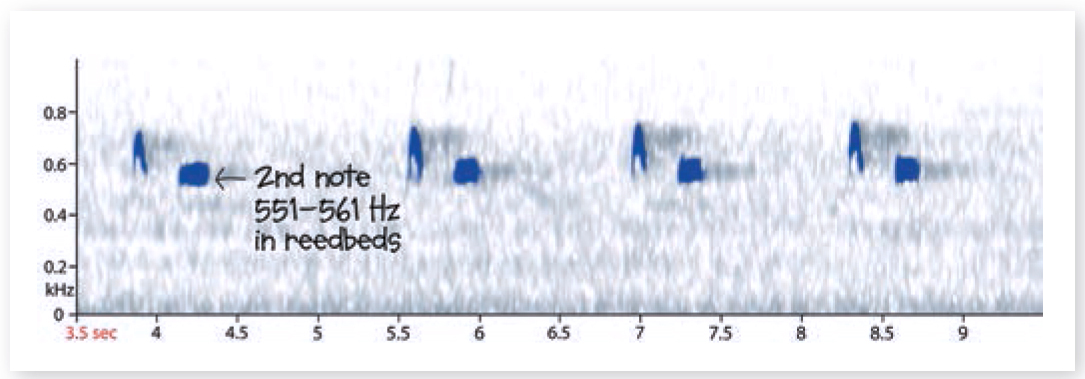
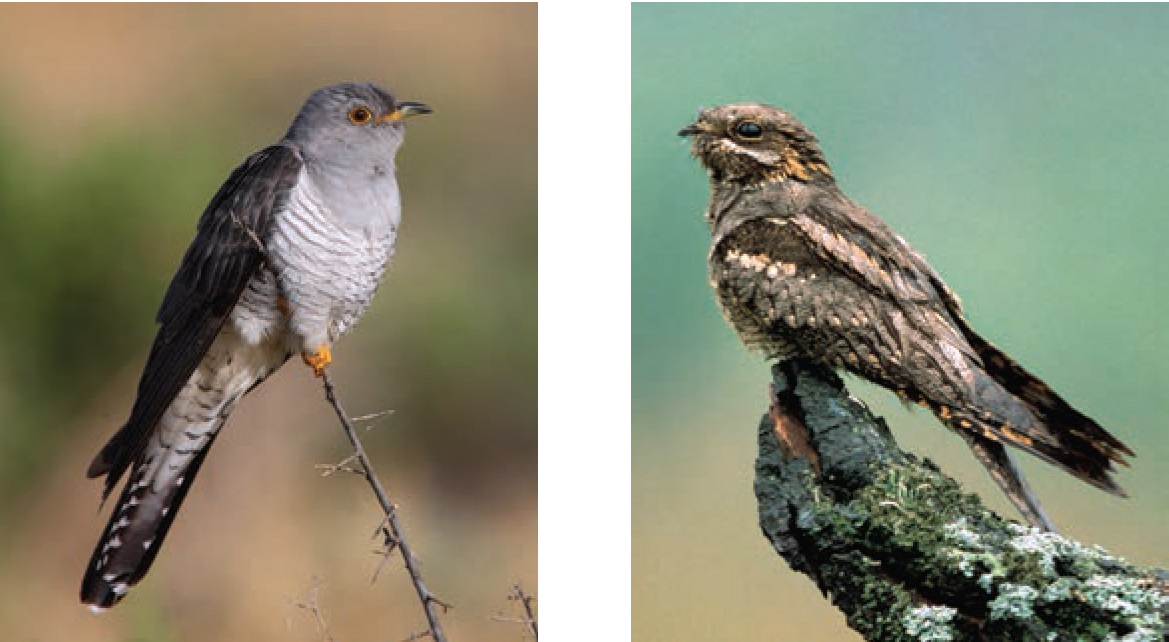
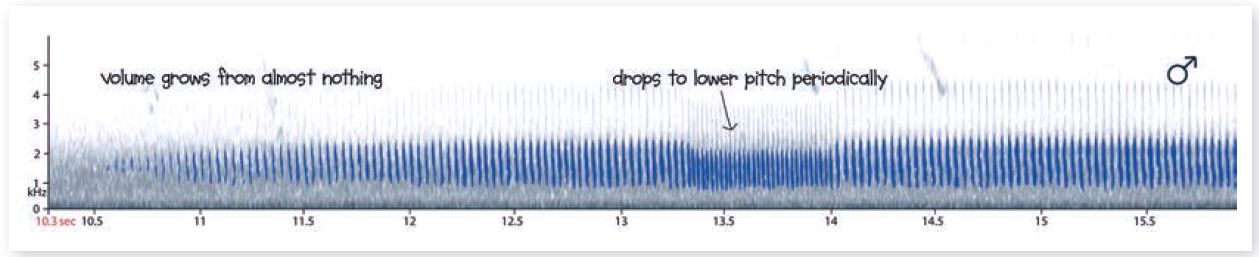
With experience, sonograms for Common Cuckoo (top, pictured left) and European Nightjar (above, pictured right) can actually be read in almost the same way as musical notation, as they show both pitch and timbre to a degree.
60 : Sonogram
1958
With experience, sonograms for Common Cuckoo (top, pictured left) and European Nightjar (above, pictured right) can actually be read in almost the same way as musical notation, as they show both pitch and timbre to a degree.
What birders know as a sonogram is more properly called a spectrogram, and is a visual representation of the full frequency spectrum of a particular sound or series of sounds – in this instance the songs and calls of birds.
Usually illustrated as a black-and-white, two-dimensional graph-like figure, visual renderings of a sound source can be remarkably informative once one is used to reading them while listening to the original source – almost like reading music – and can be a great aid when analysing and comparing avian vocalisations.
The visual study of sound in fact dates back to 1857, when Édouard-Léon Scott de Martinville invented the phonautograph, which was in fact the first device that could record sound waves. Built to solely enable the visual study of recorded sound, no playback was possible, but the sound waves were inscribed onto a rotating cylinder of soot-coated paper by a needle or stylus. The stylus traced a line through the soot which represented the motions of a diaphragm or membrane that physically responded to the sounds via a series of levers.
Sonograms tend to be graphically represented by axes, just like a histogram or graph: the x- or horizontal axis represents time, and the y- or vertical axis the frequency, usually measured in kilohertz (khz). Though often printed in monochrome, colour versions can also be produced and these are arguably richer in timbral information.
Bird sounds were first analysed in this way in an Ibis paper on the songs of two Chaffinch subspecies by W H Thorpe in 1958, entitled ‘The learning of song patterns by birds, with especial reference to the song of the Chaffinch Fringilla coelebs’. The format has become very prevalent in birding circles in the last decade, particularly so now that the idea that song or calls can reproductively isolate populations enough to create new species has taken hold in the birding consciousness.
However, in the rush to try and claim new species, it is sometimes forgotten that calls and songs can be merely dialects or local variations, that vocalisations are also ‘plastic’ and learnt, and that true reproductive isolation involves more than just geography and minor variations in mating sounds, but also subtly complex differences in behaviour and actual insurmountable physiological and morphological change.
The sonogram itself is, however, a valuable analytical tool for all students of bird vocalisations, amateur and professional, and relatively easy to understand for most birders once they take the plunge. Production and analysis is neither a specialist nor expensive business – several free downloadable programs, including Raven Lite from Cornell Laboratory of Ornithology, are now available for any birder with a computer to produce their own sonograms from their own recordings (or others), and there are even smartphone apps to perform similar tasks. The study and interpretation of bird sounds has been taken to extraordinary new levels by The Sound Approach, a pioneering group whose analysis of chosen subjects has, among other things, led to the ‘splitting’ of new storm-petrel species and the discovery in Oman of an owl new to science.