Hypothesis and Study Characteristics
The hypotheses examined for this meta-analysis were as follows:
- Employee perceptions of quality of management practices measured by the 13 Core items are related to business unit outcomes (i.e., units with higher scores on these items have, in general, more favorable business outcomes).
- The validity of employee perceptions of quality of management practices measured by the 13 Core items generalizes across the organizations studied.
A total of twenty-eight (28) studies are included in Gallup’s database — studies conducted as proprietary research for various organizations. In each study, one or more of the Core items were used, and data were aggregated at the business unit level and correlated with aggregate performance measures:
- customer satisfaction/loyalty
- profitability
- productivity
- turnover
That is, in these analyses the unit of analysis was the business unit, not the individual employee.
Pearson correlations were calculated, estimating the relationship of business unit average measures of employee perceptions to each of these four general business outcomes. Correlations were calculated across business units within each company, and these correlation coefficients were entered into a database for each of the 13 items. The researchers then calculated mean validities, standard deviations of validities, and validity generalization statistics for each item for each of the four business unit outcome measures.
Here is a summary of the studies composing this meta-analytic study.
- There were eighteen (18) studies that examined the relationship between business unit employee perceptions and customer perceptions. Customer perceptions included customer satisfaction scores, patient satisfaction scores, student ratings of teachers, and quality ratings by those posing as customers (mystery shoppers). Customer instruments varied from study to study. The general index of customer satisfaction/loyalty was an average score of the items included in each measure.
- Profitability measures were available for fourteen (14) studies. Definition of profitability typically was a percentage profit of revenue (sales). In several companies, the researchers used, as the best measure of profit, a difference score from the prior year or a difference from a budgeted amount, because it represented a more accurate measure of each unit’s relative performance. As such, a control for opportunity was used when profitability figures were deemed less comparable from one unit to the next. For example, a difference variable involved dividing profit by revenue for a business unit and then subtracting a budgeted percentage from this percentage. In every case, profitability variables were measures of margin, and productivity variables were measures of amount produced.
- Fifteen (15) studies included measures of productivity. Measures of business unit productivity consisted of either revenue figures, revenue-per-person figures, revenue per patient, or a managerial evaluation which was based on all available productivity measures and management judgment as to which business units were most productive. In many cases, this was a dichotomous variable (top performing business units = 2, less successful units = 1).
- Turnover data were available for fifteen (15) studies. These studies consisted of the annualized percentage of employee turnover for each business unit.
The overall study involved 105,680 individual employee responses to surveys and 2,528 business units, an average of 42 employees per business unit and 90 business units per company.
Here is a summary of studies (per company) sorted by industry and type of business unit.
- Twenty-eight percent of all business units in this meta-analysis were from financial organizations, 21 percent were from healthcare business units, and 18 percent were from restaurants. The remaining industries included in the meta-analysis were entertainment, grocery, research, telecommunications/publishing, medical sales, electronics, hospitality, government, and education.
- Thirty-one percent of all business units were retail operations and 28 percent were financial organizations; 21 percent were healthcare units, 9 percent were education units, and 11 percent were other businesses.
There is considerable variation among companies in the extent to which employee perception data and business performance data can be aggregated at enough levels to provide comparable analyses. Retail businesses and financial organizations provide numerous opportunities for this type of analysis, as they typically include a large number of business units that use similar measures.
Meta-analytic Methods Used
Analyses included weighted average estimates of true validity, estimates of standard deviation of validities, and corrections made for sampling error and measurement error in the dependent variables for these validities. The most basic form of meta-analysis corrects variance estimates only for sampling error. Other corrections recommended by Hunter and Schmidt (1990) include correction for measurement artifacts, such as range restriction and measurement error in the performance variables gathered. The definitions of the above procedures are provided in the sections that follow.
For this study, the researchers gathered performance variable data for multiple time periods to calculate the reliabilities of the business performance measures. Since these multiple measures were not available for each study, the researchers utilized artifact distributions meta-analysis methods (Hunter & Schmidt, 1990, pp. 158-197) to correct for measurement error in the performance variables. The artifact distributions developed were based on annual test-retest reliabilities, where they were available, from various studies.
At the time of the study there were no population estimates of standard deviations of items for each of the scale types used. Therefore, no corrections for range restriction were made. Similarly, no corrections were made for measurement error in independent measures (the 13 Core items). To adequately correct for item-level independent variable measurement error, test-retest reliabilities (with a short time interval) would be necessary. Such estimates were unavailable at the time of this study. For composite dimensions (provided later in the report), true score correlation estimates were calculated by using Cronbach’s alpha estimates for independent variable reliability values.
As noted, no corrections were made in the item validities or variances due to measurement error in the independent variables and for range restriction. The following item analyses should therefore be considered conservative estimates, and estimates of true variance should be considered as slightly larger than actual true variance.
In any given meta-analysis there may be several artifacts for which artifact information is only sporadically available. For example, suppose measurement error and range restriction are the only relevant artifacts beyond sampling error. In such a case, the typical artifact distribution-based meta-analysis is conducted in three stages:
- First, information is compiled on four distributions: the distribution of the observed correlations, the distribution of the reliability of the independent variable, the distribution of the reliability of the dependent variable, and the distribution of the range departure. There are then four means and four variances compiled from the set of studies, with each study providing whatever information it contains.
- Second, the distribution of correlations is corrected for sampling error.
- Third, the distribution corrected for sampling error is then corrected for error of measurement and range variation (Hunter & Schmidt, 1990, pp. 158-159).
In this study, corrections for measurement error in the dependent variable were made in all analyses. The meta-analysis for each item and each performance variable includes an estimate of the mean sample size weighted validity and the variance across the correlations — again weighting each validity by its sample size. The amount of variance predicted for weighted correlations on the basis of sampling error was also computed. The following is the formula to calculate variance expected from sampling error in “Bare Bones” meta-analyses, utilizing the Hunter/Schmidt technique referred to in the previous paragraph:
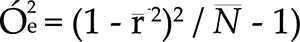
True score standard deviations were calculated by subtracting the amount of variance due to sampling error and the amount of variance due to measurement error in the dependent variable from the observed variance. Taking the square root of this figure, a correction for the attenuation effect in the dependent variable was then made. The amount of variance due to sampling error and measurement error was divided by the observed variance to calculate the total percent variance accounted for. One rule of thumb adopted from the literature is that, if over 75 percent of variance in validities across studies is due to sampling error and other artifacts, the validity is assumed generalizable. Since two measurement error artifacts could not be corrected for in this study, the researchers chose to use a figure of 70 percent or more in determining whether validities generalized across organizations.
Results
Below is a summary of the meta-analysis for each of the 13 Core items with regard to customer satisfaction/loyalty criteria. Statistics included the number of business units contained in the analysis, the number of correlations, the weighted mean observed correlation, the observed standard deviation, the true validity standard deviation (subtracting out variance due to sampling error and measurement error in the performance variables), the percent variance due to sampling error, the percent variance accounted for, and the 90 percent credibility value (the point above which 90 percent of the true validities fall).
Results indicate that, across all 13 items, true validity estimates are in the positive direction. Validity estimates range from a low of .057 to a high of .191. If an item had a positive 90 percent credibility value, it was considered generalizable in the sense that we are confident the true validity is positive (in the hypothesized direction). Items in which over 70 percent of the variance in validities was accounted for were considered generalizable in the sense that the validity did not vary across studies. Eleven (11) of the 13 items had positive 90 percent credibility values, and six (6) did not vary across studies.
Interestingly, for item number 12 (“In the last six months, someone at work has talked to me about my progress”), the calculations indicate 148 percent of the variance in validities across studies is due to sampling error. The interpretation of this is: By chance there was less variability across studies in this data set in the observed correlations than predicted from random sampling error, based on the number of business units in each study, and dependent variable measurement error. Two other items also had over 100 percent of variance accounted for due to sampling error alone. The practical significance of the size of correlations depicted here will be discussed following the results section. For item validities that did not appear to generalize across companies, it is possible that there are other variables moderating the strength of the relationship of these employee perceptions to customer satisfaction. For instance, perhaps the moderator for “opinions count” is the extent to which the manager not only listens to the employees’ opinions, but also uses them to affect the customer. Items with highest true validities that appear to generalize across companies include:
- I have a best friend at work.
- At work, I have the opportunity to do what I do best every day.
- I know what is expected of me at work.
- My supervisor, or someone at work, seems to care about me as a person.
When multiple generalizability estimates are derived, second order sampling error can slightly influence results. To compute the mean percent variance accounted for, the following formula was used:
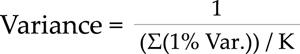
On average, 66.96 percent of variance was accounted for across item validities to customer satisfaction criteria. While the mean true validity is clearly positive, the strength of the relationship may be moderated slightly by one or more other variables. It is important to remind the reader that these estimates have not yet been corrected for other artifacts, such as measurement error in the independent variable and range restriction. Once they have been corrected for other artifacts, it is likely that there will be little room left for detecting substantial moderating relationships.
Here is the same summary analysis for items with regard to their relationship to profitability criteria. Ten (10) of the 13 items have positive 90 percent credibility values, and it is possible to account for over 70 percent of the variance in validities for nine items. The mean percent variance accounted for across items is 69.21 percent. Again, there is some room (although little) for possible moderating relationships. Those that may not generalize include “talked about progress,” “mission,” “materials and equipment,” and “best friend.” Approximately half of the variance in validities for these items is explained by sampling error and measurement error in the dependent variable. Items that appear to generalize across companies and that tended to have the highest validities to the profitability criteria are:
- Overall Satisfaction
- My associates (fellow employees) are committed to doing quality work.
- At work, I have the opportunity to do what I do best every day.
- My supervisor, or someone at work, seems to care about me as a person.
Here is a summary of the meta-analytic and validity generalization statistics for the 13 Core items relative to productivity criteria. Again, the relationships were positive. All 90 percent credibility values were positive, and we were able to account for over 70 percent of the variance in validities for 11 items. The mean percent variance accounted for across items is 83.72 percent, suggesting very little room for possible moderators. There was variation, however, in the magnitude of true validity estimates across items. Those with highest validity estimates to productivity criteria were:
- I know what is expected of me at work.
- At work, my opinions seem to count.
- The mission/purpose of my company makes me feel my job is important.
- Overall Satisfaction
- My associates (fellow employees) are committed to doing quality work.
Finally, here is a summary of the meta-analytic and validity generalization statistics for items as they relate to turnover. Four items had negative 90 percent credibility values and two were approximately zero. Therefore, for six items, we can be quite certain the direction of the relationship is negative (as hypothesized for turnover). We were able to account for over 70 percent of the variance in validities for ten items. The mean percent variance accounted for across items is 91.96 percent, again suggesting very little room for moderators. Interestingly, one of the highest true validity estimates was Item No. 3 (“I have the materials and equipment I need to do my work right”). Employee perceptions with regard to this item, as they relate to turnover, do not vary substantially across companies. Items with the highest negative correlations that appear to generalize across companies included:
- I have the materials and equipment I need to do my work right.
- Overall Satisfaction
- My supervisor, or someone at work, seems to care about me as a person.
Table 1 now provides a summary of all item statistics calculated for each of the four general performance criterion measures included in the study. This table presents the mean number of studies per variable, the mean number of business units across items, the mean observed correlation per item, and the mean true validity.
In general, items correlated at a similar magnitude with customer, profitability, and productivity criteria, and at a lower level with turnover.
|
TABLE 1 Summary of Item Statistics |
||||
|
Criterion Measure |
No. of Studies |
Mean No. of Bus. Units |
Mean Observ. r’s |
Mean True Validity r’s |
|
Customer |
18 |
2,170 |
.107 |
.122 |
|
Profitability |
14 |
1,490 |
.084 |
.133 |
|
Productivity |
15 |
1,148 |
.126 |
.128 |
|
Turnover |
15 |
1,552 |
-.023 |
-.045 |
Of the correlations included in these analyses, the average meta-analytic correlation was .107. The practical utility of the magnitude of these correlations is discussed later in Harter and Creglow, 1998.
Table 2 provides a summary of the items that had positive 90 percent credibility values (zero or negative for the turnover measure) and in which over 70 percent of the variance in validities was accounted for. Six items fit this criterion with regard to customer satisfaction. Nine items fit this criterion for profitability outcomes, and eleven items fit this criterion for productivity outcomes. Five of the 13 items met this criterion with regard to turnover.
|
TABLE 2 Items with Meta-analytic r’s That Are Generalizable across Organizations |
||||
|
Core Item |
Customer |
Profitability |
Productivity |
Turnover |
|
1) Overall Satisfaction |
x |
x |
x |
|
|
2) Know what is expected |
x |
x |
x |
x |
|
3) Materials/equipment |
x |
x |
||
|
4) Opportunity to do what I do best |
x |
x |
x |
|
|
5) Recognition/praise |
x |
x |
x |
|
|
6) Cares about me |
x |
x |
x |
x |
|
7) Encourages development |
x |
x |
|
|
|
8) Opinions count |
x |
x |
|
|
|
9) Mission/purpose |
x |
|
||
|
10) Committed—quality |
x |
x |
|
|
|
11) Best friend |
x |
x |
|
|
|
12) Talked about progress |
x |
x |
|
|
|
13) Opportunities to learn and grow |
x |
|
||
Computation of Dimension Correlations
Items were combined into four frequently used theoretical constructs taught by the Gallup School of Management:
Base Camp: “What do I get?”
Item 2 Know what is expected
Item 3 Materials/equipment
Camp 1: “What do I give?”
Item 4 Opportunity to do what I do best
Item 5 Recognition/praise
Item 6 Cares about me
Item 7 Encourages development
Camp 2: “Do I belong?
Item 8 Opinions count
Item 9 Mission/purpose
Item 10 Committed—quality
Item 11 Best friend
Camp 3: “How can we grow?”
Item 12 Talked about progress
Item 13 Opportunities to learn and grow
The reliabilities of the above composite dimensions are reviewed in Harter (1998).
Reliability estimates of the above dimensions and the sum of the 12 items (all except overall satisfaction) were used to correct for independent variable measurement error. In estimating composite dimension correlations with criteria, a distribution of interitem correlations was compiled at the aggregate business unit level and combined across 12 studies. While a majority of the 12 items were included in most of the studies, the number of items included varied from study to study. For this reason, item statistics were calculated and the meta-analytic estimates of items were used to compute composite dimension correlations with various criteria. Since both Yes/No/Don’t Know scales and one-to-five-point Likert scales were used interchangeably across studies, the researchers calculated weighted average interitem correlations based on the proportion of Yes/No/Don’t Know and one-to-five-point scales used.
For the overall sample of studies, 19 studies used a one-to-five-point scale and 9 used a Yes/No/Don’t Know scale. The weighted average interitem correlations, based on the above overall study proportions, are provided in Appendix B. Interitem correlations were needed for the composite score estimation (Hunter & Schmidt, 1990, p. 455). Composite scores were calculated as follows:
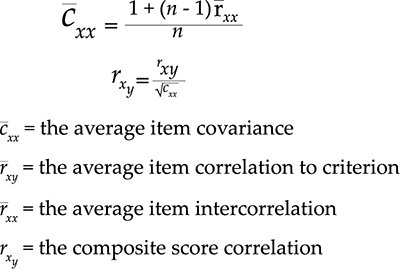
For the sum of the 12 items, the true score correlation is .19 to customer satisfaction/loyalty, profitability, and productivity criteria. (For true score correlations, the denominator becomes the square root of the dependent variable reliability multiplied by the square root of the independent variable reliability.) The true score correlation is negative to turnover, but at a lesser magnitude. The dimension correlated highest with turnover is Base Camp. As such, business units with employees who indicate they know what is expected of them and have the materials and equipment to do their work right tended to have lower turnover in comparison to other business units. The dimension most highly correlated with profitability was Camp 1. Dimensions most highly related to customer satisfaction/loyalty outcomes were Base Camp and Camp 2. Camp 3 was least highly correlated with business outcomes, although it was positively related to customer satisfaction, profitability, and productivity.
For more detail on these and other discoveries, please see the report “A Meta-analysis and Utility Analysis of the Relationship between Core Employee Perceptions and Business Outcomes,” prepared by Dr. Jim Harter and Ame Creglow, available from our world headquarters at 47 Hulfish St., Princeton, N.J. The excerpt above was written in 1998. The report is updated every year with the latest discoveries from Gallup’s research.