CHEAP FOOD?
One of the goals of this book was to see what it took to eat well on a budget. You can see on the next two pages how my spending broke down over time in each job, and how it compares to the average spending for American families at different income levels. There is no data for the spending of single adult households at varying income levels, and I would naturally spend less as a single adult than as a parent, so the most comparable numbers are the percentages. Detailed documentation of my spending, including receipts and the like, can be found at www.americanwayofeating.com. Judged by the numbers, I faltered badly at eating economically in the beginning but got much better about it as time went on.
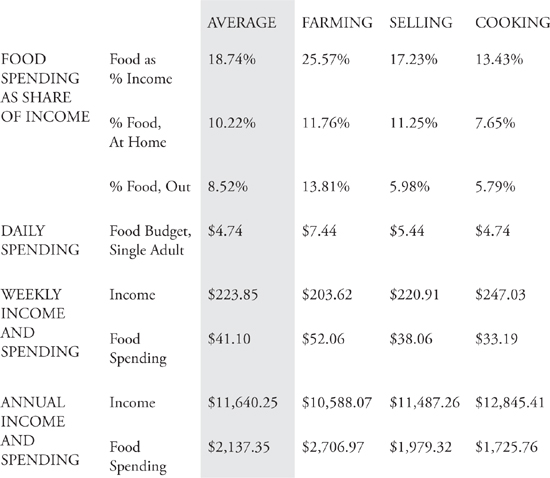
Take, for instance, my time in the fields, where I was spending more than one-third of my meager income on food. Unwilling to buy processed junk food, unaccustomed to weathering bouts of intense hunger, and living in shared homes where I felt uncomfortable using the kitchen, I repeatedly purchased pre-made food instead of cooking my own. I also relied heavily on the meals my landlords would share with me. On many days, I spent as much as $3, $4, even $5 on fresh sandwiches and coffee, when $1 would have gotten me something off the dollar menu at the local McDonald’s. On average, I spent more than $7 a day on my meals as a farm worker, a foolish practice for someone earning $150 a week. This strategy would also have failed me in the long run, since I was digging into savings to cover the cost of these extravagant meals.
On average, I spent about 19 percent of my income on food, with 10 percent spent on groceries and 9 percent spent on meals away from home. This varied dramatically depending on my earnings, though: As a farmworker I spent more than a quarter of my earnings on food, while as a restaurant worker I was spending half as much.
I earned the least as a farmworker but spent the most on food. New to economizing on my meals and incredibly hungry besides, I spent more than $7 a day feeding myself, above the national average per person. By the time I’d moved into work at Applebee’s, food ran me less than $5 a day.
NOTES
Daily food budget based on average spending on food for duration of project; weekly income based on weeks actually worked; weekly food spending based on actual expenditures; annual income and food spendings are projections, based on weekly figures projected for 52 weeks; food as share of income, and spending at home and out, based on weekly figures.
Although the average American household spends about 11 percent of their income on food, the numbers break down very differently depending on income.
Take the 10 percent of American households earning between $10,000 and $15,000 a year. They spend 36 percent of their income on food. Meanwhile, the richest families—the top 10 percent, who earn $70,000 a year or more—spend just 9 percent of their income on food.

NOTES
All data on income and food spending drawn from annual figures reported by the Bureau of Labor Statistics for 2009.
The dollar figures being tossed around above may sound unusually low to anyone who’s been following the national debate over our meals. Today’s conventional wisdom holds that Americans spend too little on what they eat, often bolstered by statements that Americans spend only 7 (or, sometimes, 10 or 12) percent of their income on food. The lower numbers are usually drawn from estimates of Americans’ average grocery bill—which represents just over half of what we spend on food overall. We spend nearly as much on meals someone else prepares for us, whether it’s at a sit-down restaurant or a drive-through window. So a truly accurate picture of what we spend on food includes both at-home and away-from-home meals.
When accounting for meals at restaurants and at home, Americans spend an average of 13 percent of their income on food, but the key word here is average; spending breaks down very differently depending on how much money you earn. In 2009, households earning less than $30,000 a year spent between 21 and 36 percent of their income on food, while families earning $70,000 or more spent just 9 percent. (Interestingly, all families spend between 14 and 18 percent of their grocery budget on fruits and vegetables, with the greatest share being spent not by the affluent but by those families earning between $15,000 and $19,999 each year.) That the rich spend less, as a proportion of income, is actually proof of a very old law in economics, Engel’s law, which stipulates that as income rises, the proportion dedicated to food will decrease—even if the actual dollar amount rises.
That’s because, as income rises, people who’ve established a basic diet begin to spend their money elsewhere. Even though my weekly income increased by 42 percent between the fields and Applebee’s, my other expenses, particularly rent, had as well. Had I continued to spend exactly the same amount of money on my meals in New York as I had in California, food would have represented about 21 percent of my income. But in California, with lower income, food took up 26 percent of my budget.
Here, this reminds me of my brief exchange in Detroit with Brenda, Christina’s sister. She talked about switching to Walmart for her groceries as her income dropped after a divorce, saving a quarter here and a three dimes there. Before embarking on this project, I’d have raised an eyebrow: an extra couple bucks each week? But these days, I’m right there with her.